CTKUSDT trade ideas

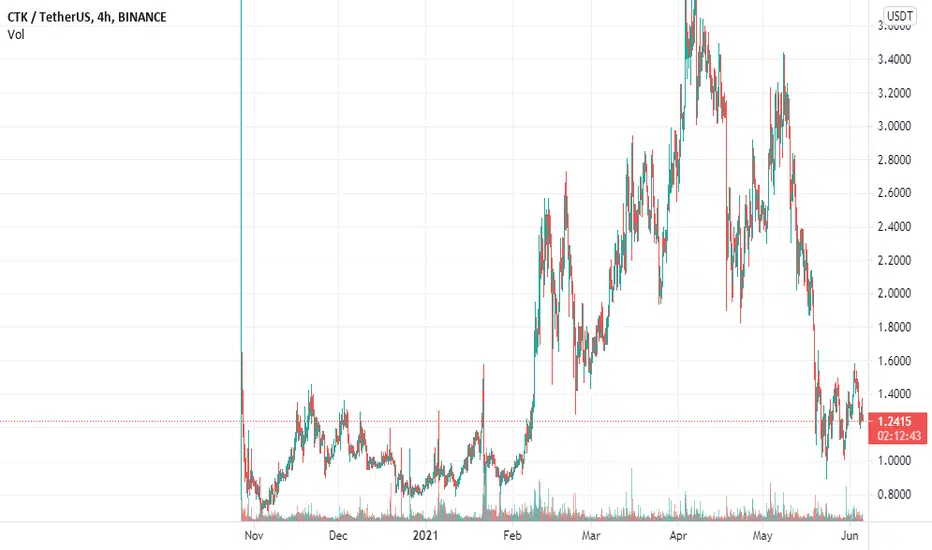
🆓CertiK (CTK) June-7 #CTK $CTKThe buying force is coming into CTK and it could generate a new rally up to 2$ or even 2.8$ zone this June. But only if it doesn't lose this 1.2$ zone
📈BUY
- Buy : 1.17-1.23$. SL if B
📉SELL
- Sell : 1.95-2.05$. SL if A
- Sell : 2.75-2.85$. SL if A
♻️BACK-UP
- Sell : 1.17-1.23$ if B. SL if A
- Buy : 0.97-1.03$ if A. SL if B
- Buy : 0.78-0.82$. SL if B
❓Details
🕯Timeframe : 1 Day
📈Red Arrow : Main Direction as BUY and SELL section
📉Blue Arrow : Back-Up Direction as BACK-UP section
🟩Green zone : Support zone as BUY section
🟥Red zone : Resistance zone as SELL section
🅰️A : The Close price of candlestick is Above the zone
🅱️B : The Close price of candlestick is Below the zone

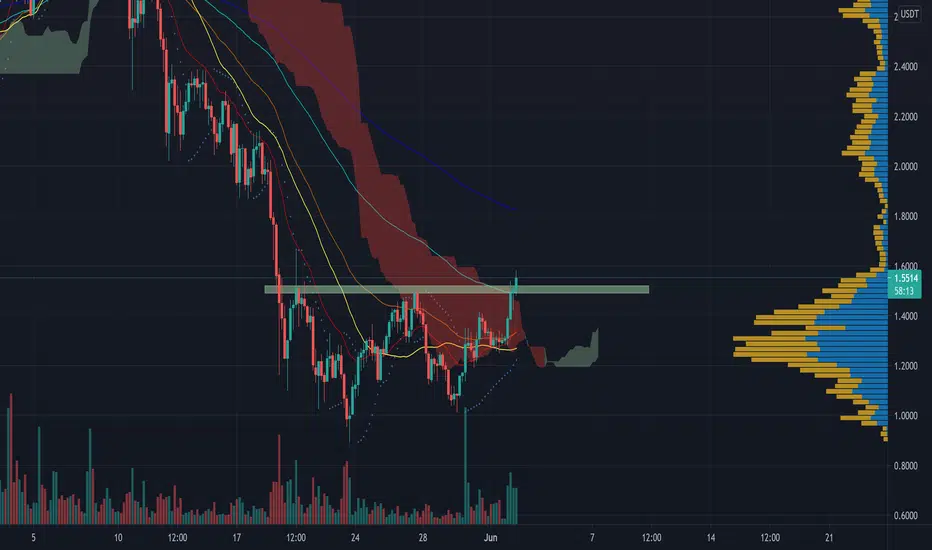
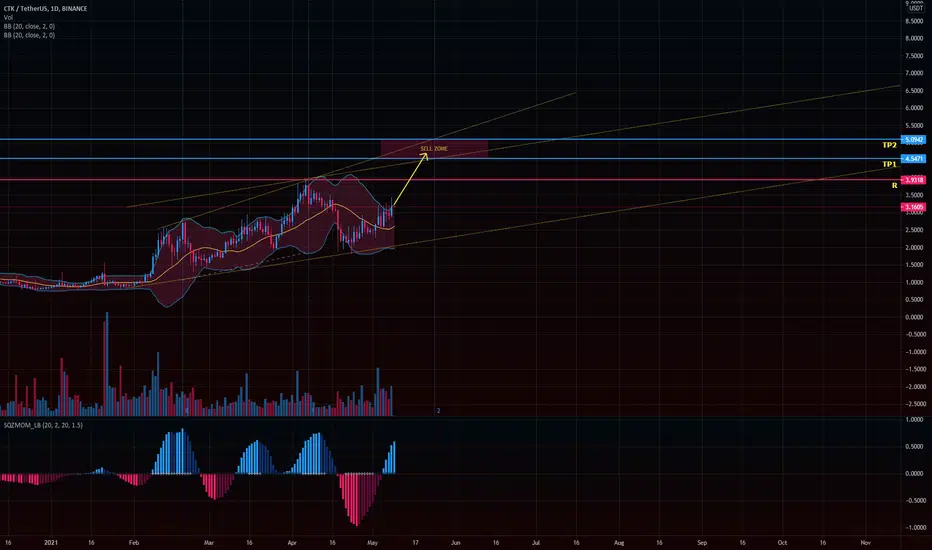
BINANCE: CTK/USDT🛒 Pair: CTK/USDT 🛒
== SPOT==
⏰ 1400/03/13 ⏰
🕰 02/06/2021 🕰
Duration:
📈 SHORT - MID 📈
Ex: Binance
#202
🛒 Buy : 1.52 - 1.52 🛒
👉Sell Targets👈
🎯TP1: 1.69 🥉
🎯TP2: 1.84 🥈
🎯TP3: 1.99 🥇
⛔️ SL: 1.39 by closing 4hrs Candle
Break out from horizontal resistance with good volume
Price reached above komu cloud in 4hrs tf
Negative funding rates
Golden cross in 4hrs tf
Double bottomed
price needs to fix above 1.50 for next leg up which is highly possible as we see bitcoin locally bullish.


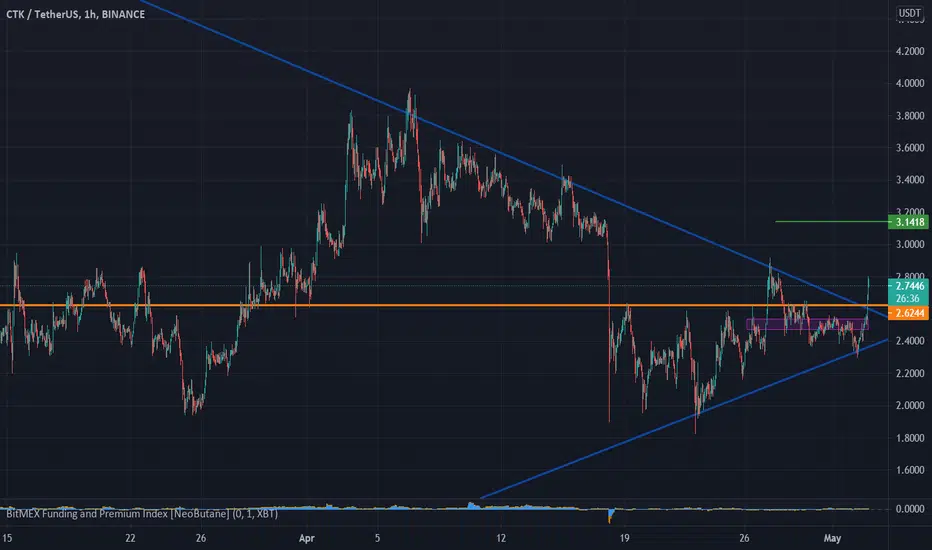
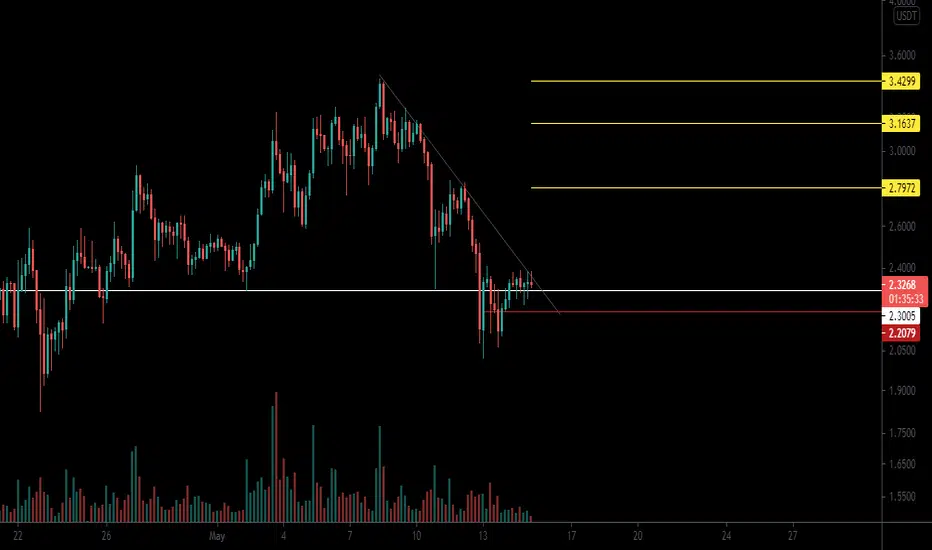
CTKUSDT Hello guys,
CTK is about to break resistance line, I will buy as soon as braking
Please manage ur risk and do ur analysis before trading
thanks for ur support
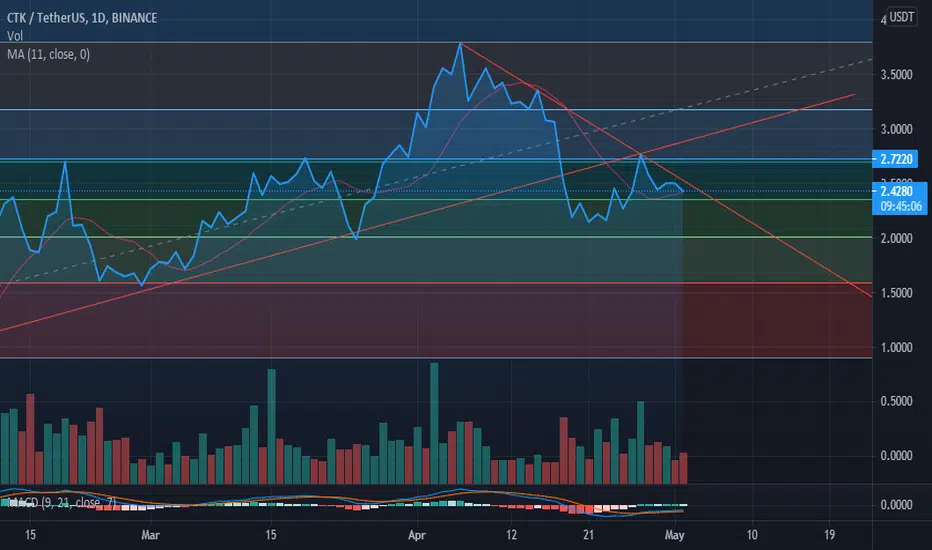
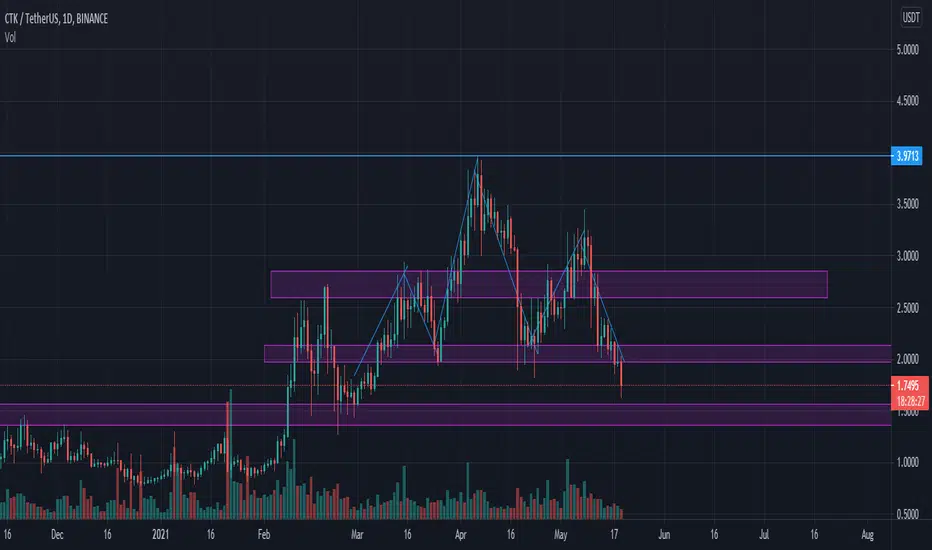
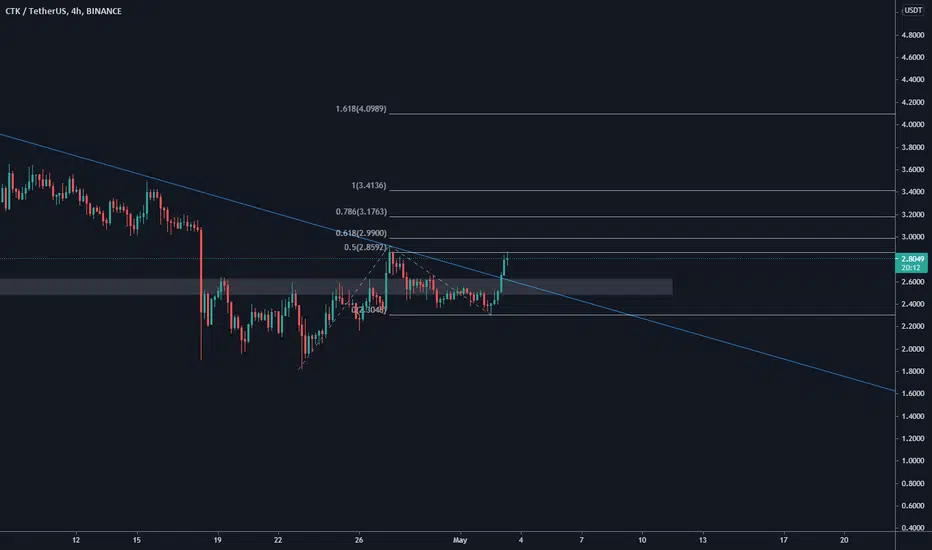
CTKUSDT UPDATE!!!! Hi Traders,
Looks like CTK has completed the Head and Shoulders formation and setting up for a LONG very soon. We could see a straight push back up in price through the MA's or see price consolidate in the short term (a push up to the MA's and back down into the top zone for buy volume to show itself and then prices to push back up to the buy side). It needs to be noted though that more liquidity is being held at the bottom zone, so if BTC decides to come down further you should expect CTK prices to do the same.
As always if you enjoy the content don't forget to click the like button and make a comment on your opinion.
Thanks
MS
⬇️⬇️⬇️⬇️⬇️⬇️⬇️⬇️⬇️⬇️⬇️⬇️⬇️⬇️⬇️⬇️⬇️⬇️⬇️⬇️⬇️⬇️⬇️⬇️⬇️⬇️⬇️⬇️⬇️⬇️⬇️⬇️⬇️⬇️⬇️⬇️⬇️⬇️⬇️⬇️⬇️⬇️⬇️⬇️⬇️⬇️⬇️⬇️⬇️⬇️⬇️⬇️⬇️⬇️⬇️⬇️⬇️⬇️⬇️⬇️⬇️⬇️⬇️⬇️⬇️⬇️⬇️⬇️⬇️

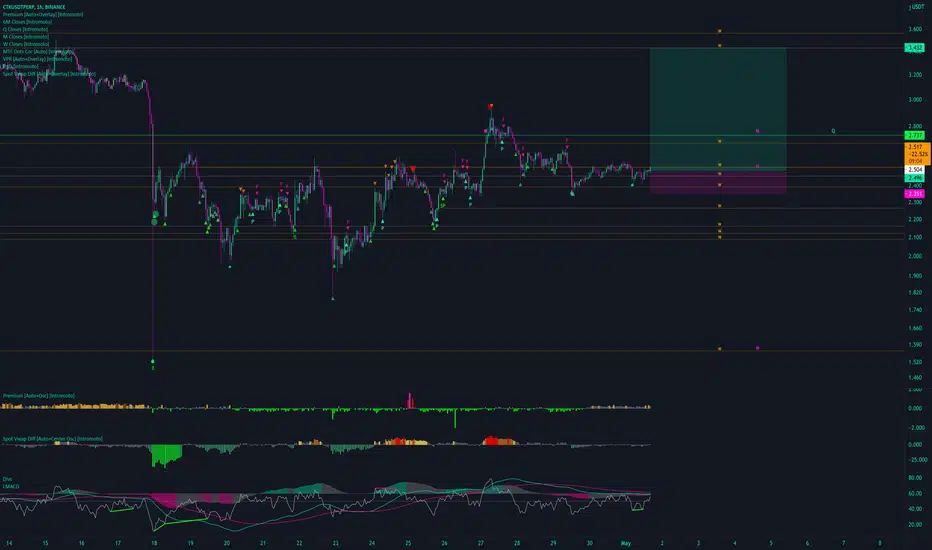
CTKUSDTPERP - Long - Potential 19.87%CTKUSDTPERP - Long - Potential 19.87%
Exchanges: Binance Futures
Signal Type: Regular (Long)
Leverage: Isolated (1X)
Entry Zone:
2.256 - 2.345
Take-Profit Targets:
1) 2.509
2) 2.813
Stop Targets:
1) 2.144
Trailing Configuration:
Entry: Percentage (0.0%)

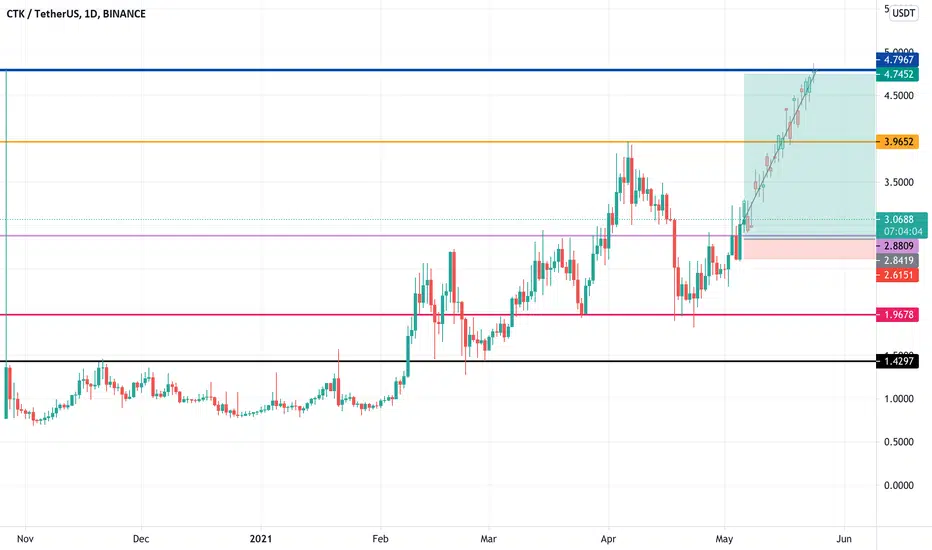
CTK Quarterly magnetShould cross over these two monthly/quarterly levels. Been chopping around for a while.
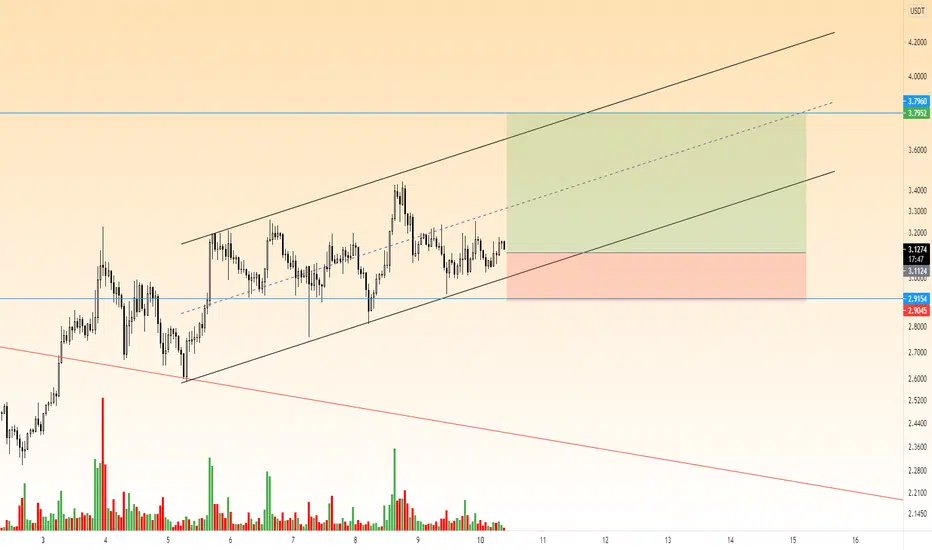

Hypothetical 50% ProfitIt seems to follow those channels.
Don't forget: I'm not a professional trader and this is just my opinion.
CTKUSDT Hello to you all. Mars Signals team wishes you high profits at all times.
The price has broken its resistance line and is starting to move upwards. We intend to be able to touch its targets over time.
Warning: This is just a suggestion to you and we do not guarantee profits.
Wish you luck!