#CVX/USDT Long#CVX
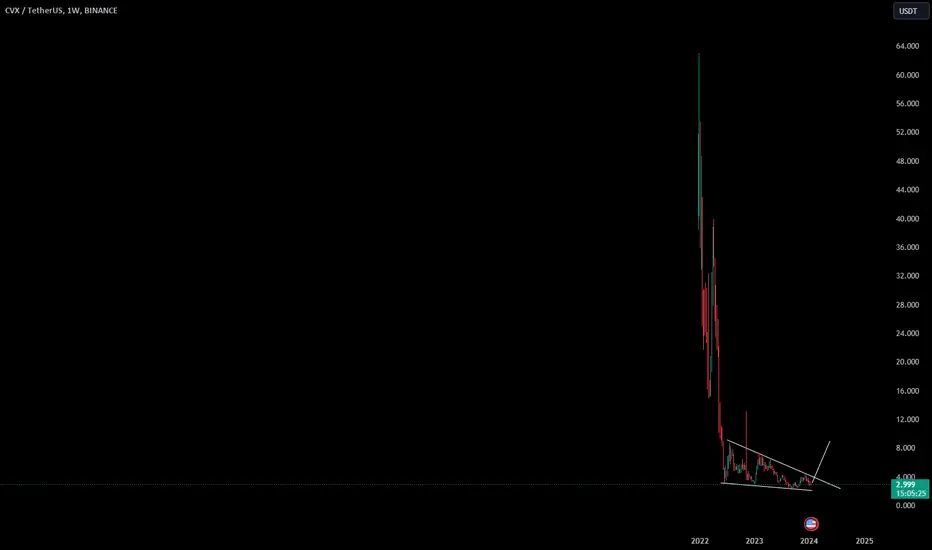
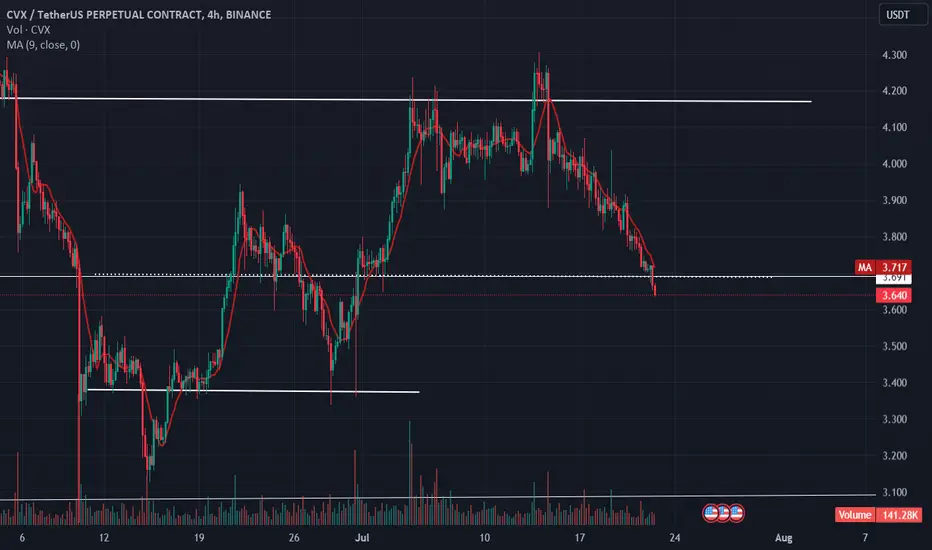
The price is moving in a descending triangle on the 4-hour frame
We have oversold conditions on the MACD indicator
We have a downtrend, and by breaking it, we have a good rise
Current price 2.74
The first goal is 2.86
Second goal 3.04
CVXUSDT.P trade ideas

CVX on the moveCVX is moving up with our buy prints and anything about our red line we can see fireworks as there is good volume our next expected target is 3.8 area and then 4.2 area. There is aslo a good volume generation. DyOR

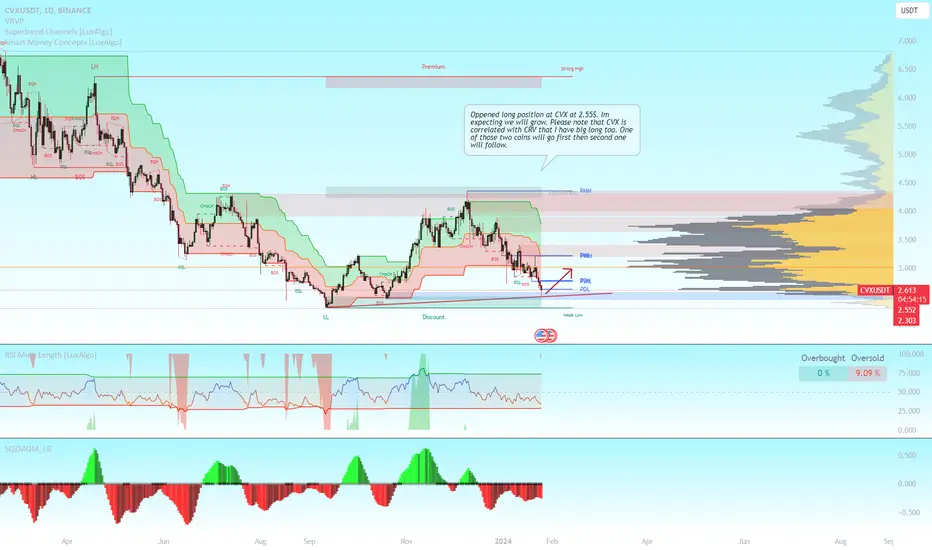
CVX - big longOppened long position at CVX at 2.55$. Im expecting we will grow. Please note that CVX is correlated with CRV that I have big long too. One of those two coins will go first then second one will follow.
CVX bullish
.
.
.
.
.
.
This analysis is for educational purposes only and should not be considered financial advice. Trade responsibly with capital you can afford to lose.
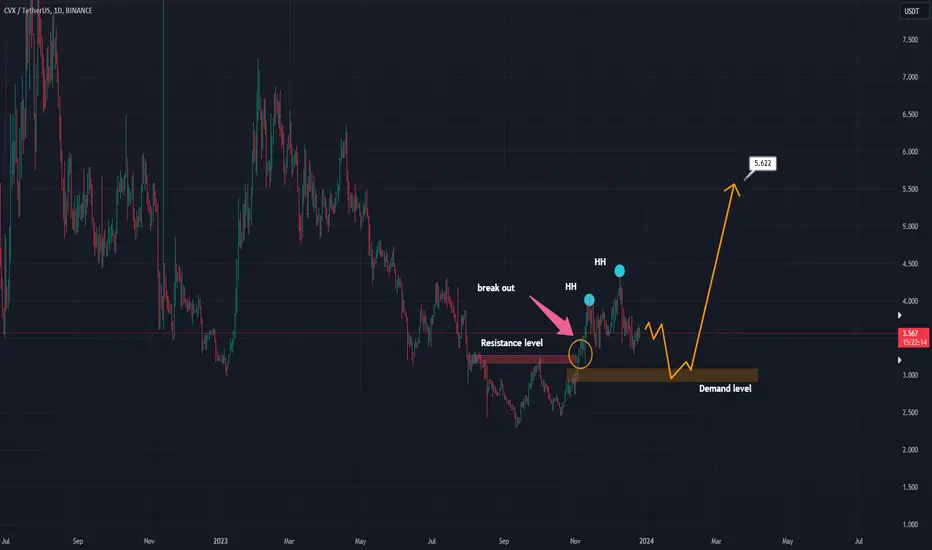
Check and analyze the daily time frame chartExamining the market structure in the daily time, we find that the price has been able to break a resistance level and stabilize it and form higher ceilings. Below them, where there is a shortage, a level of demand has been created, which can be entered into buying transactions with the return of the price.
CVX Targets Q4 2023
Convex Finance is a platform that boosts rewards for CRV stakers and liquidity providers alike, all in a simple and easy to use interface.
Sometimes they are also price corelated.
CRV can pump first and than smaller cap CVX pumps MORE !
However CRV is a safer bet as an asset allocation strategy
I like exposure to risk to i take in consideration CVX has a great potential here
(in the bull market) - at least in this growth cycle
The real bull-market can start somewhere in Q2 2024- 2026
Convex Finance #CVX inverse head and shoulders $7.25 tgtInteracting with the neckline
breakout could happen at any time
Good Luck.

🚨 Trade Alert: CVX/USDT (3-5x)🚨 New Trade Alert 🚨
✅ CVX/USDT (3-5x)
📉 LONG Entry Zone: 3.7 - 3.948
⛔️ SL: 3.497
🔒 Breakeven Move: When it moves close to TP2
🎯 Take Profit:
Short Term: 3.99 - 4.05 - 4.11 - 4.21 - 4.35
Mid Term: 4.45 - 4.55 - 4.65 - 4.75 - 4.97
📝 Ensure you set entry orders to balance the trade's entry and aim to secure 30% of profits within the first two targets. Once profits are gained, adjust the stop orders to match the entry points or break-even levels.
⚠️ Disclaimer: Historical earnings cannot assure future outcomes. Is there a potential for risk? Certainly. The entire financial market is susceptible to uncertainties; any underlying factor or abrupt shift in market sentiment could overturn the current market trends and lead to losses. Refrain from undertaking undue risks that might jeopardize your financial stability. You are under no obligation to engage in this trade; kindly avoid the trade if you disagree with the trade analysis.
GIS TRADING®

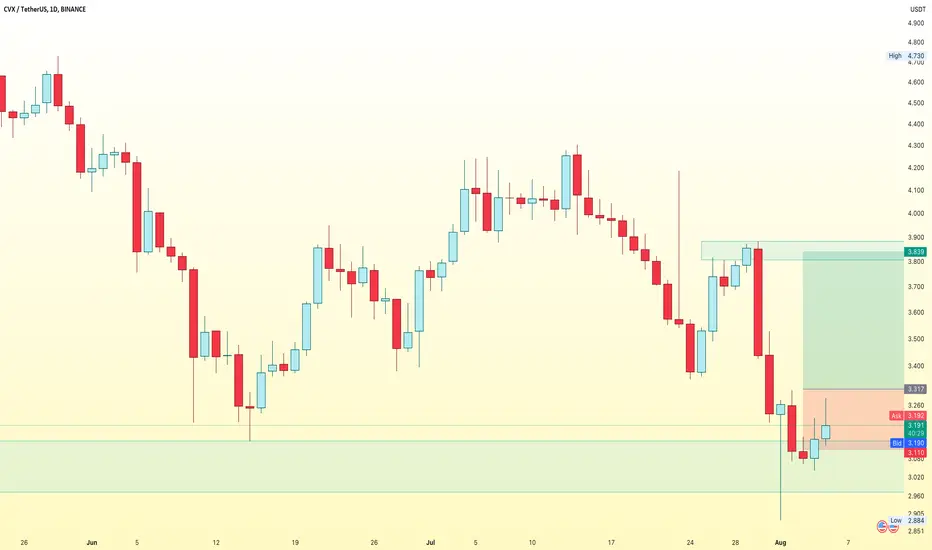
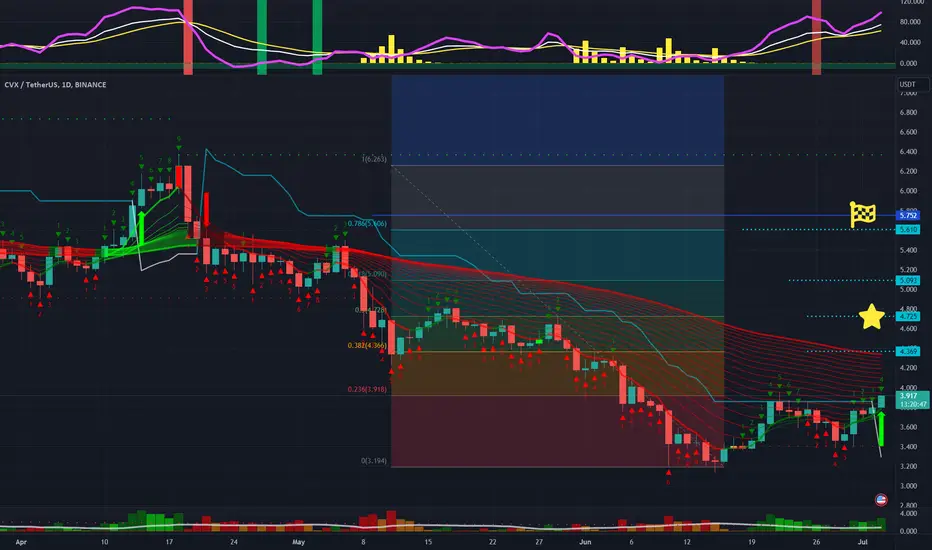
CVX/USDT Bullish Prospects Amid Supply Zone Challenge? 👀 🚀💎 Paradisers, gear up for a potential bullish wave in CVXUSDT as it currently navigates a critical supply zone, showing signs of a possible breakout.
💎Tracing its historical path, CVXUSDT has consistently demonstrated a knack for breaking above its descending trendline, leading to upward trends. Currently, as it retests the supply level at 3.843, the odds are leaning towards a breakthrough and a subsequent move towards a stronger resistance level.
💎 However, should CVXUSDT encounter a significant rejection at this point, a bullish strategy from the demand level of 3.303 might come into play. While some traders might be contemplating short positions at this juncture, the savvy investor should weigh their options carefully to stay ahead of the curve.
💎An additional factor to keep in mind is the potential for a downward trend if CVXUSDT fails to harness upward momentum from the demand level. A break below this point could lead to a substantial bearish movement.

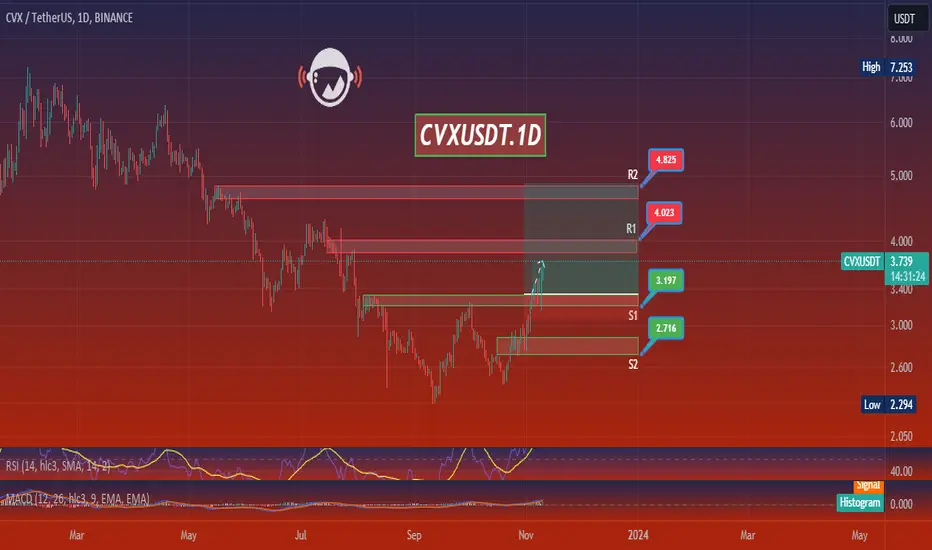
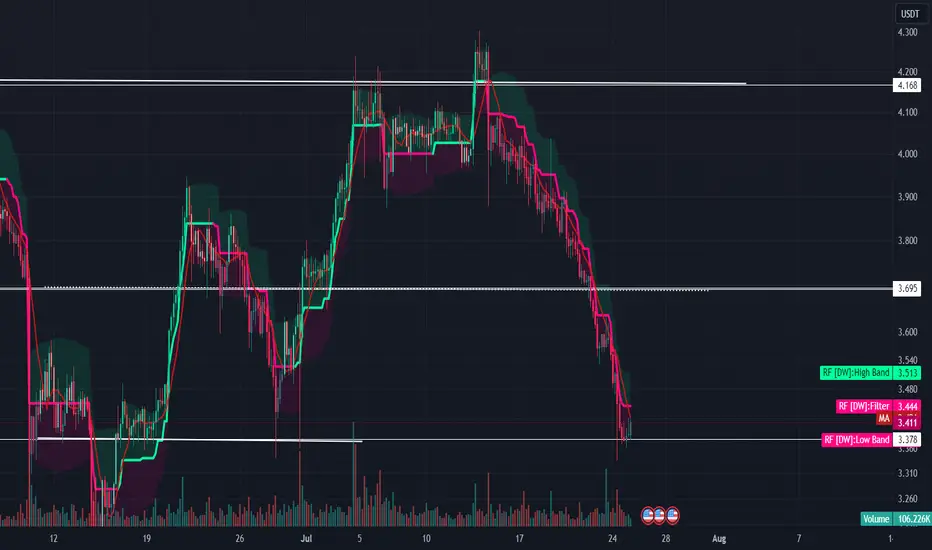
CVXUSDT.1DBased on the provided market data, the CVX currency is currently trading at 3.713 USDT. This is above the Bollinger Band (BB) 4-hour and 1-day values of 3.695 and 3.676 respectively, suggesting the currency is currently overbought. This is also supported by the Relative Strength Index (RSI) values for 4-hour and 1-day which are 67.66 and 81.28 respectively. RSI values above 70 generally indicate overbought conditions.
The Moving Average Convergence Divergence (MACD) values for the 4-hour and 1-day windows are positive, at 0.084 and 0.203 respectively. This typically indicates bullish momentum in the short term. However, the 7-day MACD is negative, which could indicate a bearish trend in the longer term.
The 4-hour support levels are at 3.484, 3.269 and 3.212 USDT, while the resistance levels are at 3.840, 4.019 and 4.039 USDT. On the 1-day timeframe, the support levels are at 3.091, 2.886 and 2.721 USDT, and resistance levels are at 3.787, 4.019 and 4.272 USDT. These levels can act as potential reversal points.
In the 7-day timeframe, the BB value is 4.102, which is higher than the current price, indicating that the currency is not overbought in the longer term. The support levels are at 3.161, 2.294 and 2.286 USDT with resistance levels at 4.084, 4.836 and 5.890 USDT.
In conclusion, while the short-term indicators suggest that CVX is currently overbought and could be due for a correction, the positive MACD values indicate bullish momentum. However, the negative 7-day MACD could suggest a longer-term bearish trend. Traders should watch the support and resistance levels closely for potential price reversals. This analysis is purely based on technical indicators and does not take into account any fundamental factors or news events. As always, it's recommended to use this analysis in conjunction with other research and risk management strategies.
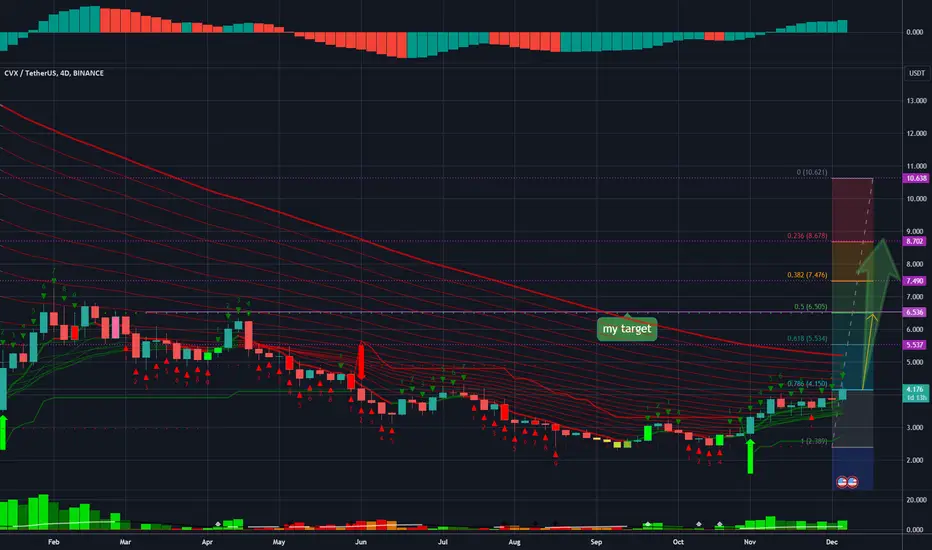
CVX IS BULLISHCVX looks bullish. I was checking the waves of this symbol when I noticed that a large diametric has formed on the chart. Wave E is over and now we are in wave F. By maintaining the green zone, CVX can move higher.
For risk management, please don't forget stop loss and capital management
When we reach the first target, save some profit and then change the stop to entry
Comment if you have any questions
Thank You

CVX = CRV, dont miss it BINANCE:CVXUSDT
CVX's chart is mostly same with CRV
CRV pumpp, next is CVX
Dont miss it
Do your own risk management.
Follow me for more chart analysis.
Patience is the key to success.
DYOR
CVXUSD ❕ reboundCVX broke up through 50EMA (30m TF)
RSI is moving in the buy zone at 1H and 30m TFs.
The chart will continue to bounce after overcoming resistance.

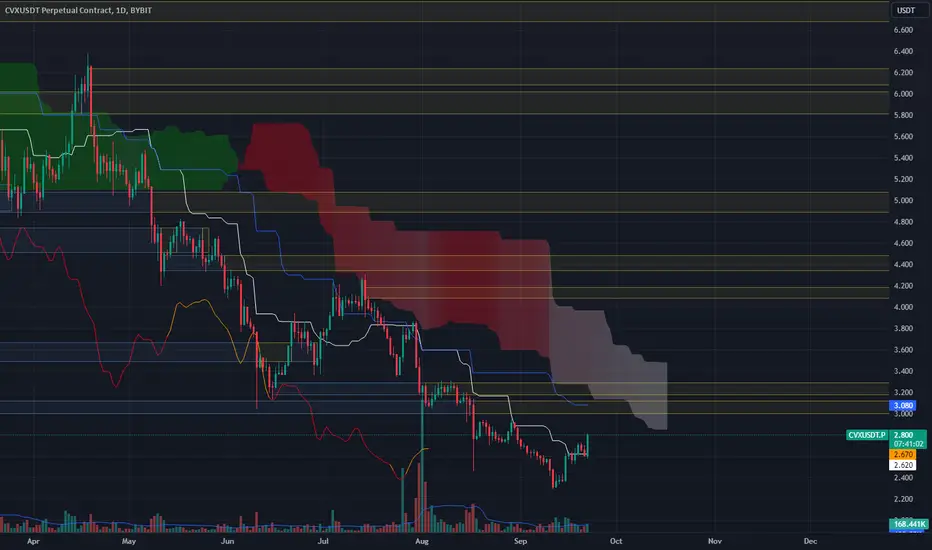
CVXUSDT Story through the Elliot Wave Lens💎The #CVXUSDT chart is currently painting a fascinating narrative, reminiscent of the classic Elliot Wave theory. Since the dawn of this year, the asset has witnessed a consistent dip. Between February and August, #CVX plummeted by a staggering 66.6%, leaving investors pondering about its future prospects.
💎However, there's a silver lining for the optimists. A few weeks ago, #CVX might have wrapped up its 5th downward wave, signaling the end of the Elliot Wave cycle. This speculation stems from the impeccable bounce off the 161.8% Fibonacci support, precisely at $2.416. Such a move often heralds a potential shift in the long-term trend, and our team is gearing up to respond.
💎Our next milestone? We're keenly observing the $3.13 supply zone, which previously played the role of a demand area. A confident breach above this threshold could see it morph back into a support zone, paving the way for a bullish trajectory. If this transformation occurs, #CVX might embark on an upward journey, possibly targeting the resistance bracket of $4.26 - $4.83. This could translate to a potential 50% price surge in the forthcoming weeks. But remember, this is just the initial resistance; there's room for the price to soar by 100% or even more.
For those eager to stay abreast of the evolving #CVX landscape, keep your eyes peeled for our updates.

CVXUSDT → The coin is preparing to break through resistance BINANCE:CVXUSDT against the backdrop of COINBASE:BTCUSD , which has been falling for a long time and finally stopped, is forming a rather interesting consolidation near the wedge resistance.
The coin on the chart is testing the bottom at 2.417, after which it forms a decrease in volatility and consolidation, within which the coin is creeping up to the trend resistance.There is a high probability that with a small bitcoin consolidation CVX will break the trend resistance and give a gorgeous bullish impulse.
If the accumulated potential is realized, the price could reach the 3.180, 4.235 and 6.400 area quite quickly.
The moving averages indicate a bearish trend, the price will have to go quite a long way to retest the SMA.
Support levels: 2.417
Resistance levels: wedge resistance, 3.180
The altcoin market is waiting for any bullish reaction in the market, including from bitcoin, which plays an important role in this market. Altcoins react weakly to the fall of the flagship and react strongly to the rise. We expect a breakout of the wedge
Regards R. Linda!

Three Bottom, Potential Profit Low RiskWeekly Chart
CVX BINANCE:CVXUSDT has a reversal pattern and creating Head Shoulders
Daily Chart
CVX has rejected the support with Pin Bar
So we need a BOS when price closed above the Pin Bar
Wait a next move
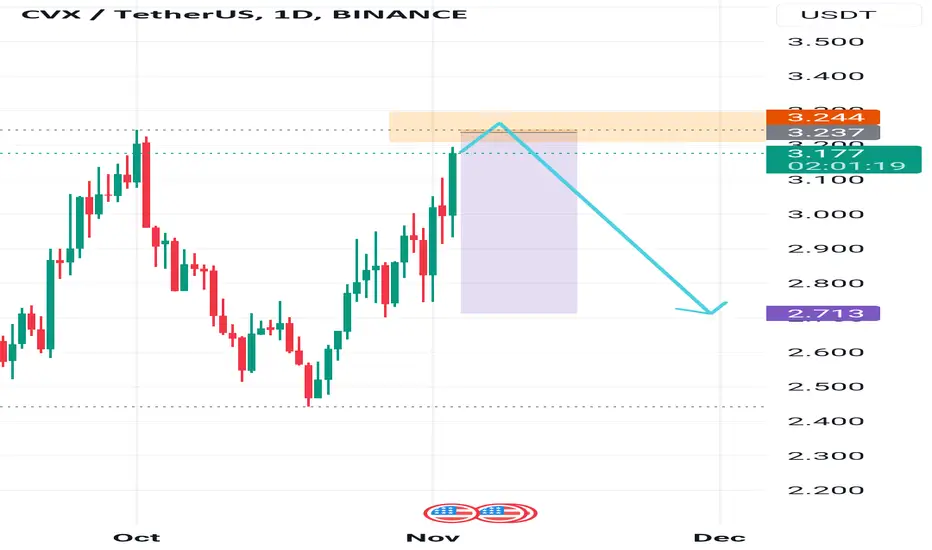
CVX SHORTWe can expect a short bearish trend from here as it is making double top we can take long when it reached to the top.
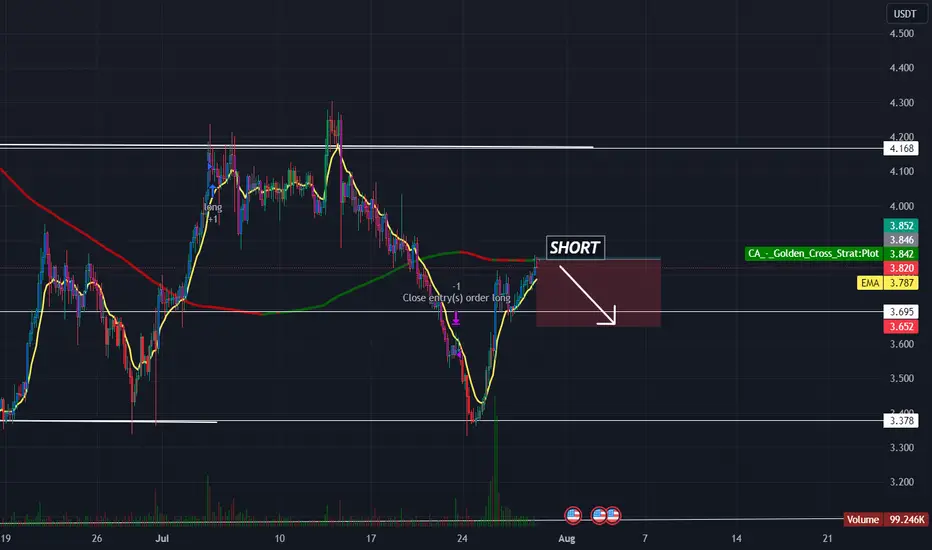
#CVX short#CVX short CVX right now it will dump around 10 %. because it had broken the resistance downward.
CVXUSDTHello Traders,
As we can see that CVX is on strong support and we expect a bullish move from here hold tight.
use proper stop loss as bitcoin is still not stable. cheers!
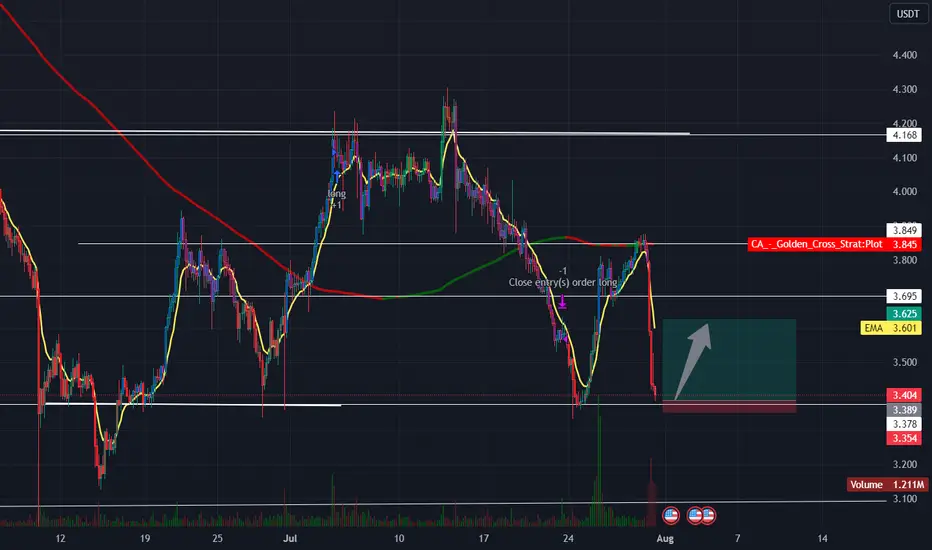
#CVX longgrab some cvx here as it is on the strong support we can see a bullish uptrend from volume shows a strong buying is going on. use proper stop loss as bitcoin is not stable.
CVX Convex Finance SignalRecently the alt-coin market gave many bullish signals
This is one coin i want to review today
Firstly we have a bullish signal from our indicator
Indicating the prior high level is about to be broken
On the other hand we have more bullish patterns like the W
This pattern is known to be a recovery one.
CVXUSD ❕ broke up the downward channelThe CVX has broken up 200EMA at 30m TF.
RSI values are above 50 points at 4H, 1H and 30m TFs.
I think the asset will continue to rise after it overcomes the current resistance level.
