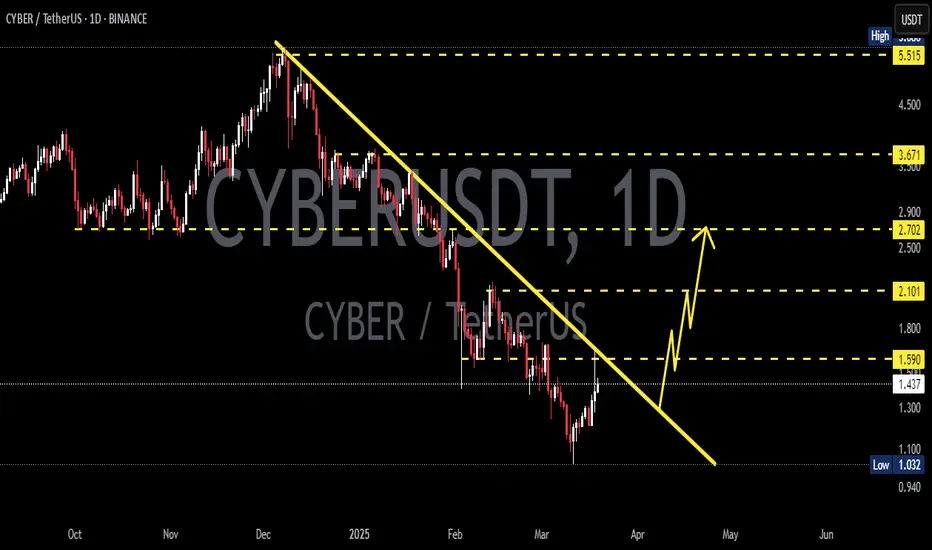
CYBERUSDT 1D#CYBER — Breakout & Retest in Play 🚀
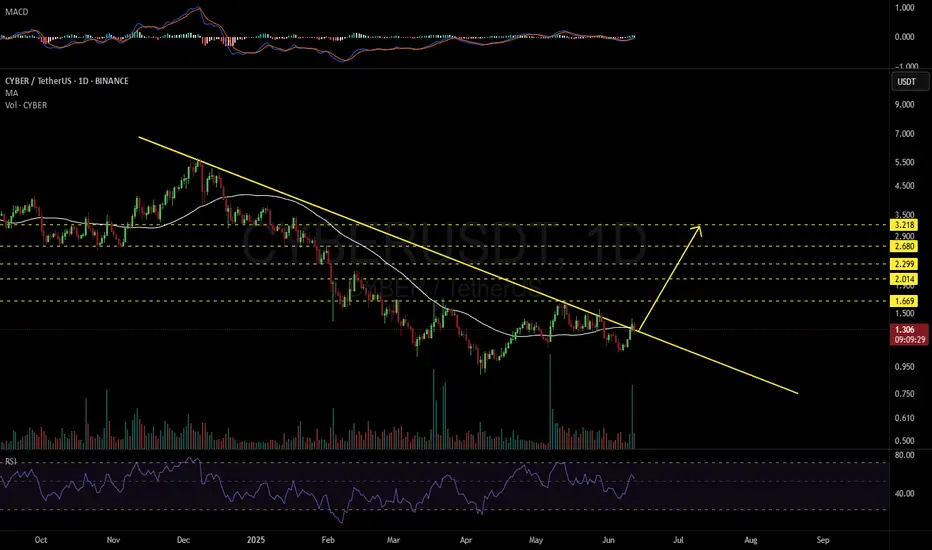
#CYBER has broken above the descending resistance and the MA50 on the daily chart, showing strong bullish momentum.
It is now retesting the broken trendline, which could act as a new support. If the retest holds, the next targets are:
🎯 $1.669
🎯 $2.014
🎯 $2.299
🎯 $2.680
🎯 $3.218
⚠️ Always use a tight stop-loss to manage risk and protect your capital.
CYBERUSDT.P trade ideas
CYBER/USDTKey Level Zone: 1.300 - 1.320
LMT v2.0 detected.
The setup looks promising—price previously trended upward with rising volume and momentum, then retested this zone cleanly. This presents an excellent reward-to-risk opportunity if momentum continues to align.
Introducing LMT (Levels & Momentum Trading)
- Over the past 3 years, I’ve refined my approach to focus more sharply on the single most important element in any trade: the KEY LEVEL.
- While HMT (High Momentum Trading) served me well—combining trend, momentum, volume, and structure across multiple timeframes—I realized that consistently identifying and respecting these critical price zones is what truly separates good trades from great ones.
- That insight led to the evolution of HMT into LMT – Levels & Momentum Trading.
Why the Change? (From HMT to LMT)
Switching from High Momentum Trading (HMT) to Levels & Momentum Trading (LMT) improves precision, risk control, and confidence by:
- Clearer Entries & Stops: Defined key levels make it easier to plan entries, stop-losses, and position sizing—no more guesswork.
- Better Signal Quality: Momentum is now always checked against a support or resistance zone—if it aligns, it's a stronger setup.
- Improved Reward-to-Risk: All trades are anchored to key levels, making it easier to calculate and manage risk effectively.
- Stronger Confidence: With clear invalidation points beyond key levels, it's easier to trust the plan and stay disciplined—even in tough markets.
Whenever I share a signal, it’s because:
- A high‐probability key level has been identified on a higher timeframe.
- Lower‐timeframe momentum, market structure and volume suggest continuation or reversal is imminent.
- The reward‐to‐risk (based on that key level) meets my criteria for a disciplined entry.
***Please note that conducting a comprehensive analysis on a single timeframe chart can be quite challenging and sometimes confusing. I appreciate your understanding of the effort involved.
Important Note: The Role of Key Levels
- Holding a key level zone: If price respects the key level zone, momentum often carries the trend in the expected direction. That’s when we look to enter, with stop-loss placed just beyond the zone with some buffer.
- Breaking a key level zone: A definitive break signals a potential stop‐out for trend traders. For reversal traders, it’s a cue to consider switching direction—price often retests broken zones as new support or resistance.
My Trading Rules (Unchanged)
Risk Management
- Maximum risk per trade: 2.5%
- Leverage: 5x
Exit Strategy / Profit Taking
- Sell at least 70% on the 3rd wave up (LTF Wave 5).
- Typically sell 50% during a high‐volume spike.
- Move stop‐loss to breakeven once the trade achieves a 1.5:1 R:R.
- Exit at breakeven if momentum fades or divergence appears.
The market is highly dynamic and constantly changing. LMT signals and target profit (TP) levels are based on the current price and movement, but market conditions can shift instantly, so it is crucial to remain adaptable and follow the market's movement.
If you find this signal/analysis meaningful, kindly like and share it.
Thank you for your support~
Sharing this with love!
From HMT to LMT: A Brief Version History
HM Signal :
Date: 17/08/2023
- Early concept identifying high momentum pullbacks within strong uptrends
- Triggered after a prior wave up with rising volume and momentum
- Focused on healthy retracements into support for optimal reward-to-risk setups
HMT v1.0:
Date: 18/10/2024
- Initial release of the High Momentum Trading framework
- Combined multi-timeframe trend, volume, and momentum analysis.
- Focused on identifying strong trending moves high momentum
HMT v2.0:
Date: 17/12/2024
- Major update to the Momentum indicator
- Reduced false signals from inaccurate momentum detection
- New screener with improved accuracy and fewer signals
HMT v3.0:
Date: 23/12/2024
- Added liquidity factor to enhance trend continuation
- Improved potential for momentum-based plays
- Increased winning probability by reducing entries during peaks
HMT v3.1:
Date: 31/12/2024
- Enhanced entry confirmation for improved reward-to-risk ratios
HMT v4.0:
Date: 05/01/2025
- Incorporated buying and selling pressure in lower timeframes to enhance the probability of trending moves while optimizing entry timing and scaling
HMT v4.1:
Date: 06/01/2025
- Enhanced take-profit (TP) target by incorporating market structure analysis
HMT v5 :
Date: 23/01/2025
- Refined wave analysis for trending conditions
- Incorporated lower timeframe (LTF) momentum to strengthen trend reliability
- Re-aligned and re-balanced entry conditions for improved accuracy
HMT v6 :
Date : 15/02/2025
- Integrated strong accumulation activity into in-depth wave analysis
HMT v7 :
Date : 20/03/2025
- Refined wave analysis along with accumulation and market sentiment
HMT v8 :
Date : 16/04/2025
- Fully restructured strategy logic
HMT v8.1 :
Date : 18/04/2025
- Refined Take Profit (TP) logic to be more conservative for improved win consistency
LMT v1.0 :
Date : 06/06/2025
- Rebranded to emphasize key levels + momentum as the core framework
LMT v2.0
Date: 11/06/2025
- Fully restructured lower timeframe (LTF) momentum logic

$CYBERUSDT 6H chart Setup$CYBER/USDT Trade Setup
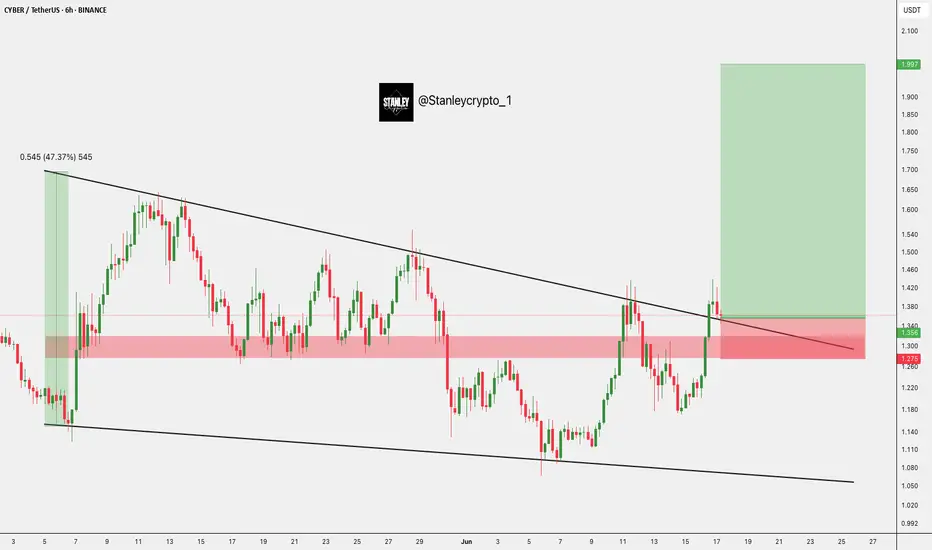
Breakout Retest on 6H chart
Entry: $1.362–$1.384
SL: $1.275
TP 1:- $1.753
TP 2:- $1.995
Hold above $1.362 for bullish continuation.
Watch for confirmation before entry.
DYRO, NFA
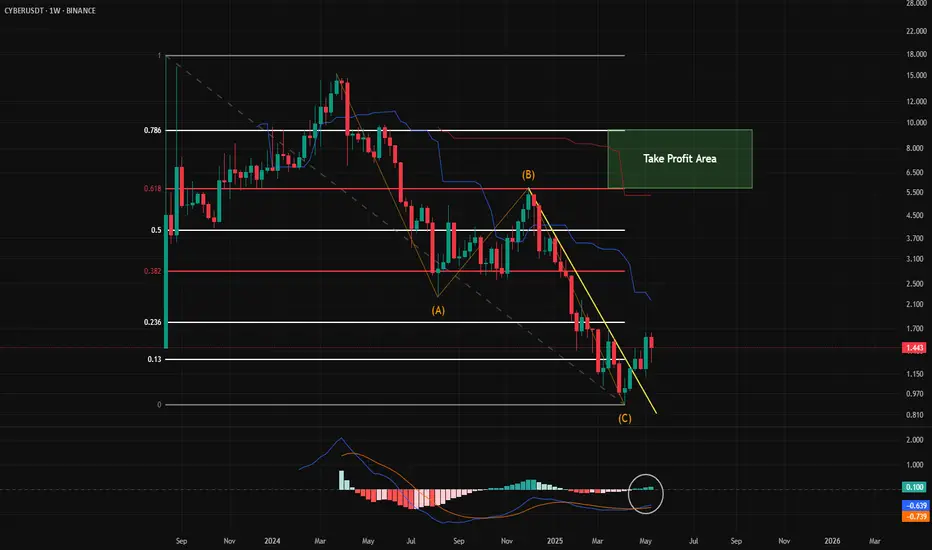
Cyber is cookingCyber has completed A-B-C correction and now it's ready to reach point B. If point B becomes support then uptrend continues.
NFA - not financial advice.
CYBER ANALYSIS🚀#CYBER Analysis : Pattern Formation
🔮As we can see in the chart of #CYBER that there is a formation Inverse Head And Shoulder Pattern and it's a bullish pattern. If the candle breaks and sustain above the neckline then a bullish move could be confirmed✅
🔰Current Price: $1.290
⚡️What to do ?
👀Keep an eye on #CYBER price action. We can trade according to the chart and make some profits⚡️⚡️
#CYBER #Cryptocurrency #TechnicalAnalysis #DYOR

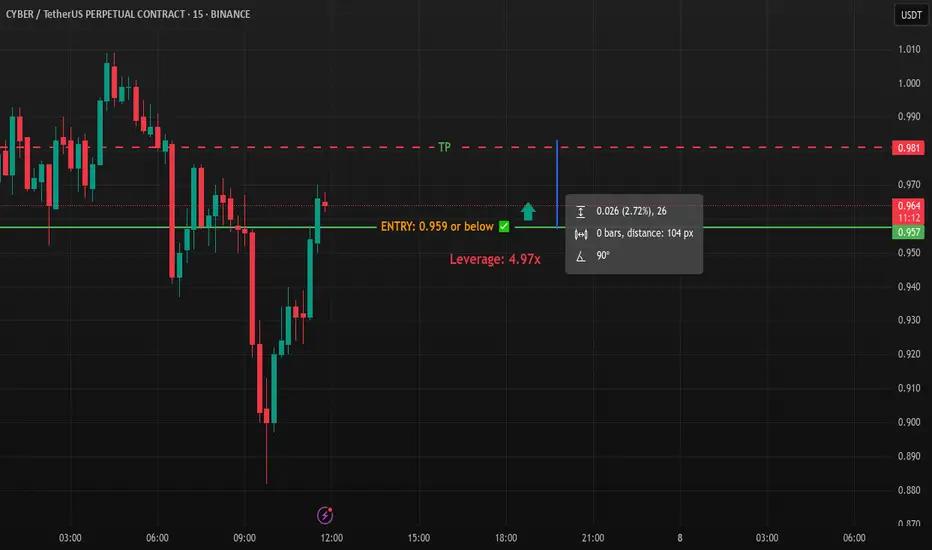
HiMonacci Strike | Long | CYBERUSDT | 3m🔹 Signal Type: HiMonacci Strike
🔹 Direction: LONG
🔹 Symbol: CYBERUSDT.P (BINANCE)
🔹 Timeframe: 3m
🔹 Entry Price: AT LEAST 0.96 (lower is okay in case of drawdown)
🔹 Close Price: 0.981
🔹 Leverage: 4.97x (Calculated based on liquidation at 0.778)
💥 RISK MANAGEMENT NOTE:
THIS SYSTEM DOES NOT USE STOPLOSS.
CAPITAL IS DIVIDED INTO 24 PARTS.
A CALCULATED LEVERAGE IS USED TO SET A SAFE LIQUIDATION LEVEL.
YOU CAN ENTER BELOW THE ENTRY PRICE IN CASE OF DRAWDOWN.
LIQUIDATION = SIGNAL FAILURE.
📈 How to Use:
This signal is part of the HiMonacci system.
Use the leverage provided to align your liquidation near the system’s calculated risk point.
Entering below the entry price is allowed (and often better) if there's a drawdown.
📬 Want to Automate It?
We offer FULL AUTOMATION on Binance, using your own account, 100% secure.
This system can generate 40-55% monthly on average.
Let the candles work for you! 🕯️📊
#HiMonacci
#CYBER/USDT#CYBER
The price is moving within a descending channel on the 1-hour frame, adhering well to it, and is heading for a strong breakout and retest.
We are seeing a bounce from the lower boundary of the descending channel, which is support at 1.46.
We have a downtrend on the RSI indicator that is about to break and retest, supporting the upward trend.
We are looking for stability above the 100 moving average.
Entry price: 1.52
First target: 1.587
Second target: 1.67
Third target: 1.67

CYBERUSDT 1DCYBER ~ 1D Analysis
#CYBER High risk trading. Buy after successfully penetrating this resistant line with a short -term target of at least 10+.
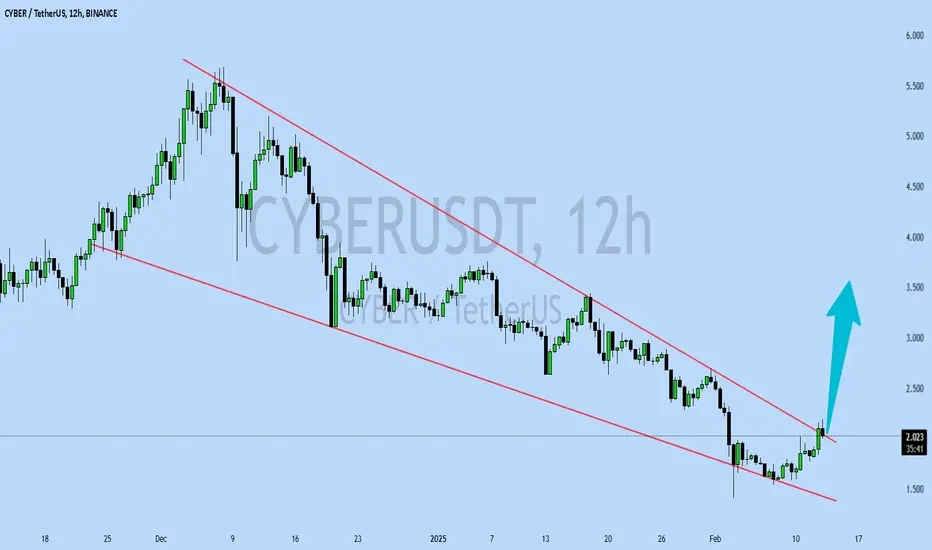
CYBERUSDT UPDATECYBERUSDT is a cryptocurrency trading at $2.026. Its target price is $3.500, indicating a potential 70%+ gain. The pattern is a Bullish Falling Wedge, a reversal pattern signaling a trend change. This pattern suggests the downward trend may be ending. A breakout from the wedge could lead to a strong upward move. The Bullish Falling Wedge is a positive signal, indicating a potential price surge. Investors are optimistic about CYBERUSDT's future performance. The current price may be a buying opportunity. Reaching the target price would result in significant returns. CYBERUSDT is poised for a potential breakout and substantial gains.
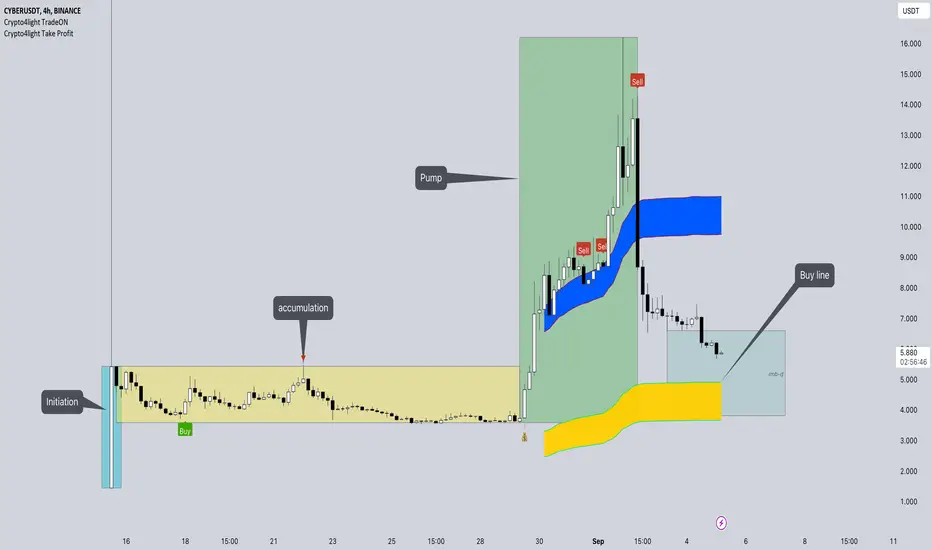
Cyber IAP model. What next?BINANCE:CYBERUSDT
Recommend you check education idea about IAP model, how to analyse coins after listing
Possible Targets and explanation idea
➡️After IAP model on 4H we can see correction
➡️Correction will be to first target is Buy line on Take profit indicator
➡️This level also will be a test of D imb zone
➡️Correction can be even under fundamental price (last line) 2.99 / 2.30
Hope you enjoyed the content I created, You can support with your likes and comments this idea so more people can watch!
✅Disclaimer: Please be aware of the risks involved in trading. This idea was made for educational purposes only not for financial Investment Purposes.
---
• Look at my ideas about interesting altcoins in the related section down below ↓
• For more ideas please hit "Like" and "Follow"!
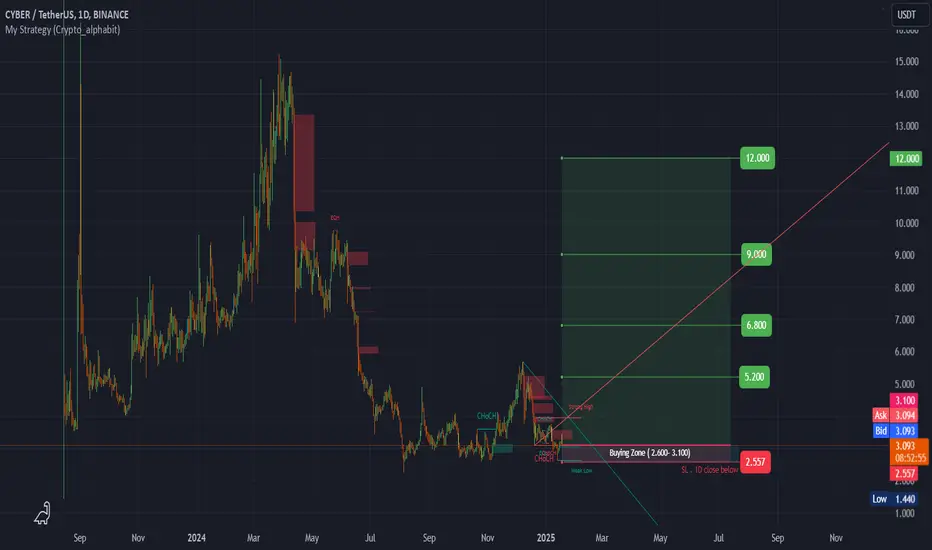
#CYBER (SPOT) IN ( 2.600- 3.100) T.(12.000) SL(2.557)BINANCE:CYBERUSDT
#CYBER/ USDT
Entry( 2.600- 3.100)
SL 1D close below 2.557
T1 5.200
T2 6.800
T3 9.000
T4 12.000
______________________________________________________________
Golden Advices.
********************
* collect the coin slowly in the entry range.
* Please calculate your losses before the entry.
* Do not enter any trade you find it not suitable for you.
* No FOMO - No Rush , it is a long journey.
Useful Tags.
****************
My total posts
tradingview.sweetlogin.com
**********************************************************************************************
#Manta #OMNI #DYM #AI #IO #XAI #ACE #NFP #RAD #WLD #ORDI #BLUR #SUI #VOXEL #AEVO #VITE #APE #RDNT #FLUX #NMR #VANRY #TRB #HBAR #DGB #XEC #ERN #ALT #IO #ACA #HIVE #ASTR #ARDR #PIXEL #LTO #AERGO #SCRT #ATA #HOOK #FLOW #KSM #HFT #MINA #DATA #SC #JOE #RDNT #IQ #CFX #BICO #CTSI #KMD #FXS #DEGO #FORTH #AST #PORTAL #CYBER #RIF #ENJ #ZIL #APT #GALA #STEEM #ONE #LINK #NTRN #COTI #RENDER #ICX #IMX #ALICE #PYR #PORTAL #GRT #GMT #IDEX #NEAR #ICP #ETH #QTUM #VET #QNT #API3 #BURGER #MOVR #SKL #BAND #ETHFI #SAND #IOTX #T #GTC #PDA #GMX #REZ #DUSK #BNX #SPELL #POWR #JOE #TIA #TFUEL #HOT #AVAX #WAXP #OGN #AXS #GALA #ONE #SYS #SCRT #DGB #LIT #QI #FIL #GLMR #ATOM #LTC #MANA #ONT #TLM #SLP #ROSE #NEO #EGLD
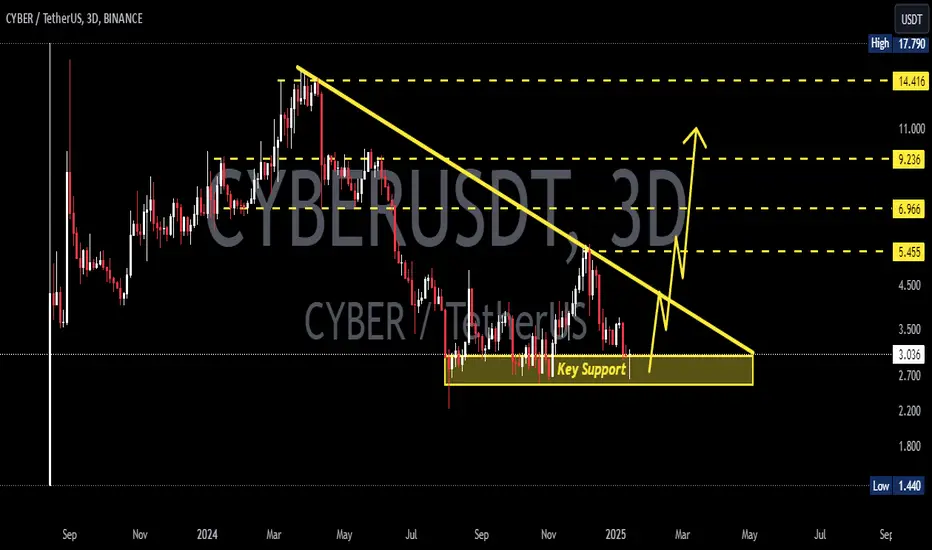
CYBERUSDT 3DCYBER ~ 3D
#CYBER If you still have Conviction on this coin,. This support block would be a very good buying place for now,. Buy in stages with a minimum target of 20%++
Is CYBERUSDT on the Verge of a Major Breakout? Yello Paradisers! Are you watching CYBERUSDT closely? If not, now’s the time. We’re at a critical point with a textbook W-pattern forming right at the supportive trendline of the ascending channel, and things are heating up! Let’s break it down.
💎The pair is currently respecting the ascending channel’s support, increasing the probability of a bullish move. But the key lies in what happens next:
💎If CYBERUSDT breaks through the resistance level and closes a candle above it, we’ll have a confirmed W-pattern. This will likely trigger a strong upward move, giving bulls the green light to step in.
💎If the price pulls back further, we’ll watch for inducement below the current level. This could bring the pair down to a strong support zone, where we’ll need to see bullish reversal patterns like a bullish I-CHoCH, W-pattern, or inverse head and shoulders on lower timeframes before considering long positions.
💎But let’s not jump the gun, Paradisers. If CYBERUSDT breaks down and closes below the strong support zone, it will invalidate the bullish setup entirely. In that case, it’s best to step aside and wait for better price action to develop.
Trade smart, Paradisers. Remember, it’s not about predicting every move—it’s about waiting for the right setup and striking with confidence. Patience is what keeps you in the winner’s circle. Stay focused and disciplined!
MyCryptoParadise
iFeel the success🌴

Cyber is waking upI am a newbie trader who works on simple charts and simple results. Cyber woke up already test support and go higher is inevitable

50% pump on CYBERA falling wedge pattern is observed on $CYBERUSDT.
A measured move gives a potential 50% price increase to about $5.2
Action
Buy $3.5- $3.78
Stop loss- $3.0
Take profit $5.5
Good luck!!
Weekly $CYBER prediction!It appears that $CYBER may lead the altcoin cryptocurrency pack when the market becomes fully bullish. I have identified critical areas for potential reversal or continuation patterns. If we breach the indicated solid lines, we can proceed to the next one. There is significant potential here, but it is up to traders to capitalize on it. I personally anticipate a 125% gain, but it could be more. Considerably more. Carefully observe the daily volume; when it spikes, we are ready to rock and roll.
I will update this chart as we progress.

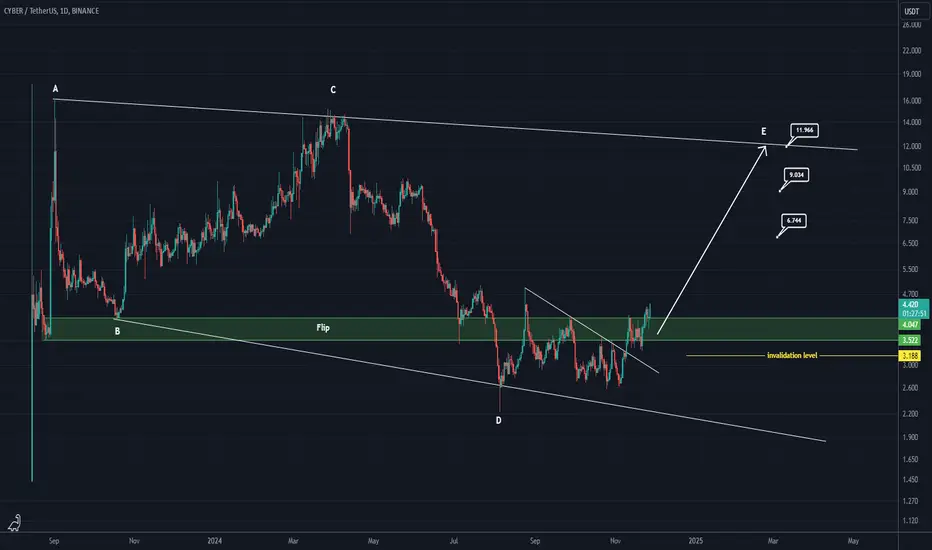
CYBER looks bullish (1D)It seems that CYBER has entered a bullish E wave. A significant trigger line has been broken, and it has stabilized around the flip zone. As long as the green support area is maintained, it can move towards the targets indicated on the chart.
Closing a daily candle below the invalidation level will negate this analysis.
For risk management, please don't forget stop loss and capital management
Comment if you have any questions
Thank You
Trade Signal for CYBERUSDT: Time to SellDirection: Sell
Enter Price: 3.704
Take Profit: 3.44866667
Stop Loss: 3.88166667
The current market analysis indicates a sell strategy for CYBERUSDT. Utilizing the EASY Quantum Ai strategy, the forecast shows potential downward momentum. Here's why this movement is anticipated:
1. Technical Indicators: Indicators such as the Relative Strength Index (RSI) and Moving Averages suggest overbought conditions, indicating a possible reversal. The analysis highlights a declining trend in momentum, supporting a sell signal.
2. Market Sentiment: Recent market sentiment analysis reveals an increasing bearish outlook, which aligns with the predicted sell movement. Social media sentiment and trading volume analytics demonstrate reduced investor confidence, further reinforcing this position.
3. Economic Factors: Current macroeconomic data and news events have shown unfavorable conditions impacting the broader cryptocurrency market. This could exert additional downward pressure on CYBERUSDT.
Traders are advised to execute the sell position at 3.704, secure potential profits by setting the take profit at 3.44866667, and protect against losses using a stop loss at 3.88166667. This carefully construed strategy leverages real-time data and advanced analytical tools, striving to optimize trading outcomes efficiently.

CYERCONNECT NEXT LEVEL
The thing I love about this chart BINANCE:CYBERUSDT is it volatility and precise trend direction. I have two scenario and this is the first one. We are in some sort of Accumulation / capitulation Phase just like in BINANCE:APEUSDT
You can either start buying partially or you simply wait for lower price if your patience won't run out.
The second scenario is very similar to the first, both bullish mid to long term the only difference is that the second scenario will keep going down from current price and keep ranging within the highlighted box till breakout.
PREVIOUS ANALYSIS
BINANCE:CYBERUSDT

CYBERCONNECT BLUEPRINT - NOW OR A LITTLE MORE PATIENCE
First let me draw your attention to my previous call on BINANCE:CYBERUSDT See all the accuracy along the line from top to bottom before I introduce you to the next blueprint for the next one year.
1. This was the first call
2. The Second
3. The Third
4. The Fourth
5. The Fifth
6. The Sixth
7. The Seventh
The major liquidity has been taken already and if the market makers are not greedy, we should start to see the whole bull run for this token #cyberusdt but if not then the previous swing low at $2.22 will be taken and there is another good entry zone to buy.
There are two entries clearly on the chart, if one invalidates the other should hold. If you want to save yourself from the hassle you can enter at the first entry partially and add to position on the second entry while the second stop loss serves as your invalidation level. ENJOY.
Overall, CYBERCONECT is bullish MID to LONG TERM and all the possible price movement is on the chart.

CYBERUSDTCYBER ~ 2D
#CYBER Make purchases gradually after successfully breaking through this downward pattern. with a minimum target of 15%++

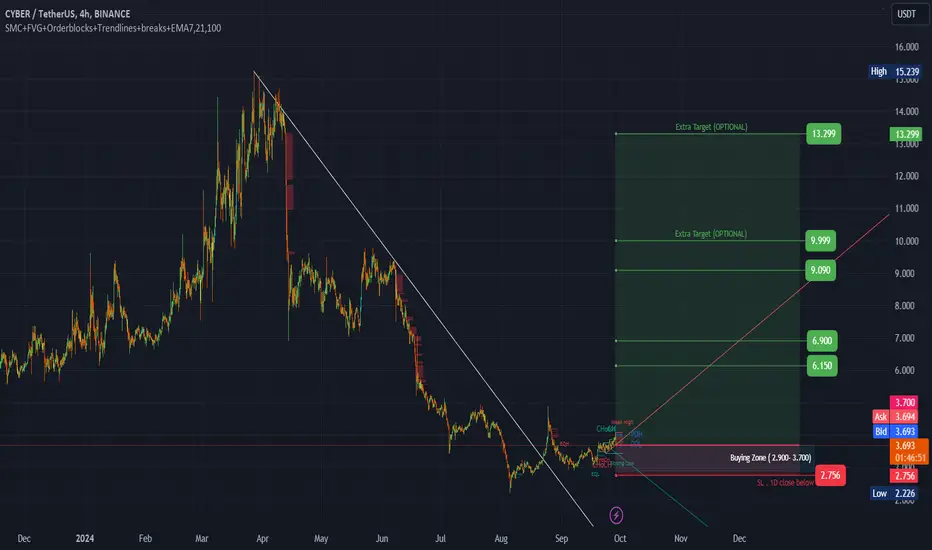
#CYBER (SPOT) entry range( 2.900- 3.700)T.(13.299) SL(2.756)***** This coin is short time investment *****
BINANCE:CYBERUSDT
entry range (2.900- 3.700)
Target1 (6.150) - Target2 (6.900)- Target3 (9.090)- Target4 (9.999)- Target5 (13.299)
2 last Extra Targets(optional) in chart, if you like to continue in the trade with making stoploss very high. **** but it is high probability to be achieved ***
SL .1D close below (2.756)
*** collect the coin slowly in the entry range ***
*** No FOMO - No Rush , it is a long journey ***
**** #Manta ,#OMNI, #DYM, #AI, #IO, #XAI , #ACE #NFP #RAD #WLD #ORDI #BLUR #SUI #Voxel #AEVO #VITE #APE #RDNT #FLUX #NMR #VANRY #TRB #HBAR #DGB #XEC #ERN #ALT #IO #ACA #HIVE #ASTR #ARDR #PIXEL #LTO #AERGO #SCRT #ATA #HOOK #FLOW #KSM #HFT #MINA #DATA #SC #JOE #RDNT #IQ #CFX #BICO #CTSI #KMD #FXS #DEGO #FORTH # AST #PORTAL #CYBER ****
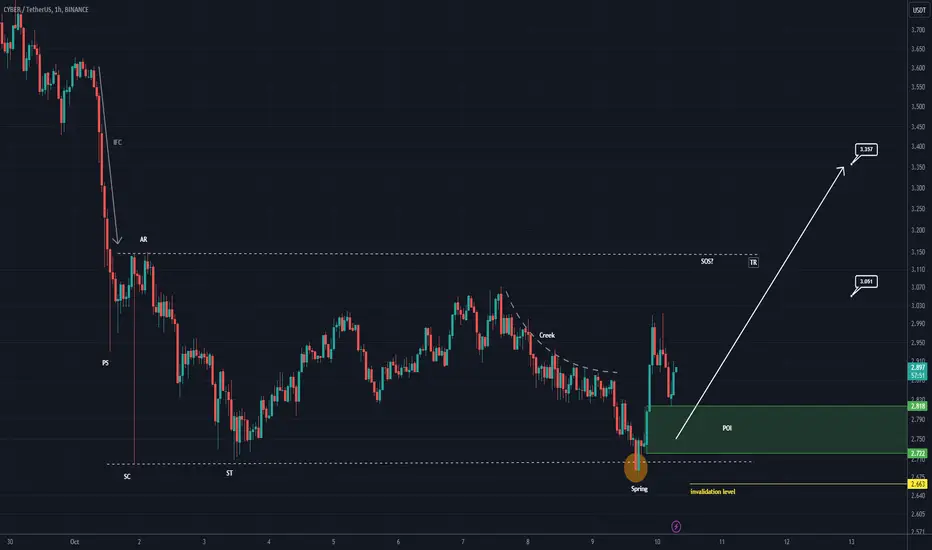
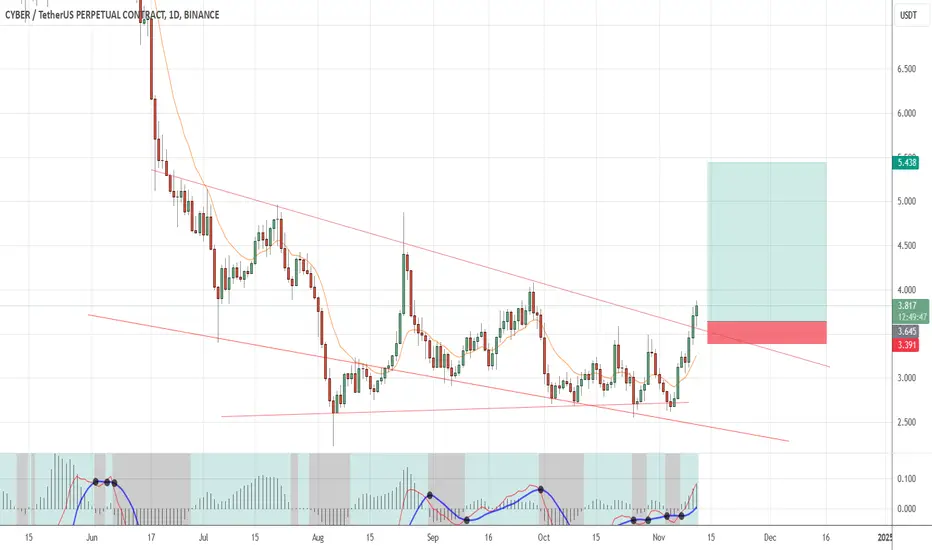
CYBER looks bullishCYBER appears to be in the "accumulation" phase. After the initial pullbacks, spring/hunt seems to be done.
A strong move/SOS can be expected from CYBER.
It has two targets ahead that we specified on the chart.
The green range is our entry range.
Closing a 4-hour candle below the invalidation level will violate this analysis
For risk management, please don't forget stop loss and capital management
When we reach the first target, save some profit and then change the stop to entry
Comment if you have any questions
Thank You