DASH/BTCAs I look at BTC.D it seems to me that Dom is loosing steam and has lost all 200 EMA's on all time frames from H1-W1 except for D1 for some reason BTC.D remains above 200 ema on the daily?? so I can totally see a retest of the daily 200 ema sitting around 66.4% which is a drop of around 2%. Which is starting to look like it could me money flowing into selected alts like $XTZ and $DASH which are down or flat in USD but up in BTC. So I am still in DASH looking for the H4 200 ema to break and the price to up on the Dom dump
DASHBTC trade ideas

OLDSCHOOL DASHEnter above MMA5, TP @ MMA10.
One of the large caps that should be invested in 2019-20 altseason(Plz. see my previous TOTAL2 analysis.)
Good luck!

DASH/BTCKeep it simple!
Looking at DASH on the monthly, we can see a strong down trend momentum. With this trade I will be very cautious, placing my buy entries in the blue box at the 6100 Sat's range. There is a good chance DASH finds support above this range at the orange boxes, but my retracement levels don't suggest this as a level to buy at. I have posted better trades with a greater risk to reward if you are eager to be in a trade!
I appreciate my buy range may be too conservative, but in trading it is better to only enter trades with a good risk to reward, than to gamble at finding the "bottom".
So for now i am bearish until I can see a level of support to be made, and higher low plays to be seen, followed by a test and break of a previous resistance.
At this point I will have my entries on the blue box, until I see a change in momentum to the downside.


DASHDASH / BTC
Exchange : #BINANCE
Buy : 8531
Target 1 : 9200 (8%)
Target 2 : 10000 (17%)
Target 3 : 10750 (26%)
Stop loss zone : 8000 ~ 7950
Telegram Public channel : t.me

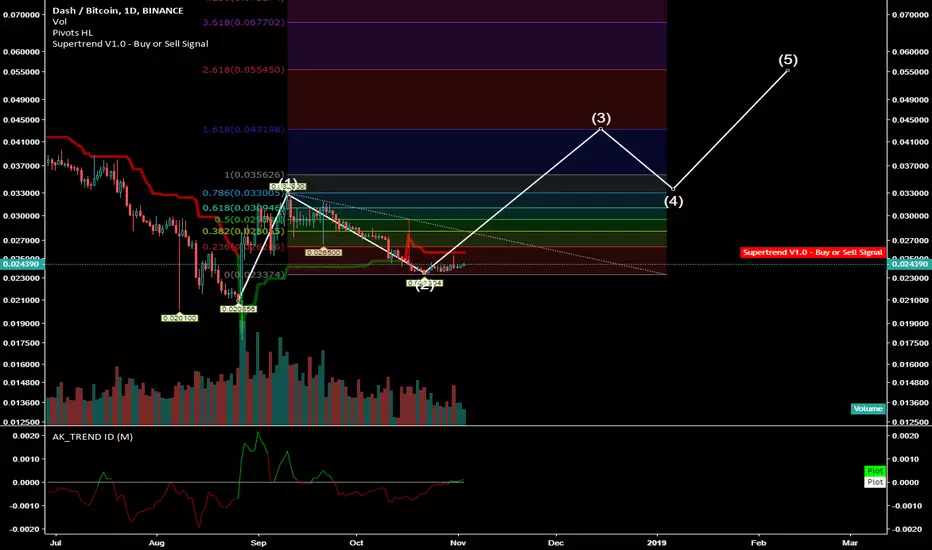
Which scenario is true for DASHHello, Traders!
Monfex is at your service and today we overview DASH/BTC .
On the chart we see a large rising channel or a bear flag . The price now near the channel support and has two scenarios:
1 there will be a breakdown of the flag down and for greater certainty we will consider the level of the red line near 0.00808 . As goals, we take Fibonacci levels of 100% (previous low), 127.20% and 161.80%.
2 a rebound from the support line up by the channel and the first target is the middle line of this channel near 38.2% and 23.6% Fibonacci. The green horizontal line as the flagship of the start of a bullish trend . Perhaps this is the second(2) Elliott Wave (12345).
In conclusion, at the moment we are closer to the bearish trend option, but you need to see at chart below, by DASH/USD there is a significant pre-reference to the begin of the bull trend.
Share your thoughts, ideas about the market under the chart.
Watch for our Updates to be the first who gets well-timed signals !
GOOD LUCK AND LOTS OF PROFITS !!
Disclaimer
This report is for information purposes only and should not be considered a solicitation to buy or sell any trading assets. Monfex accepts no responsibility for any consequences resulting from the use of this material. Any person acting on this trade idea does so entirely at their own risk.


Opportunity to buy in DASH.Do not consider any chart as an investment advice.
Do not consider time as correct. Waves can take time to build.
. Always create stop loss.
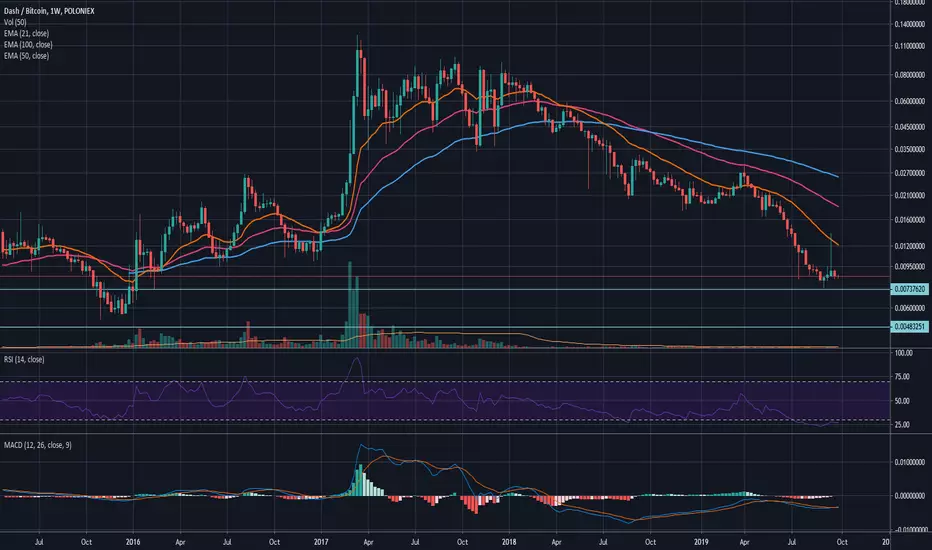
DASH turning green after steady increase in mainstream adoption.DASH BTC has been on a downtrend for a while and went further down after being delisted on several major exchanges due to being a privacy coin.
However, DASH has found large mainstream adoption in several countries such as Venezuela with a large number of merchants and even ATMs.
The hash rate of DASH has been climbing at an accelerated rate and is at all-time highs.
The hash rate is a good indicator of mainstream interest
bitinfocharts.com
The average transaction value is also going down steadily which shows that more of the general public is using this platform compared to before.
bitinfocharts.com
From the price action point of view, the weekly MACD has just turned bullish and RSI has entered oversold territory.
The price has found support on a historical resistance. It could go a bit further down by around 20% to the next support but is poised to go much higher in the coming weeks.
*Not financial advice. Probabilities not certainties. Please do your own research.
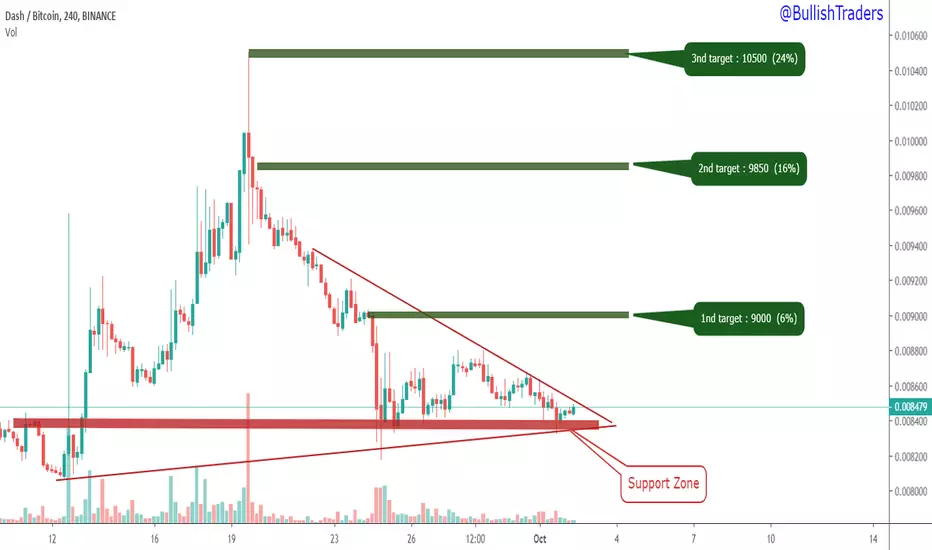
DASH in a good positionDASH / BTC
Exchange : #BINANCE
Buy : 8479
Target 1 : 9000 (6%)
Target 2 : 9850 (16%)
Target 3 : 10500 (24%)
Stop loss zone : 7950 ~ 7900
Telegram channel :
t.me
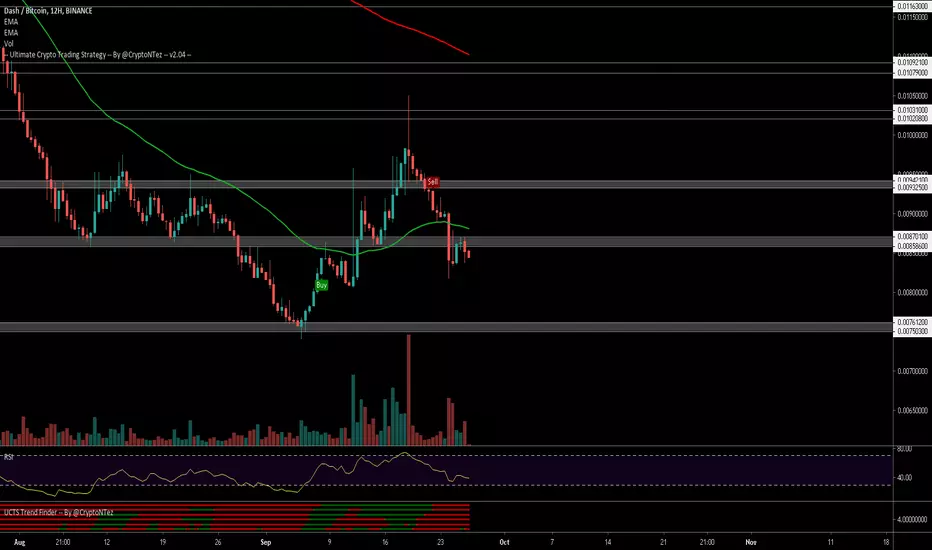
$DASH, Bearish retest of the ~.0086 sats resistance level$DASH
Bearish retest of the ~.0086 sats resistance level (could act as short opportunity)
From here next support seems to be at ~.0076 (10%)..
UCTS indicator Sell signals across the board
reclaiming .0087 should be a warning/exit..
#DASH
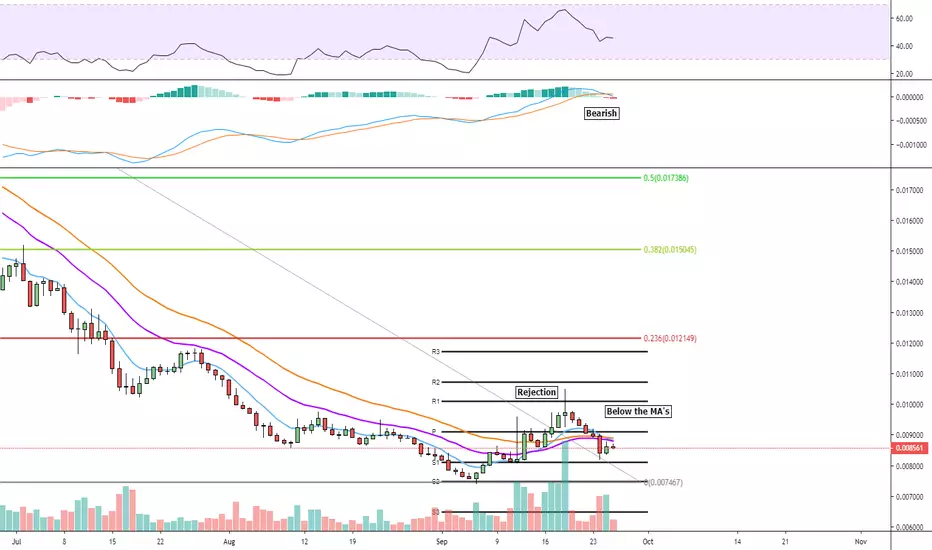
Dash - Looks like another Bear move comingWith DASH being under the MA's again it looks a lot more bearish, no real support bounce neither. We feel that this could go even lower.

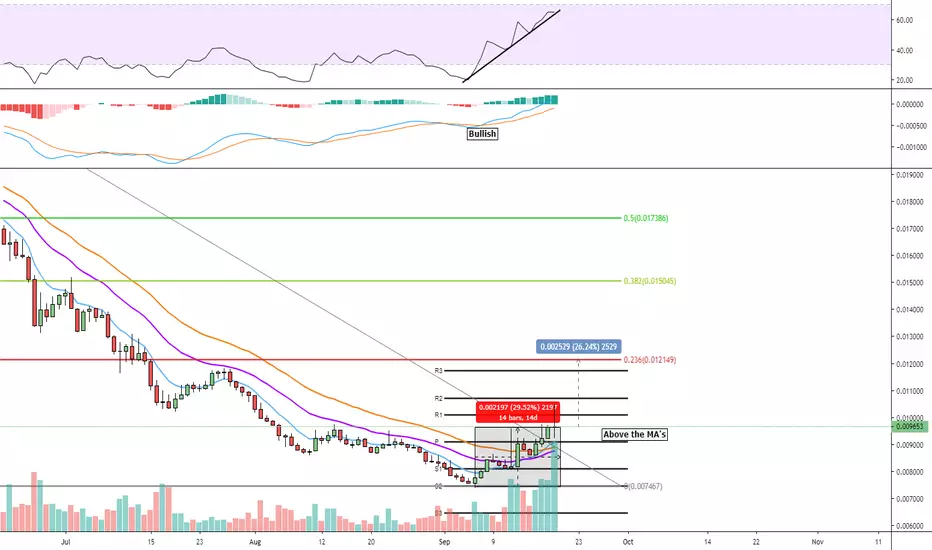
Dash - Could Go On A Run HereDash for the first time in a long time is above the MA's and showing a bullish trend. If BTC behaves it could carry on and retrace some of the moves.
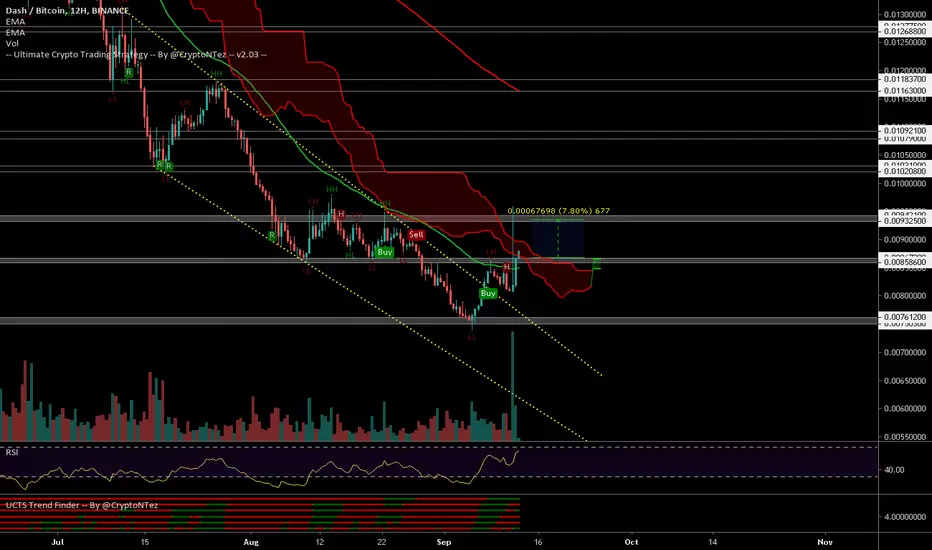
$DASH, Trying to push over ~858k sats resistance level$DASH
Trying to push over ~858k sats resistance level // Ichimoku cloud with increasing volume..
If manages to flip into support current level or volume keeps pushing up, then aiming for ~932k sats (8%) as 1st target.
UCTS Buy signal active on the 12H chart
#DASH
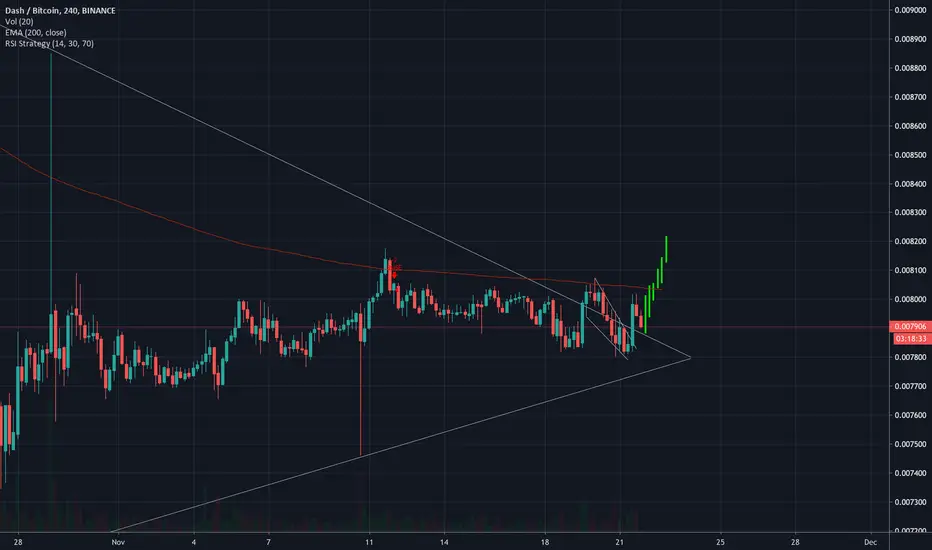
DASH - Looking Very Bullish - Wave 5DASH's 4-hour BTC chart is looking very bullish. The price has caught support on the the MA200 and is moving on up. The MACD is also curving at support and has a near bullish crossover. There are several support levels if DASH retraces a bit, but I think this is a good entry point. I've set some possible reversal areas where there might be strong resistance.
Did my idea help you make a successful trade?
Donations are always welcome and much appreciated!
BTC : 136dZZ2XyUirYUX1nUXwrU6sGgaBNPiFnU
ETH : 0x2fda8b3ebf9f03078d2e4657ebca5c41ed020bf6
XRP : rPVMhWBsfF9iMXYj3aAzJVkPDTFNSyWdKy Tag: 395032582
