DATA-USDT BIG BREAKOUTOur latest signals this month
----------------------------------------------
data-usdt
buy : 0.082
sell : 0.121
PROFIT : 47% DONE
Congratulations to those who entered the deal with us
DATAUSDT trade ideas

DTATA/USDT (Requested chart)Hi guys, This is CryptoMojo, One of the most active trading view authors and fastest-growing communities.
Do consider following me for the latest updates and Long /Short calls on almost every exchange.
I post short mid and long-term trade setups too.
Let’s get to the chart!
I have tried my best to bring the best possible outcome in this chart, Do not consider it as financial advice.
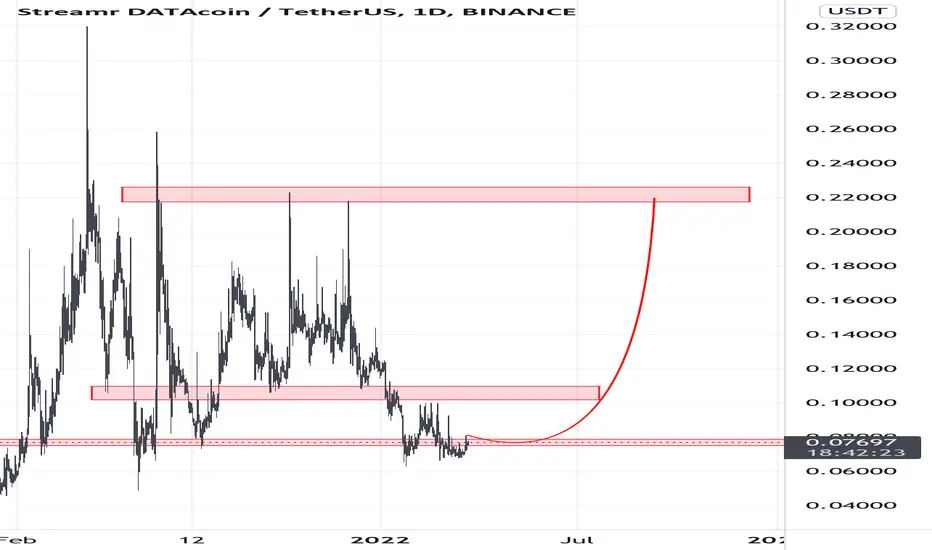
DATA/USDT TA Update:-
TimeFrame :-D
$DATA is currently trading at $0.067 levels.
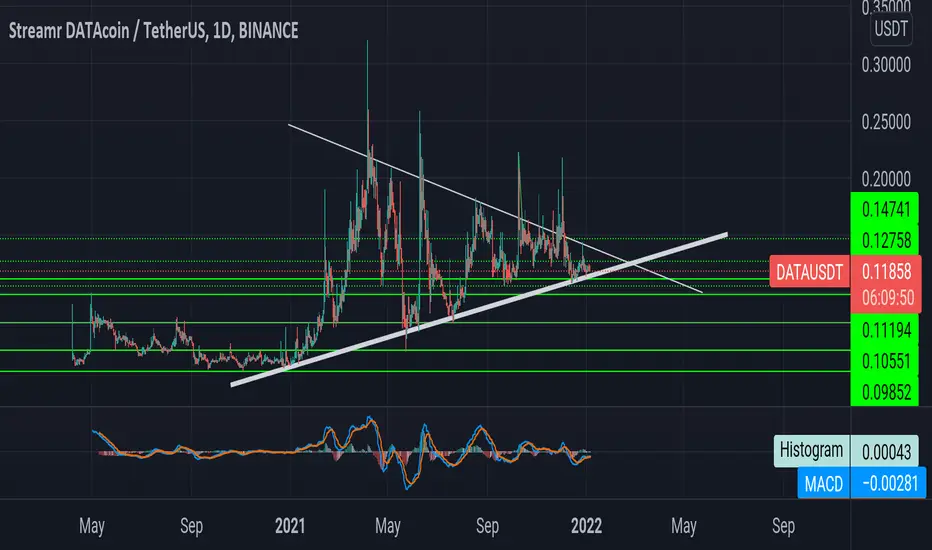
Price is consolidating in a DECANDONG Triangle Pattern.
Both sides trade opportunities available once it gives a breakout on either side of the Pattern.
LONG
ENTRY: CMP
Target:- 30% or much higher Targets can be achieved.
Stop loss:- $0.06
2 ) If Price gives a Trend line breakout downside.
ENTRY; BREAK AND RETEST THE DOWNER CHANNEL ($0.062
Targets:- 47%TO$0.064)
Stop loss :- $0.07
This chart is likely to help you in making better trade decisions if it did consider upvoting this chart.
Would also love to know your charts and views in the comment section.
Thank you

DATA/USDT#DATA/USDT::
it's Accumulating Around Demand Zone, Nicely Holding Support Area. Expecting A Short Term Rally From Here, Good To Buy Some Here.
lets make some money aaand i am watching its behavior since over 1 year. its really a crazy one when it go up! now our chance to make easy M0NEy :D I love /\|\0Ny but love u more much :D!
BUY ORDER < 0.75
SELL ORDER >= 0.78
Targets:
T1: 0.078
T2: 0.082
T3: 0.085
T4: 0.092
T5: the MO0oN
HAVE FUN!
If u agree & like my trading still give me some like and follow me boss! love all of u !!!
HAPPPY TRADING!!!

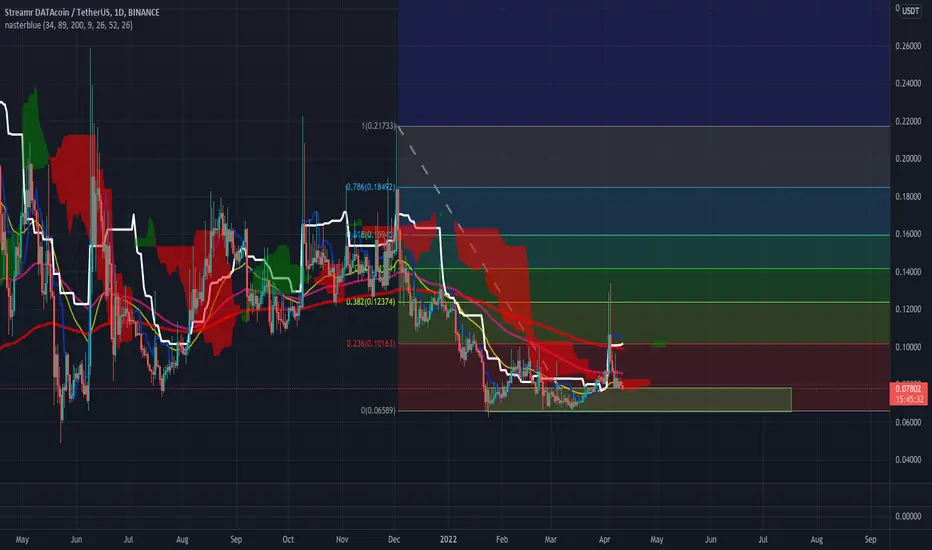
Buy Streamr (DATA)Current Market Cap $60 M
Setup
Entry : $0.08 - $0.07
TP1 : $0.1
TP2 : $0.123
TP3 : $0.14
TP4 : $0.159
TP5 : $0.18
SL : $0.06
Disclaimer :
Happy trading. This is NOT a financial advice
Do your own research
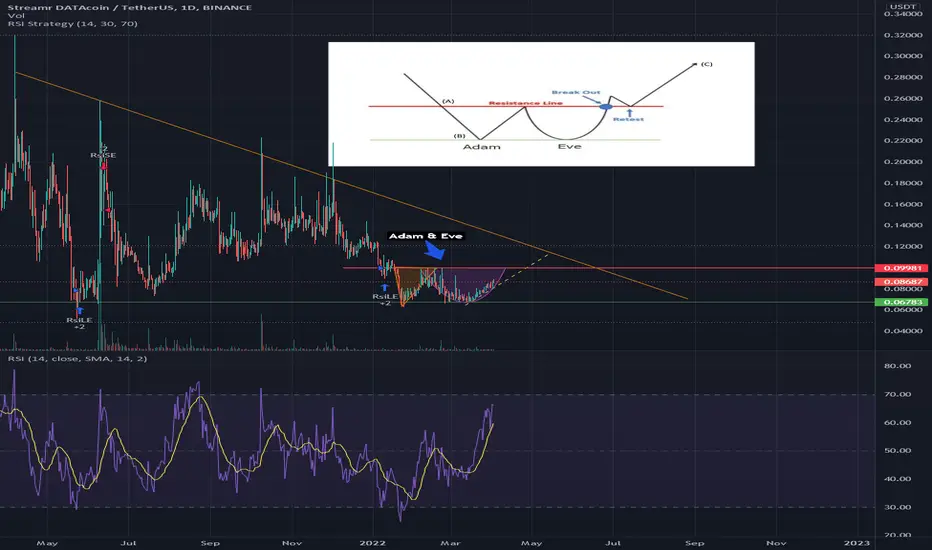
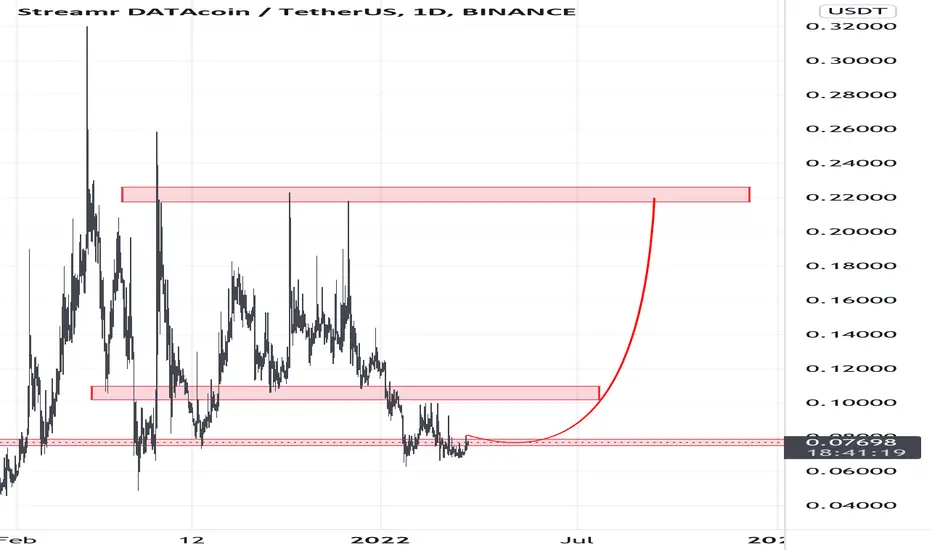
DATA Adam & Eve pattern forming, soon break-out?Seems like Adam & Eve pattern is forming in the 1D chart. DATA has good fundamentals and recently launched staking with nodes. Break-out could be near and would be justified!
Not financial advice :)
Datausdt - has been detected earlier by the scanners The volume impact scanner notify me when the currency are changed in Volume positively and often means a change in the direction of the currency.
Then the hot ticker gives me currency, when it Trend and are traded on strongly.

DATA-USDT BIG BREAKOUTdata-usdt
buy : 0.082
sell : 0.121
PROFIT : 47% DONE
Congratulations to those who entered the deal with us

Buy DATAMarket Cap $699 M
Setup
Entry : $0.08
TP1 : $0.1
TP2 : $0.12
SL. : 10%
Disclaimer :
Happy trading. This is NOT a financial advice
Do your own research
DATA for 1CentIf it can stay above $ 0.075 in 4 hours,
Price will try to reach $ 0.09,
The mtr pattern is complete
DATA STREAMR price movement predictionPrice Prediction
not financial advice
this is for entertainment purposes only
always DYOR
smash the like button

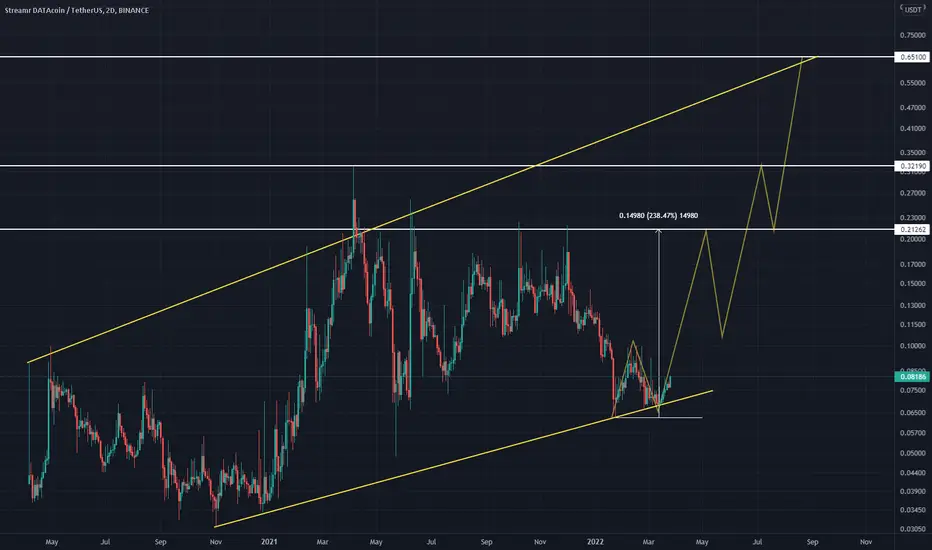
Data look amazing here bullish on Data Very bullish on Data chart, also Data project fundamentals are very strong now.
T1: 0.022
Might correct from it then to T2: 0.32 Then small correction to Target 3: 0.82
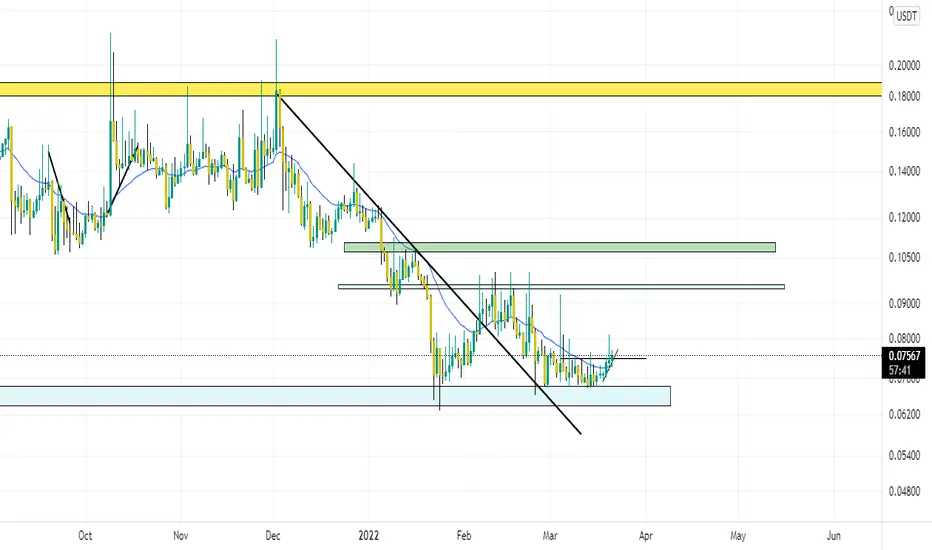
DATA only for risk takers - red area buy, green to sellPrice looks like there is a bottom...now it should slowly curving up as April is coming - i think we will see some green color in April. Data has nice PA. Usualy this pattern with price under 20 MAs are buys. Lets see and good luck.
NOT A FINANCIAL ADVICE
POSTING THIS JUST FOR EDUCATIONAL PURPOSES
DATA/USDT#DATA usdt BİNANCE
whait pulback to buy zone
BUY AROUND 0.0706$ - 0.0.7250$
SEL-0.0799$ - 0.01312$
#data is Respecting it's TrendLine Support Everytime it Reaches There...
& This is Creating a Bullish Scenario For a Heavy Pump ‼️
Buy hold 1-7 days

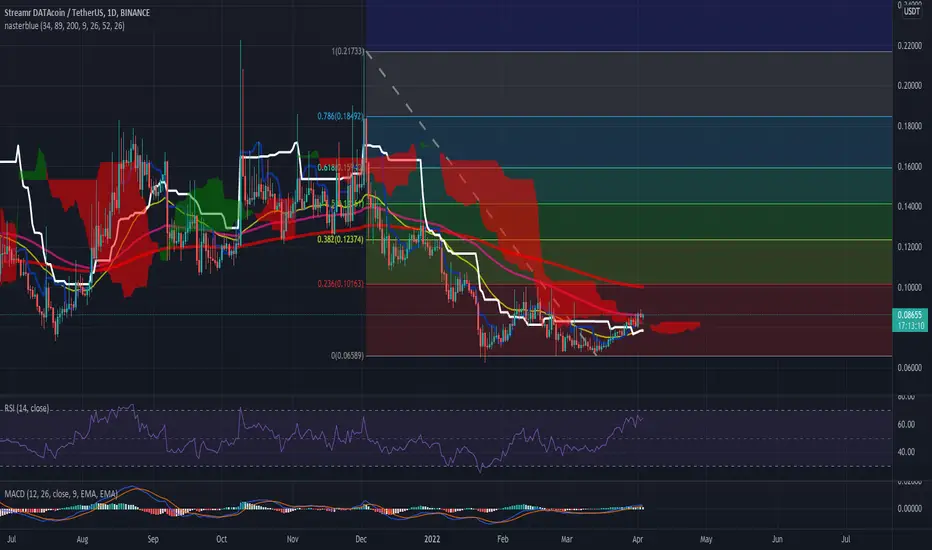
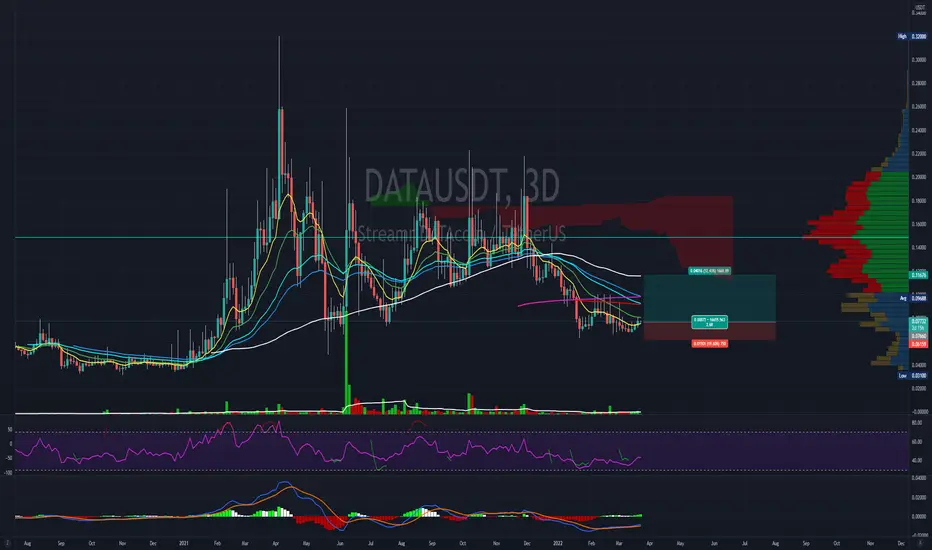
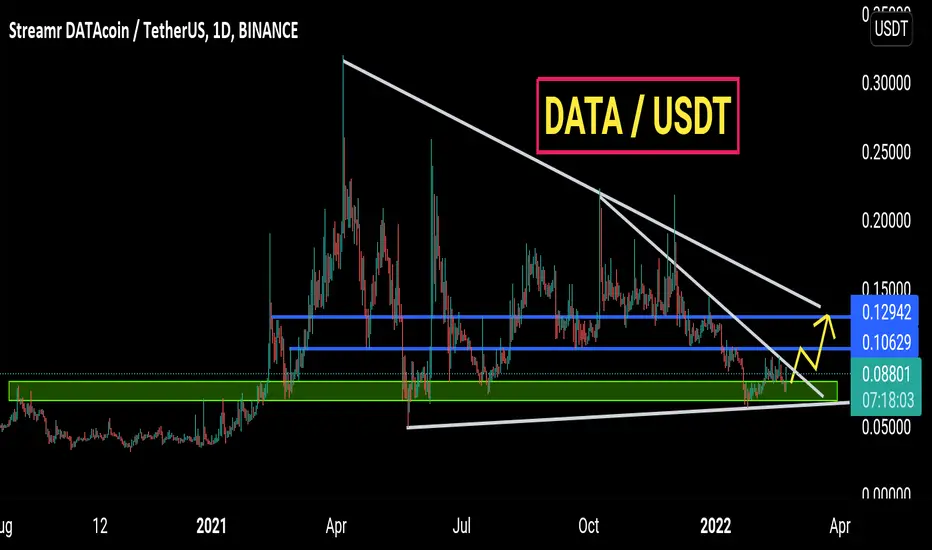
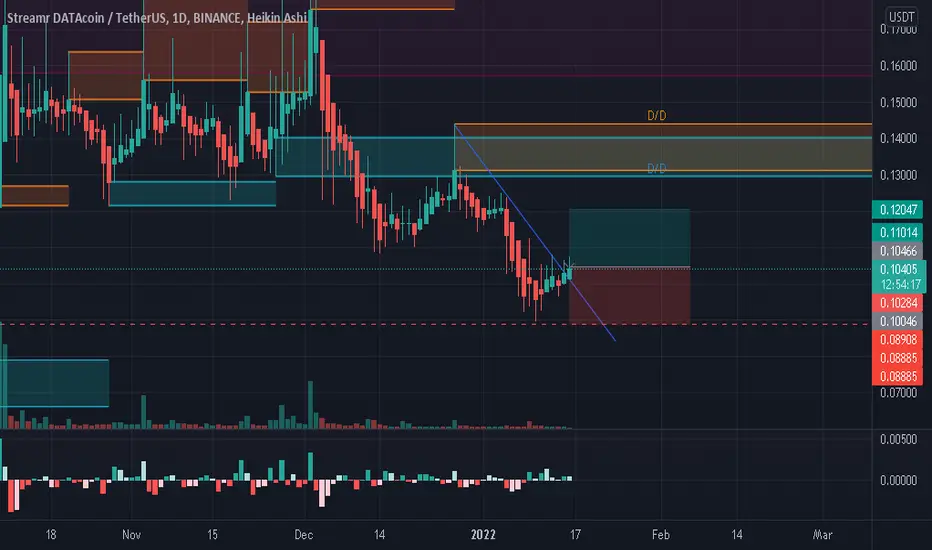
🉑DATA- 2022 New perspective feat. double bottom divergencesThe price reached strong support, left is previous trend forming a potential double bottom there (confirmation after breaking above >0.10$) Multiple bullish divergences can be spotted on various indicators => (RSI,MFI,OBV) The divergence on OBV is insane.
- The chart with longer price history from Bitfinex BITFINEX:DATUSD (different ticker) looks ok (the price is at last point of dynamic support)
- BINANCE:DATABTC pair is at support in a rising channel
The whole 2021-2022 price action could be treated as one big accumulation <= this remains valid as long as the price hold above 0.07$ (red area) Also the good thing is that even if I'm wrong, stop loss can be placed very close(less than 10%) which means that risk:reward ratio here is extremally attractive.
Will post updates whenever I feel like it's needed.

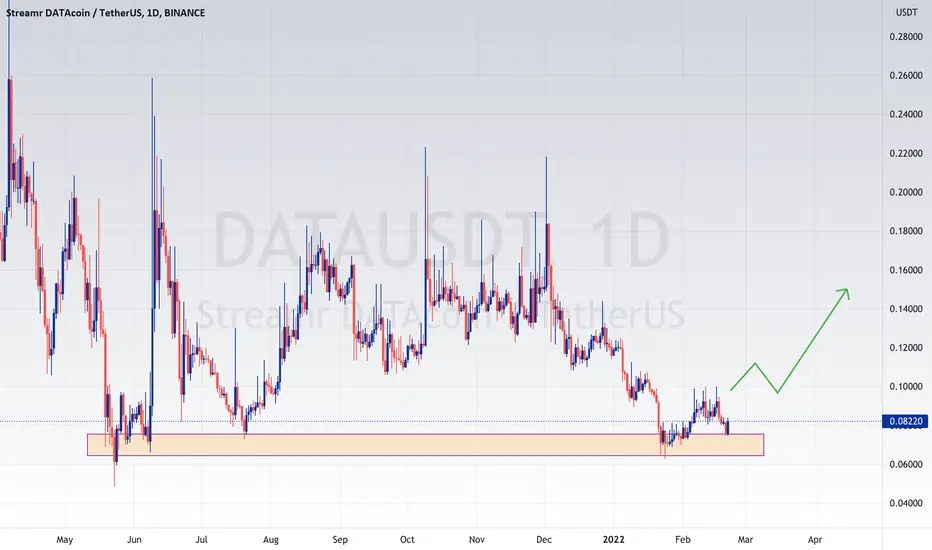
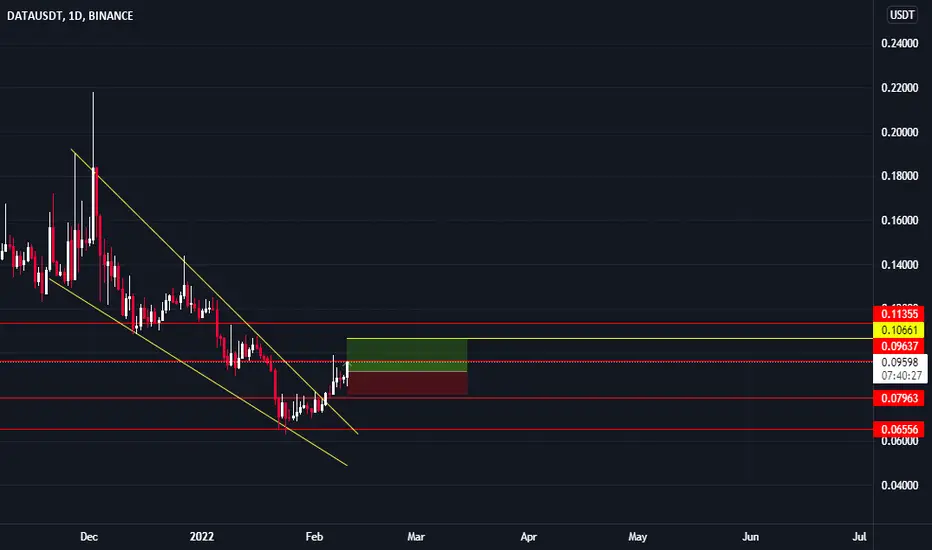
DATAUSDT SETUPPrice was consolidating at a critical support zone, now price is trying to recover, if the momentum establish we can see a good rally upto 1.30 level.
DATADATA/USDT lying above strong support. Stochastic is giving a buying signal. It will bounce hard from here. Start building your positions in DATA as we can see big pump anytime soon
Targets: $0.1-0.12-0.14-0.16
SL: $0.068
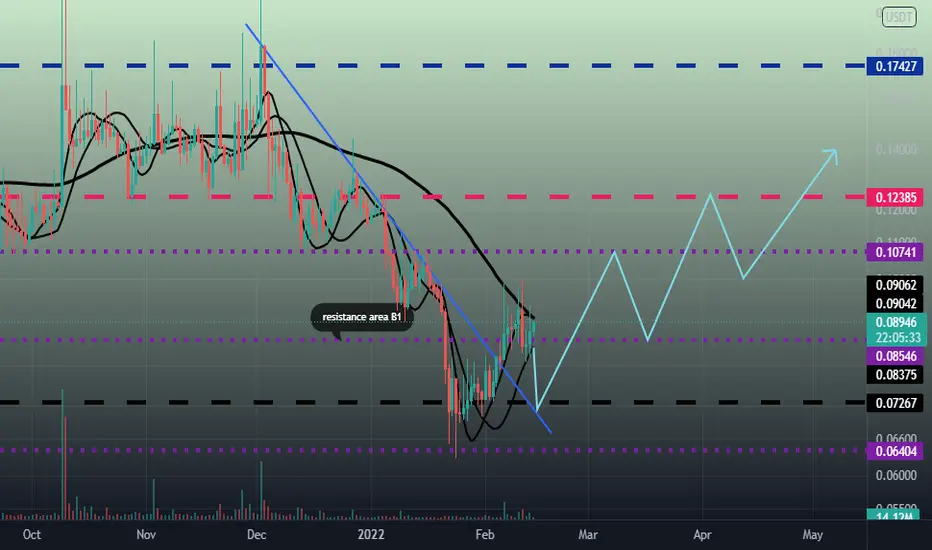
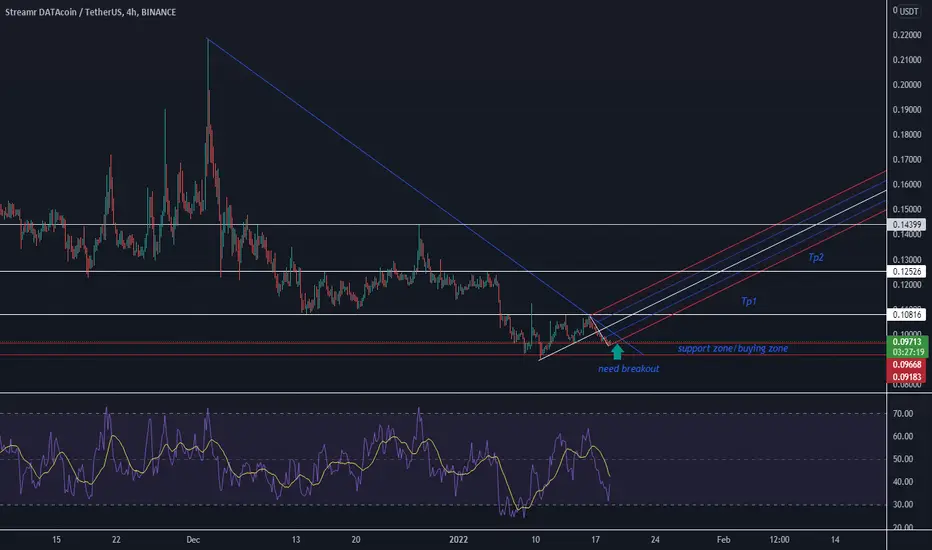
DATAUSDT price action trend volumewelcome all,I came today to share with you my thoughts on DATAUSDT,As you can see, the trend line was broken by a strong candle, which means that the direction of the price movement will reverse.
I'm just waiting for the trend line to be retested Because I think the price will start to rise soon after retesting the trend line.
After breaking the resistance area B1 ,you can consolidate your trade.
Do not miss dataDATA/USDT broke out falling wedge. ready to fly.😊
waiting for high pullish momentum but im satisfied with the target in the chart
data_usdt uptrend startdata's daily chart is at the position of the end of the triangle pattern .
upto two weeks it can begin uptrend.
targets : 0.30$ , 0.50$ , 0.80$