DeFi Index Completes Irregular Flat Correction; Bulls Back?DeFi Index may have a completed irregular flat correction within an uptrend, which may cause another rally this year, according to Elliott wave theory.
Cryptocurrencies are recovering and DeFi Index is now bouncing back above EW channel, so a five-wave impulse into wave (C) of an irregular (A)(B)(C) flat correction in blue wave B can be finished. It means that a higher degree blue wave C can now be in play, which can rally this year all the way back to March 2024 highs. Is this the beginning of an ALTseason?
A basic bullish irregular flat correction is a three-wave (A-B-C) pattern where wave B exceeds the start of wave A and wave C dips below wave A before the overall bullish trend resumes.
DEFIUSDT.P trade ideas

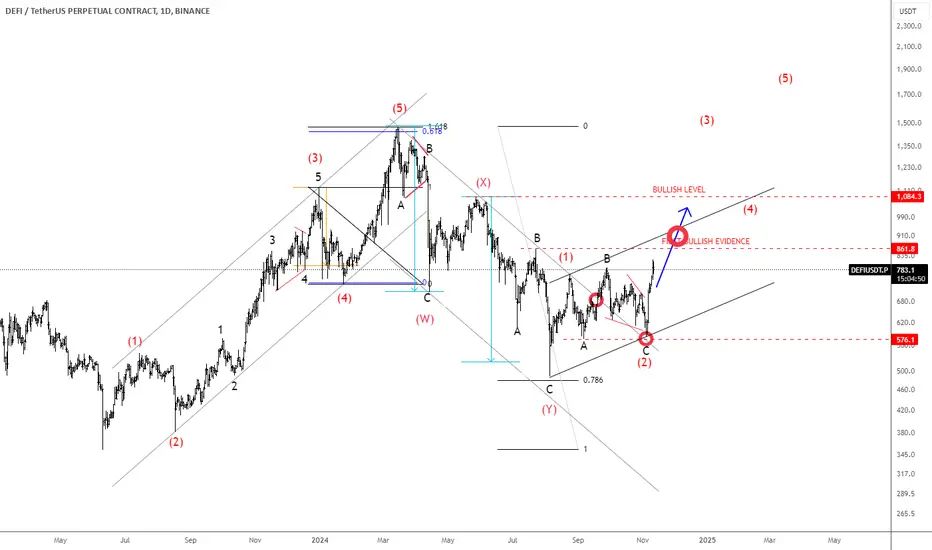
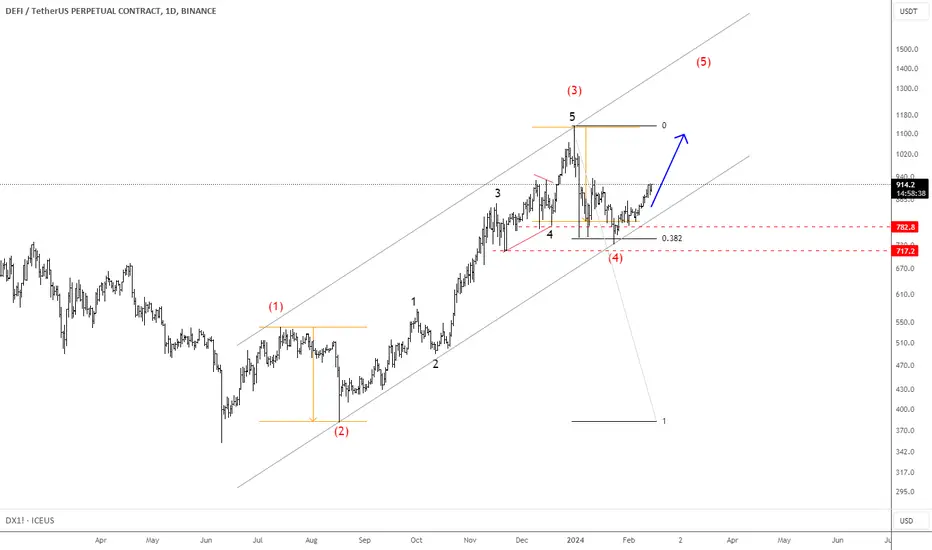
ALTcoins Are Trying To Follow Bitcoin; DeFi Bulls Are HereWe talked about DeFi Index back on August 21, when we actually spotted a completed complex W-X-Y corrective setback that gave us a bullish setup formation of a larger degree.
Since August it's been mostly accumulating and with a broken channel resistance line connected from the highs, it's probably forming a bullish setup formation with a sharp wave (1), which was followed by an A-B-C flat correction in wave (2) that nicely retested upper channel line as a support.
So, with current sharp and impulsive rally, watch out for a strong bullish continuation within wave (3) of a five-wave bullish cycle that can send the price back to March highs, especially if breaks base channel resistance line and 1000 bullish confirmation level.
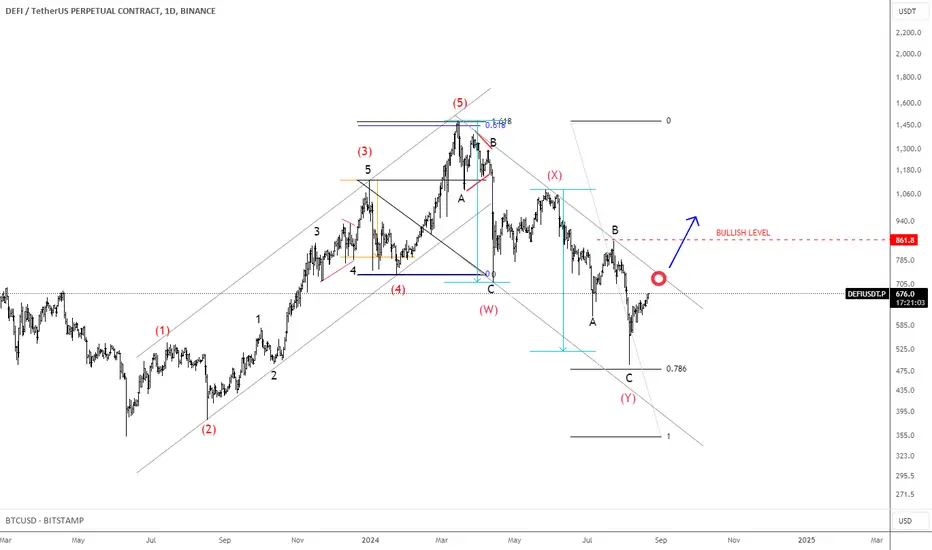
DeFi Bulls Can Be Ready; Elliott Wave AnalysisDeFi Index made nice and clean five-wave rally from June of 2023 into March of 2024, which confirms bottom in place, especially if we respect a complex W-X-Y corrective decline since March 2024 highs till August 2024.
It's actually already bouncing quite strongly away from key 78,6% Fibo. retracement after potentially completed projected complex W-X-Y corrective setback, but to confirm bulls back in the game, we need to see it back above channel resistance line and 861 region.
After recent stock market sell-off due to recession fears, Crypto market slowed down again, but now that risk-on sentiment is back with bullish stocks and bearish USdollar, seems like even Crypto market may stay in the bullish trend, especially if we consider an inflation cool-down and upcoming interest rate cut in US.
$DEFILooks like alreadybat the support and looking for a bounce from here
Long position with stop loss at $686

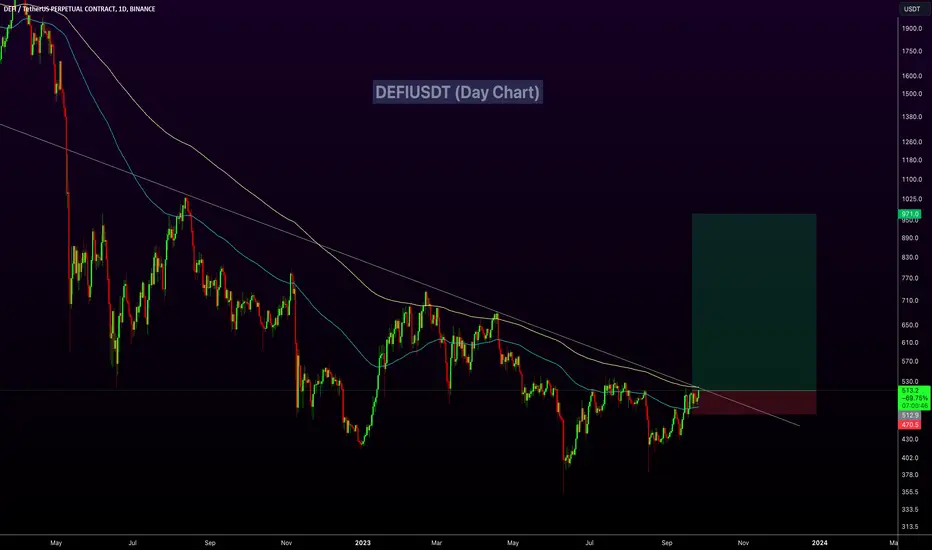
DeFi Index Can Be Rising Within 5th Wave Of An ImpulseThe DeFi Index is a capitalization-weighted index that tracks the performance of some of the largest protocols in the decentralized finance (DeFi) space.
DeFi Index is trading an in impulsive recovery away from the lows, which is from Elliott wave perspective ideally unfolding a five-wave bullish cycle. After recent corrective slow down, which we see it as a wave (4) correction, seems like it's now on the way higher within 5th wave that can push DeFi coins higher in upcoming days/weeks.
Defi is acumulating for PumpDEFI seems to rise in the long run if BTC allows it. In general, defi projects look very strong. It looks very ideal for the spot. BOs can be considered as TPsş
Breakout of $500 will lead to mini #DEFI season 🔥Good time to accumulate #DEFI coins 💎📝
Keep an eye on it 👀
Trendline Trading Strategy
What is a trendline trading strategy?
In technical analysis of financial markets, a trendline is a diagonal line drawn through a chart to show the trend in price. The slope of the trendline shows the direction of the trend: if the line has an upward slope, the trend is up (an uptrend), and if the line has a downward slope, there is a downtrend. When the slope is flat, the trend is horizontal, and in that case, we say that the market is moving sideways or is range-bound.
As you know, the price moves in swings, creating swing highs and swing lows. When the price is rising, it creates a series of higher swing lows and higher swing highs. Likewise, when the price is declining, it creates a series of lower swing highs and lower swing lows. An up-trendline is drawn across the rising swing lows, while a down-trendline is drawn across the descending swing highs. In a range-bound market, the line is drawn across both the swing highs and swing lows to delineate the boundaries of the range.

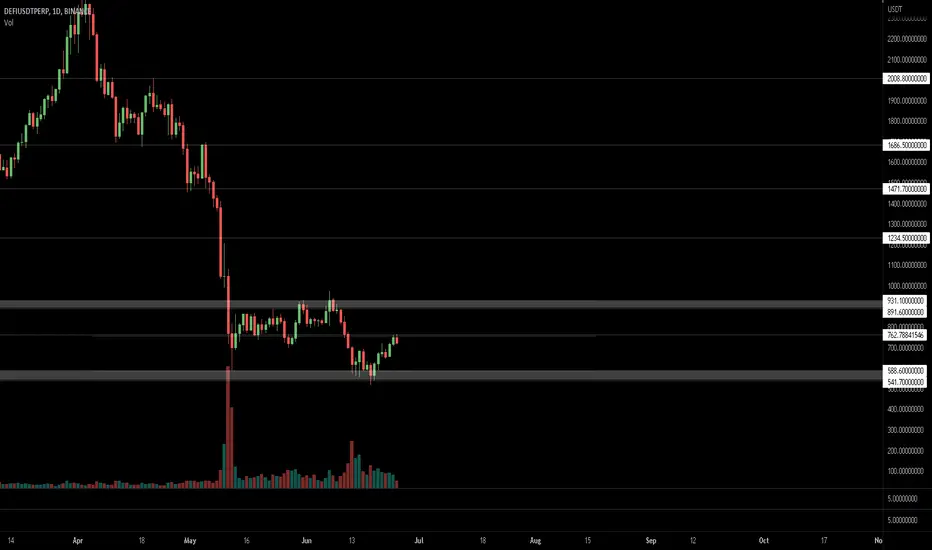
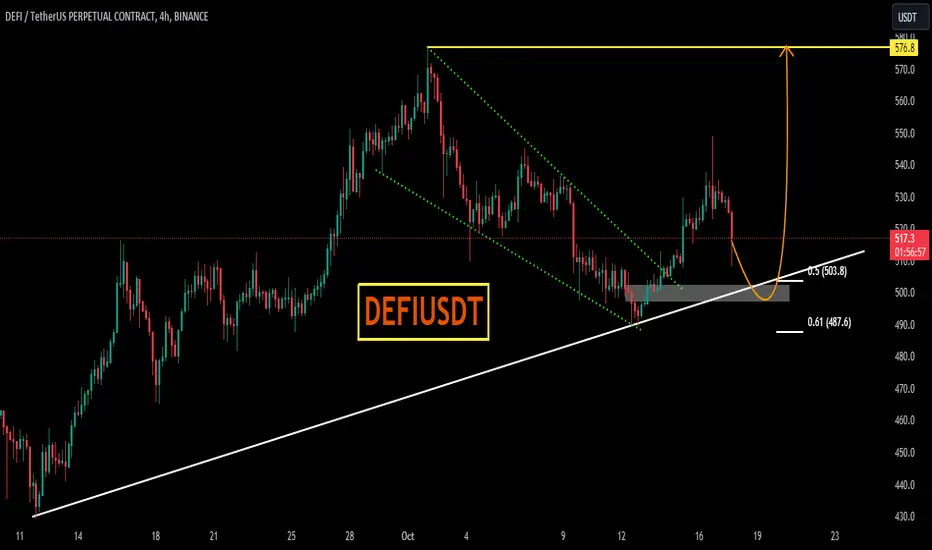
DEFIUSDTDEFIUSDT is in strong bullish trend.
As the market is consistently printing new HHs and HLs.
currently the market is retracing a bit after last HH, which is also the 50% fib retracement level and local support as well. if the market successfully sustain this bullish confluence the next leg high could be 570.
What you guys think of this idea ?
DEFIUSDT Price Is About To Break It's Trend Line!DEFIUSDT Technical Analysis Update
Buy zone: Below $515
Stop loss: $470
Take Profit 1: $555
Take Profit 2: $670
Take Profit 3: $795
Take Profit 4: $990
Always Keep Stop Loss
Thanks
Hexa🧘♀️
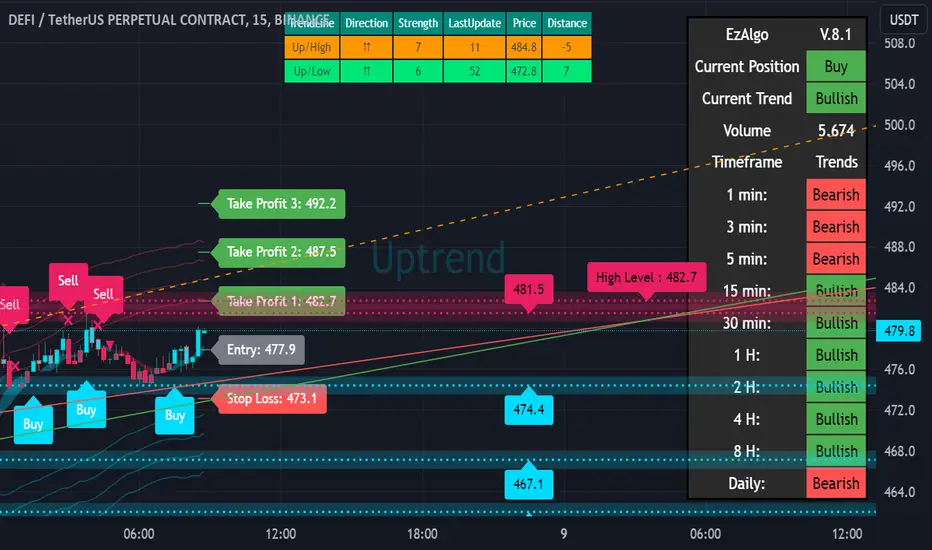
DEFI is very nice coin lets long itEntry 477.9
tp1 482.7
tp2 487.5
tp3 492.2
sl 473.1
I really liked this coin. Earned too much from this lets go


Altcoins! June 23rd, Channels, and Current InterestsTraders,
As promised, I am doing a quick overview of current price action in our altcoin space. I will cover an important date, June 23, and why it matters. I will also review the channels that are forming on most alts which appear as though they could be mid-term bear flags. And finally, you will see me review some of my current trades and what I am looking at for targets, stop limits, etc. Enjoy.
Stew
Timestamps
00:00 Intro
09:17 Altcoins
11:27 DogeCoin
16:00 Defi Coins
19:34 Outro


DEFI perp indexa good prediction for what can come to DEFIs in general. I believe there will be a big run on Defis this year

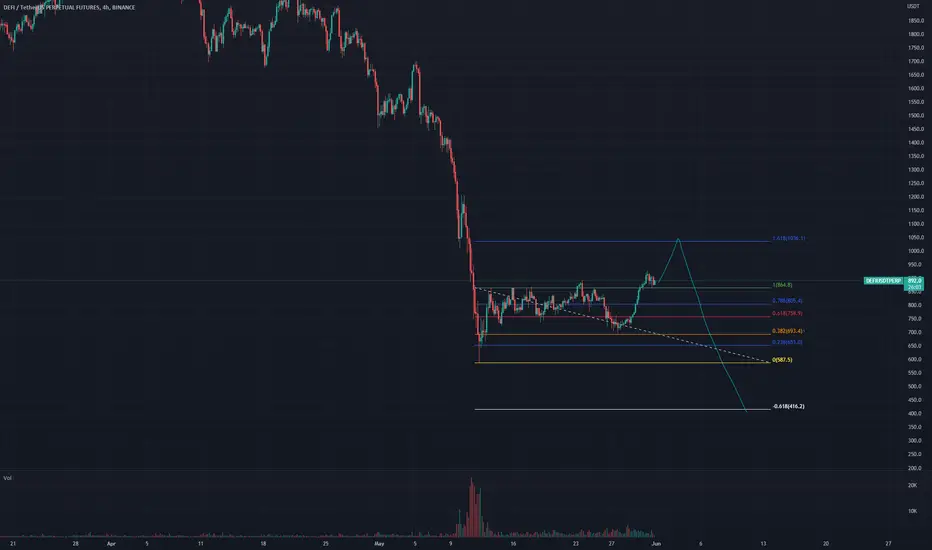
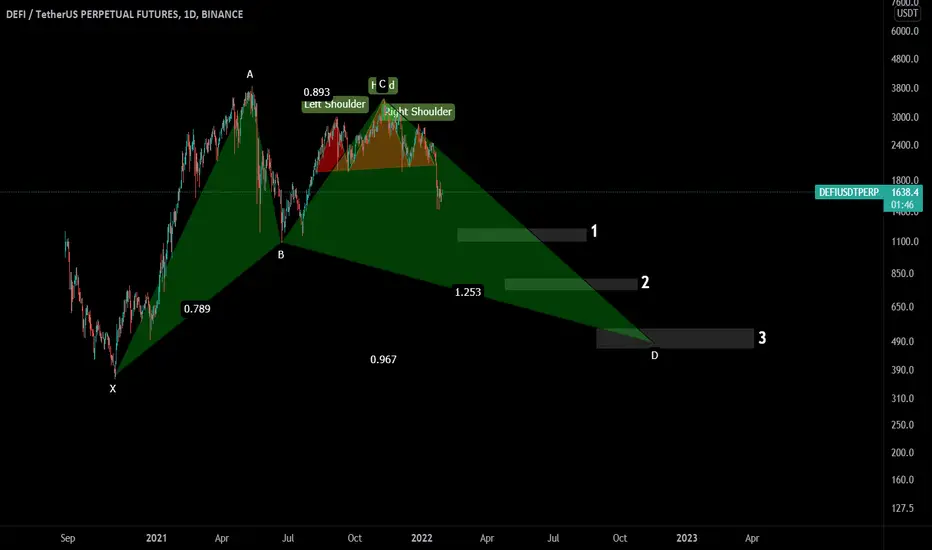
head and shoulders and harmonic (bat) There are two patterns of head and shoulders and harmonic (bat) in the chart that can be a downward market trend for the long term.
Thank You
#DEFI, On the edge of a bigger move #DEFI
On the edge of a bigger move
Attempting to break above the range that was established over the previous three months
UCTS is already bullish on lower timeframes and is signaling a 2D buy
⏳

DEFI could have a setback - Cryptoz18❶ Warning
Operations in the Blockchain or FX market represent a high risk. Cryptoz18 is a content creator who posts his ideas for viewers however he never provides an investment recommendation. I recommend to the reader a good risk management and knowledge regarding the environment. Thank you very much.
❷ Tutorials
➤ Here you can find a brief explanation of how the operations work in case you are interested in following them.
➤ Here you can find an explanation of how to track our ideas:
✔️ Our operations are taken with StopLoss and Take Profit of 15 minutes. However, we are looking to try and catch a 4H trend. So, once we touch the TPM according to your own analysis you should consider whether to close the trade or move StopLoss to entry.
❸ Operational Information
• Entry price: 826.4
• StopLoss: 867.8 (Loss 4.32%)
• TakeProfit Minimum: 804.5 (Win 2.65%)
• Recommended margin: 5% of the Futures account
• Recommended leverage: 1x.
• Temporality: 15Min - 4H

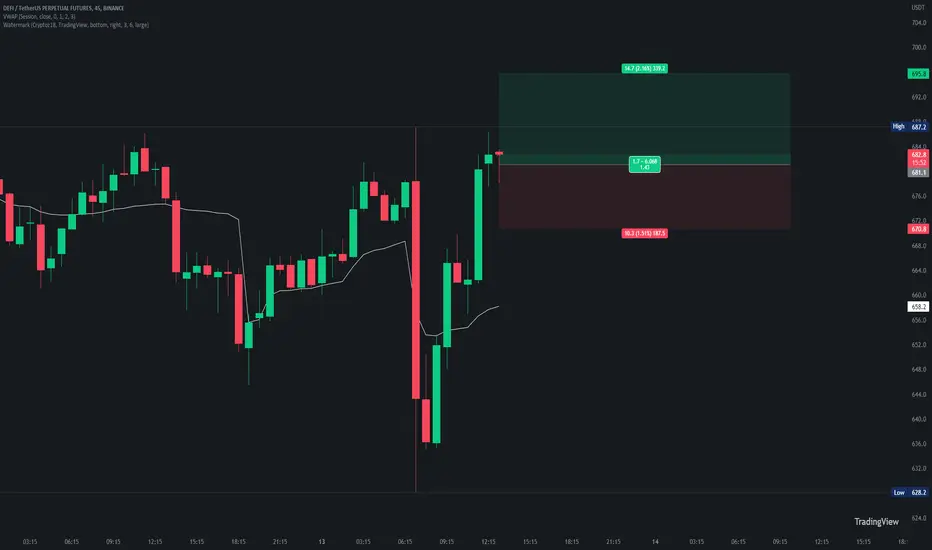
DEFI could have a little bullish momentum on H4 - Cryptoz18❶ Warning
Operations in the Blockchain or FX market represent a high risk. Cryptoz18 is a content creator who posts his ideas for viewers however he never provides an investment recommendation. I recommend to the reader a good risk management and knowledge regarding the environment. Thank you very much.
❷ Tutorials
➤ Here you can find a brief explanation of how the operations work in case you are interested in following them.
➤ Here you can find an explanation of how to track our ideas:
✔️ Our operations are taken with StopLoss and Take Profit of 15 minutes. However, we are looking to try and catch a 4H trend. So, once we touch the TPM according to your own analysis you should consider whether to close the trade or move StopLoss to entry.
❸ Summary
DEFI could have a little bullish momentum on H4.
❹ Operational Information
• Entry price: 681.1
• StopLoss: 670.8 (Loss 1.51%)
• TakeProfit Minimum: 695.8 (Win 2.16%)
• Recommended margin: 5% of the Futures account
• Recommended leverage: 1x.
• Temporality: 15Min - 4H
DEFI could have a little pullback - Cryptoz18█ Operation data
• Entry price: 724.1
• StopLoss: 739.3 (Loss 2.10%)
• TakeProfit Minimum: 708.9 (Win 2.10%)
• Recommended margin: 5% of the Futures account
• Recommended leverage: 1x.
• Temporality: 15Min - 4H
✔️ Data: The user is recommended to move the StopLoss to entry once we reach the TPM or also known as the Minimum TakeProfit.
In this way, if the trend is good for a longer timeframe, it will never touch the StopLoss placed on our entry. We will only have to pay the commissions in case we get the SL at the entrance.
Being a 15-minute trade looking to take a 4H trend it is likely to have a fairly low Winrate due to the tight StopLoss however this offers us better risk management. We try to take a 4H trend using SL and TPM of 15 minutes.
This way, we seek to obtain a profit of 100% between all operations. Only 5% of the account per operation could achieve our objective and thus obtain a return of 5-7% per month of the total account. This will be reflected at the top of our profile.
]█ Explanation of how the operations work:
Here you can find a brief explanation of how the operations work in case you are interested in following them.
█ Warning
✔️ Blockchain or FX operations represent a high risk. Therefore, this operation should not be taken as an investment recommendation. All I do is share my trade ideas publicly for the viewer to do their own analysis and decide to enter based on her own decision making. The viewer is recommended to have good risk management in their operations. To do this, take into account the fundamental data of Asset Volume, Market Capitalization, Supply, Percentage Change Price, Current Volatility, Perpetual Data, and lastly, proper Margin and Leverage management. Be careful, you can lose all your money in the future if they have poor risk management. Nothing more to say thank you very much.

#DEFI Alts are probably running much higherDon't let a half-worth day's of activities impair your ability to see what is going on.
Alts are probably running much higher