DEFIUSDT.P trade ideas


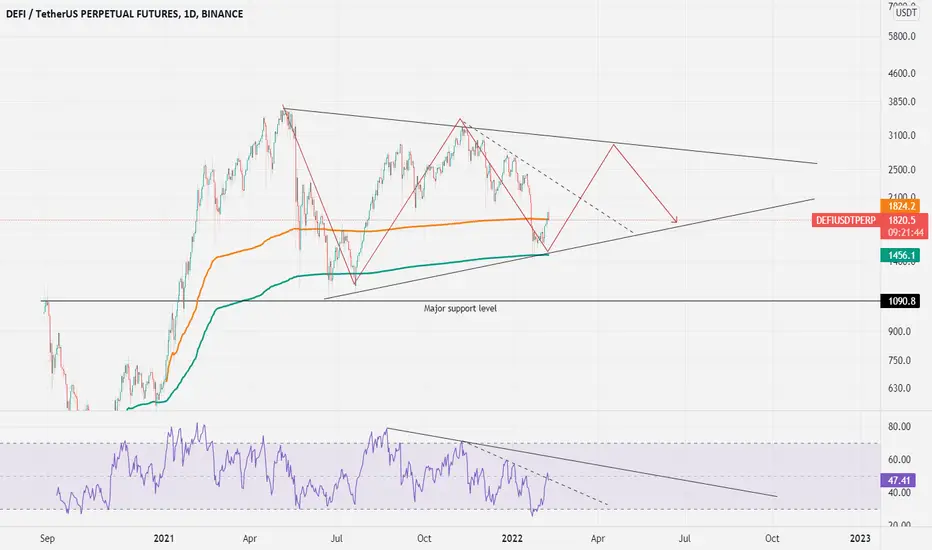
Long term health of DEFI in a critical moment - Triangle versionOn my latest post, I mentioned that 1900 usdt was an important area to watch and which we were rejected.
On this set up, we can see that DEFI/USDT is forming a triangle on the LOG chart.
The RSI shows that we will enter in a long period of consolidation(look at the descending trend lines), however we will have some excellent gains if we play it well.
When we see this chart, we can be bullish on the defi coins until we touch the upper line of the triangle which we will exit positions & wait and see.
Follow for more updates.
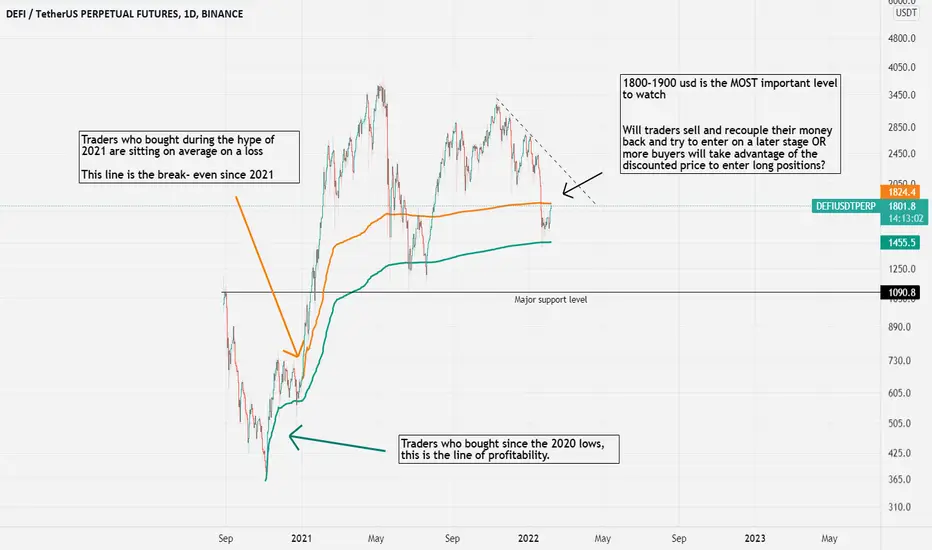
Long term health of DEFI in a critical moment - VWAP versionAnchored VWAP measures the average profitability of the selected period.
In a nutshell, if price is above the VWAP line, majority of traders are in profit. This shows that there is a bullish momentum and can attract more and more people (money attracts money). However, when many traders are in profit, the selling pressure can be higher which can result in a price decline.
Same way goes for when price is below VWAP line, majority of traders are in a loss, which show the bearish momentum as people are trying to exit on each pull-back and get their money back. However, when sellers are exhauster we can see a bottom and change of trend.
Right now, traders are almost at break-even.
The million dollar question is : Are traders going to take advantage of the low price to buy at discounted prices and break this resistance at 1,900 usd OR sell, get their money back and buy again later on?
There is a big support level at 1,110 usd in case bears take control.
Follow for more Updates.
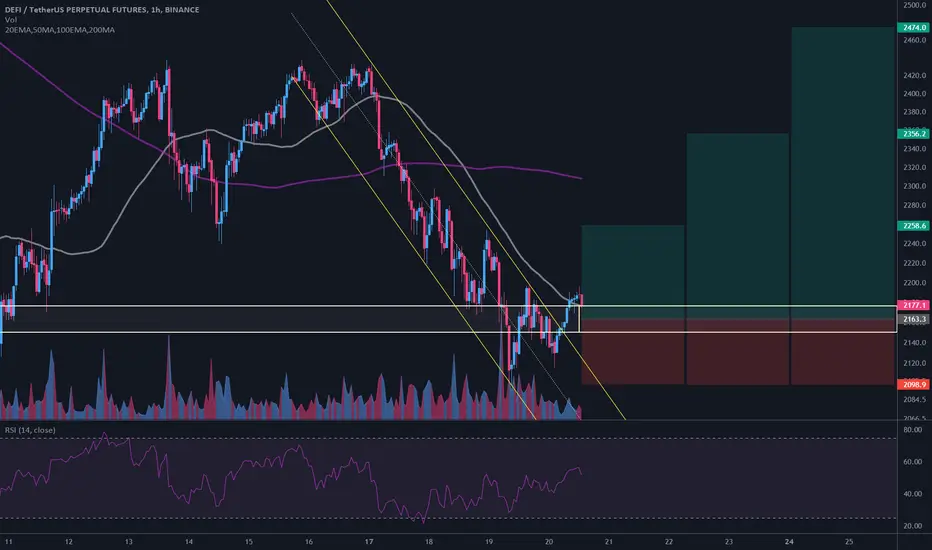
$DEFI/USDT 1h (#BinanceFutures) Falling channel breakoutDeFi Composite Index looks ready for short-term recovery after regaining 50MA support.
www.binance.com
Current Price= 2177.1
Buy Entry= 2176.3 - 2150.3
Take Profit= 2258.6 | 2356.2 | 2474.0
Stop Loss= 2098.9
Risk/Reward= 1:1.5 | 1:3 | 1:4.82
Expected Profit= +26.46% | +53.52% | +86.16%
Possible Loss= -17.64%
Fib. Retracement= 0.5 | 0.786 | 1.117
Margin Leverage= 6x
Estimated Gain-time= 5 days
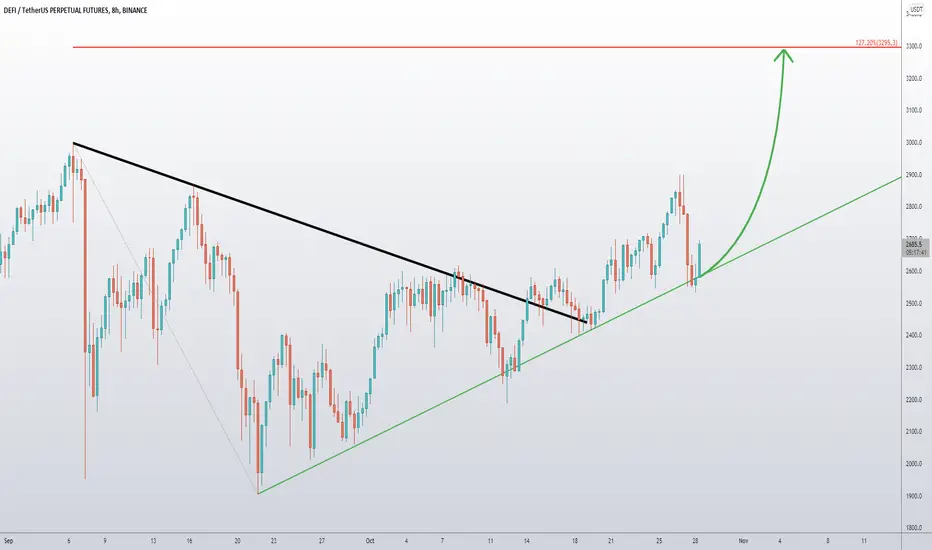
DEFI PERPETUALS Cup and HandleDefi Perp looking bullish currently, depending on whether or not this pattern plays out we could see some nice upside for defi projects.
Keep an eye on this chart.

DEFI buy from support lineThe market is weak, it is too late to enter an increase, it is better to wait for a pullback to support and look for purchases there

DeFi explosion incoming !!After 2 failed attempts and a fake out, DeFi Perp has broken through its macro downward sloping trendline, backtested for confirmation and currently finding support from its 12 day MA. 2 horizontal lines of resistance before DeFi Perp challenges the ATH.
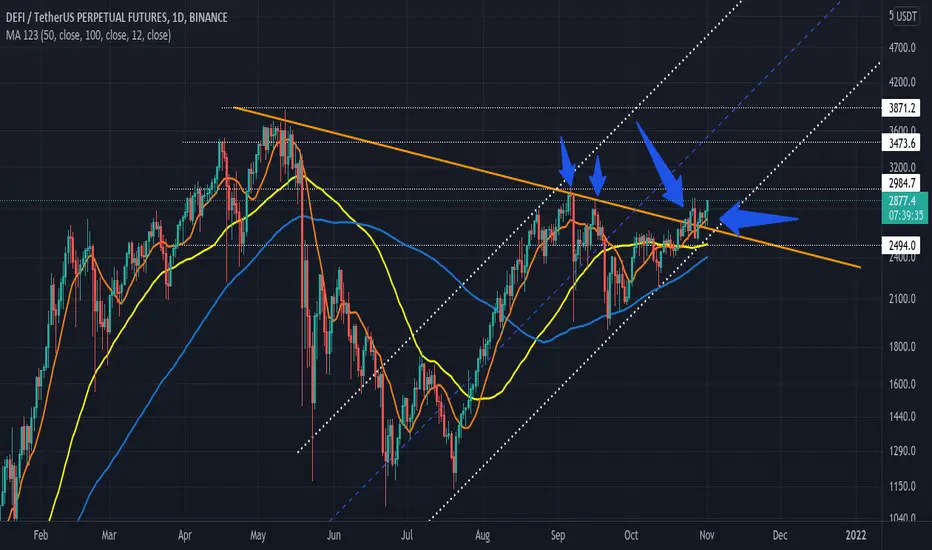
DEFI Index on the riseThe uptrend is about to continue after DEFI broke above the downtrend trendline and bounced off the uptrend trendline. Enjoy the rally!
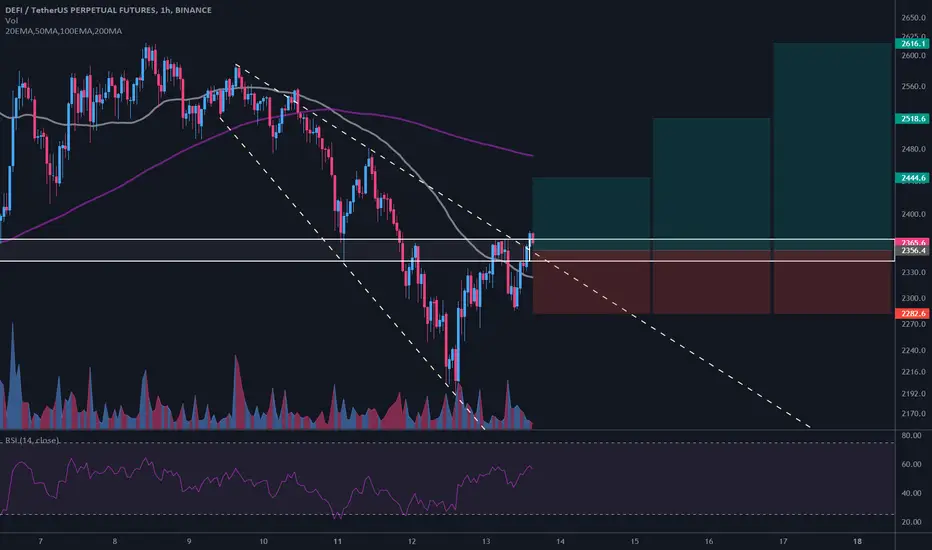
$DEFI/USDT 1h (Binance Futures)Falling broadening wedge breakoutDeFi Composite Index looks good for bullish continuation after regaining 50MA support.
More information about Decentralized Finance tokens on www.binance.com
Current Price= 2365.6
Buy Entry = 2369.3 - 2343.5
Take Profit= 2444.6 | 2518.6 | 2616.1
Stop Loss= 2282.6
Risk/Reward= 1:1.2 | 1:2.2| 1:3.52
Expected Profit= +22.44% | +41.28% | +66.12%
Possible Loss= -18.76%
Fib. Retracement= 0.618 | 0.786 | 1
Margin Leverage= 6x
Estimated Gain-time= 1 week
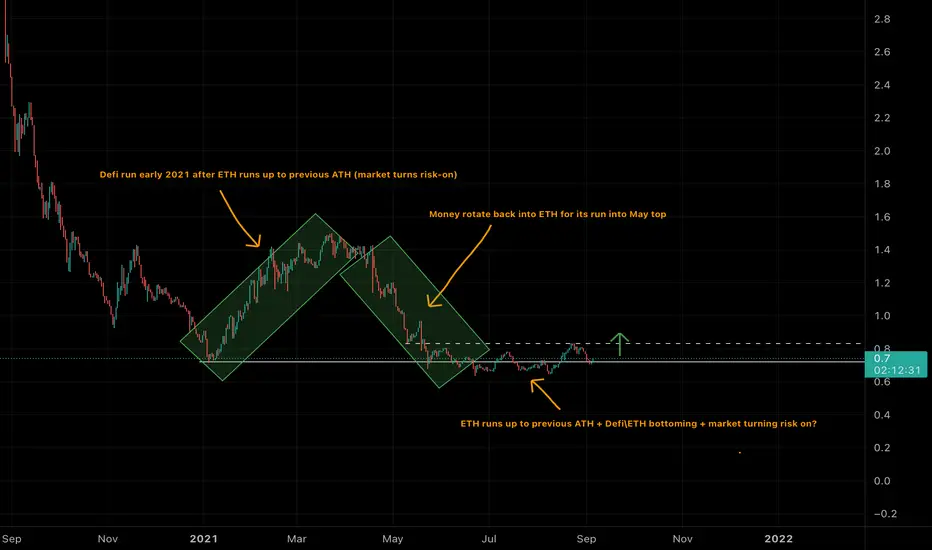
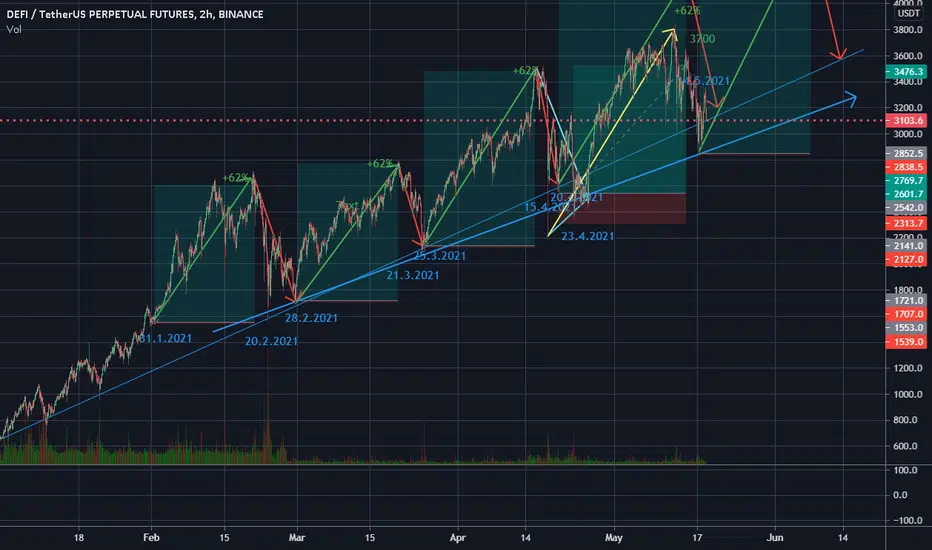
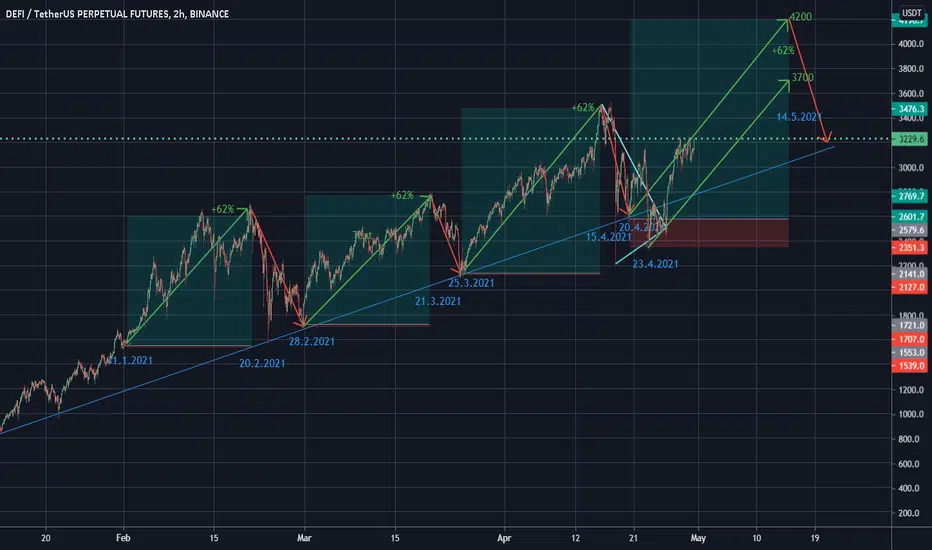
Are we going to see the new ATH in the DeFi sector? Hello everyone,
First off, this is not a financial advice. Now let's begin.
A couple of posts below I have shared my view about the Macro cycle of the BTC. It follows the cycle as predicted, but there was a factor in the beginning-mid August when billions and trillions of dollars were coming to the exchanges. I was sure that these money won't be invested in BTC, because of my view about the macro cycle of bitcoin. However, as we know, every token and coin follows the Bitcoin. Well, it turned out that not any. ADA recently made the new ATH and a lot of another coins but mostly from the DeFi sector.
Right now is a crucial moment for the DeFi as a whole because we reached global fibonacci golden pocket and need to penetrate it in order to set the new ATHs. According to Wyckoff Accumulation (Although it's not perfect on the chart) it looks like we're at the Phase D and entering Phase E and really everything is looking in the bull's favor for the long term.
Again, not a financial advice, just sharing my thoughts. Will be interested to hear your feedback.

$DEFI/USDT 6h (Binance Futures) Rising wedge breakdown & retestDeFi index lost 50MA support that was holding the up-trend and finally broke bearish.
Now retesting the wedge, seems like retracement is in play short-term before resuming bullish again!
Current Price= 2476.9
Sell Entry = 2495.9 - 2616.9
Take Profit= 2263.2 | 1986.6 | 1790.0
Stop Loss= 2810.3
Risk/Reward= 1:1.15 | 1:2.24 | 1:3.02
Expected Profit= +22.94% | +44.58% | +59.96%
Possible Loss= -19.86%
Fib. Retracement= 0.382 | 0.382 | 0.5
Margin Leverage= 2x
Estimated Gain-time= 3 weeks


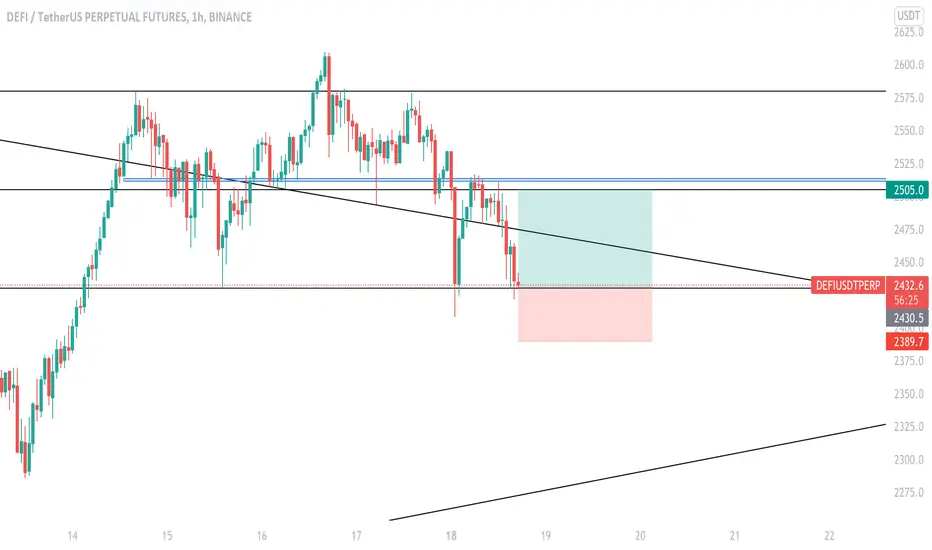
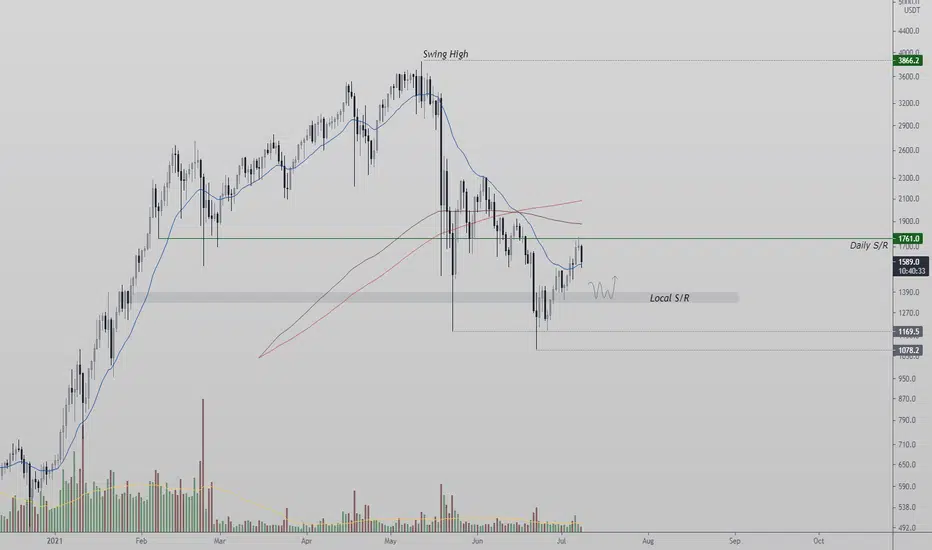
DEFIUSDTPERS Local S/R| Daily S/R| Price Action Evening Traders,
Today’s analysis – DEFIUSDTPERPS – Treading below its Daily S/R with further downside probable,
Points to consider,
- Price Action Impulsive
- Local S/R Support
- Daily S/R Resistance
- Low Volume
DEFIUSDT’s immediate price action is trading below a key technical level that needs proving resistance.
The Local S/R is current support, holding this level is critical for support, failure will increase further downside.
The current volume profile is below average, an influx is highly imminent when testing key trade locations.
Overall, in my opinion, DEFIUSDT remains short until the Daily S/R is breached
Hope this analysis helps
Thank you for following my work
And remember,
“In order to succeed, you first have to be willing to experience failure.”
― Yvan Byeajee,
$DEFI/USDT 4h (Binance Futures) Descending channel on supportLet's give DeFi composite index another chance to bounce and resume bullish!
Current Price= 1386.7
Buy Entry= 1364.3 - 1300.1
Take Profit= 1533.5 | 1769.4 | 2066.6
Stop Loss= 1148.4
Risk/Reward= 1:1.1 | 1:2.38 | 1:4
Expected Profit= +15.11% | +32.82% | +55.13%
Possible Loss= -13.80%
Fib. Retracement= 0.236 | 0.5 | 0.786
Margin Leverage= 1x
Estimated Gain-time= 3 weeks

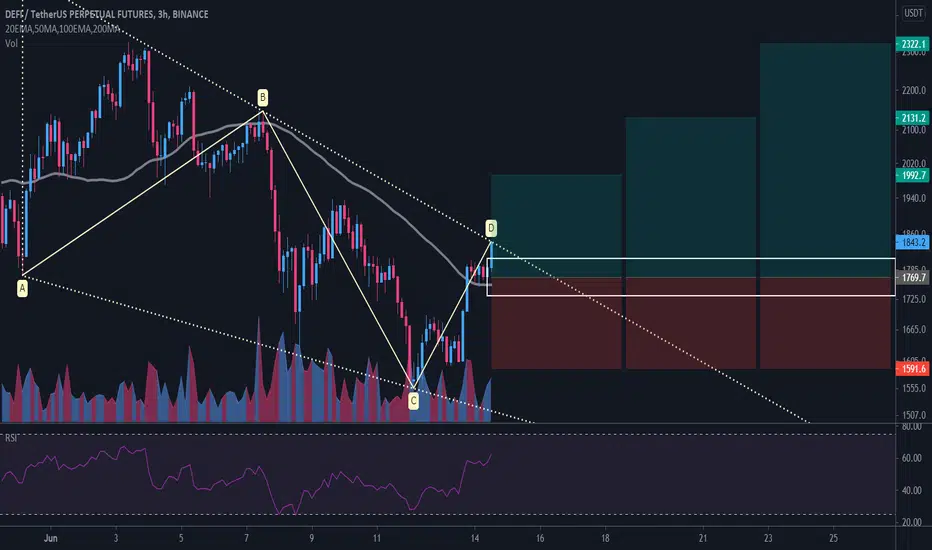
$DEFI/USDT 3h (Binance Futures) Falling wedge near breakoutDeFi index is about to break bullish, you can enter here of wait for a small pull-back!
Current Price= 1843.2
Buy Entry= 1808.3 - 1731.1
Take Profit= 1992.7 | 2131.2 | 2322.1
Stop Loss= 1591.6
Risk/Reward= 1:1.25 | 1:2.03 | 1:3.1
Expected Profit= +25.20% | +40.86% | +62.42%
Possible Loss= -20.12%
Fib. Retracement= 0.618 | 0.786 | 1
Margin Leverage= 2x
Estimated Gain-time= 2 weeks

DEfi index Futures and volumeEasy trade.
Watch the king, BTC, watch dominance. Trade alt.
Defi is the best sector.
use the index in order to decrease the margin of error.
Leverage x10

🚀This Time Is DifferentThe post-traumatic stress caused by the great Bear Market of 2018 may be still vivid in crypto investors' minds.
The fear of buying the top is so intense for many traders that they see every dip around a new all-time high with great prudence. That is not a bad thing per-se. Risk management is one of the main pillars of trading. Taking profits from time to time helps to balance the overall risk of the portfolio, and, in some cases, it makes a lot of sense.
A few weeks ago, we called for a period of uncertainty, and it actually led to a broad market correction. Bitcoin keeps struggling with breaking the $60,000 level, and it may take a while before we see a clear breakout. Meanwhile, Altcoins show resilience on each dip, proving that the demand is still there.
Binance calculates a DeFi index using ten large-cap coins, and its chart looks undoubtedly bullish. The index is consolidating above an inverse head & shoulder right below the all-time high. As long as the red horizontal level holds, the chances are that the market experiences a new strong leg up at any time. From the macro point of view, the crypto market looks as solid as it ever has been.
In 2017, the only blockchain with real use was Ethereum. And it was used mainly to pour money into ICOs with no working products. Today, everything is different as billions worth of transactions daily provide real utility for those using decentralized protocols. Liquidity providers, oracles, exchanges, lending, NFTs can still add fuel to this Bull Market.
