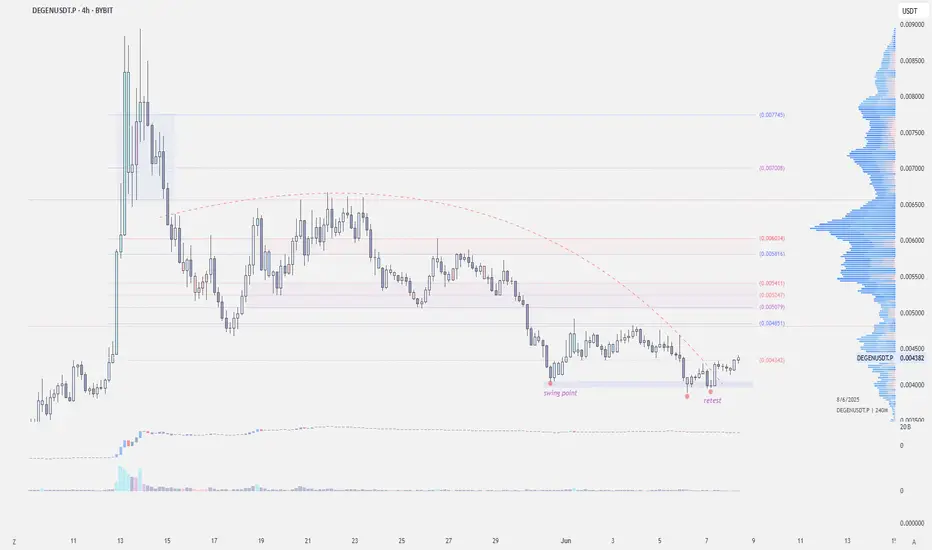
$DEGEN - Long Trade IdeaBYBIT:DEGENUSDT | 4h
Price deviated from its swing point at 0.0038 and has now retested it on the lower timeframes.
If this retest holds, we want to see price maintain support at 0.0040
Holding this level opens up a potential liquidity sweep around 0.0050–0.0054
If momentum continues and Bitcoi
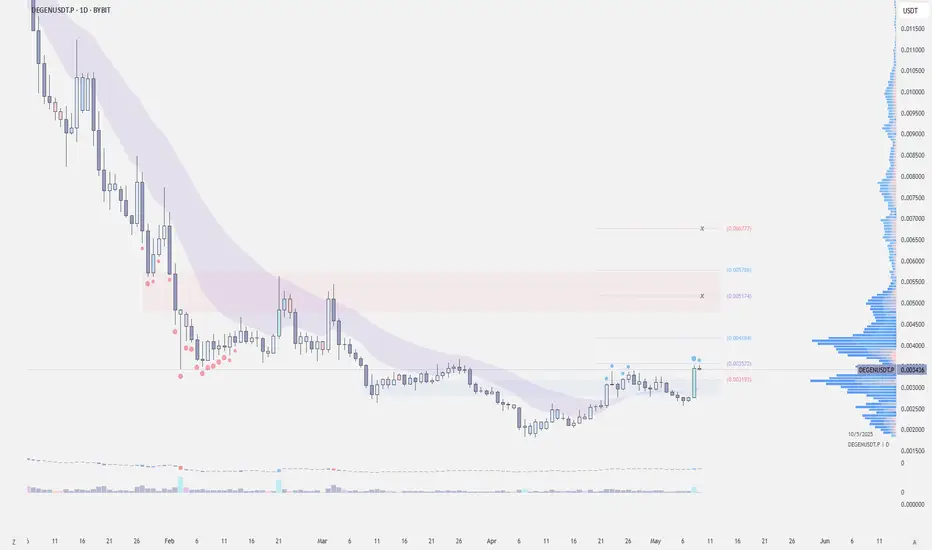
DEGENUSDT Key Support – 255% Move on the Table if BullsDEGENUSDT has made a strong impulsive move and is now entering a corrective phase. All eyes are on a critical support zone where the next big reaction could determine the direction of the next 250%+ move.
Key Highlights:
Support Confluence: Point of Control + Daily Support + 0.618 Fibonacci
Upside
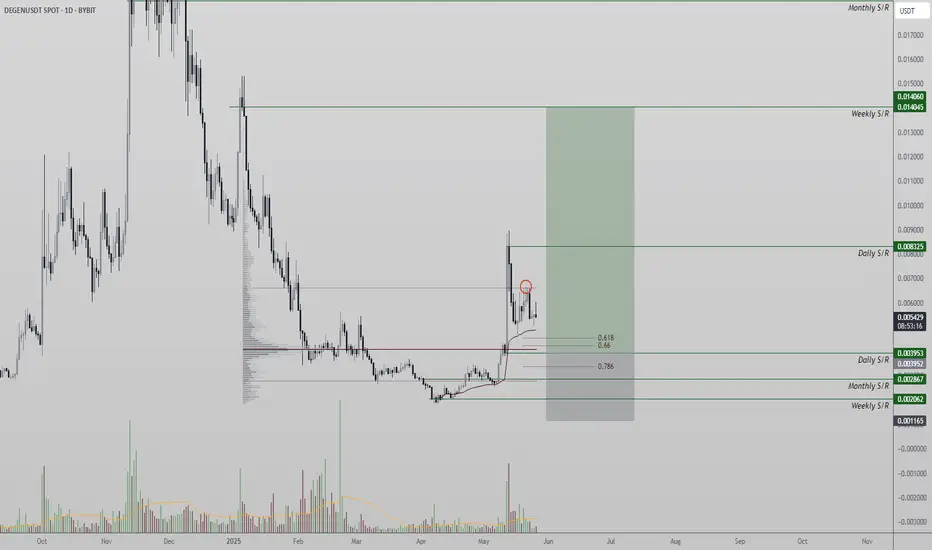
$DEGEN - Long SetupBYBIT:DEGENUSDT | 1D
Potential S/R flip here, hold this level I'm expecting it to run .009 to .012 (initial) to .016 to .020
Local support is around .005 to .0035
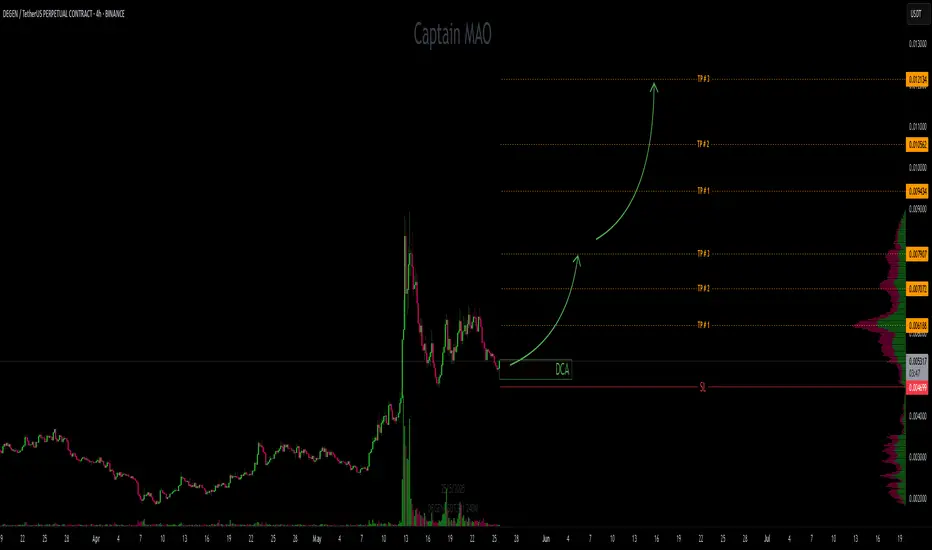
DEGEN/USDT - Continuation DEGEN/USDT has shown a strong bullish structure following a significant recent up move. Price action has now pulled back into a key support zone, offering a potential high-reward entry opportunity.
Entry Zone: $ 0.0051-0.0053
Stop Loss: $ 0.0048
TP1: $ 0.0061
TP2: $ 0.007
TP3 : $ 0.008
if showin
DEGEN (4H/1H): Pullback to Order Block & FVG - Long Setup • Summary :
- 4H Timeframe:Price is retesting a bullish Order Block and FVG (Fair Value Gap)suggesting potential support.
- 1H Timeframe:Key demand zone at 0.005099–0.004956** (first order block). A reversal is likely if:
- Bearish momentum weakens (declining selling volume).
- Bullish c

DEGEN (1D/1H): Awaiting Breakout for Long Entry
#### **Market Context**
- DEGEN shows a strong **bullish trend on the daily chart**, but faces a local resistance on the 1H timeframe.
- Key focus: Break above **0.008846** for confirmation of continuation.
#### **Key Levels**
- **Resistance**: 0.008846 (Breakout trigger)
- **Support Zo
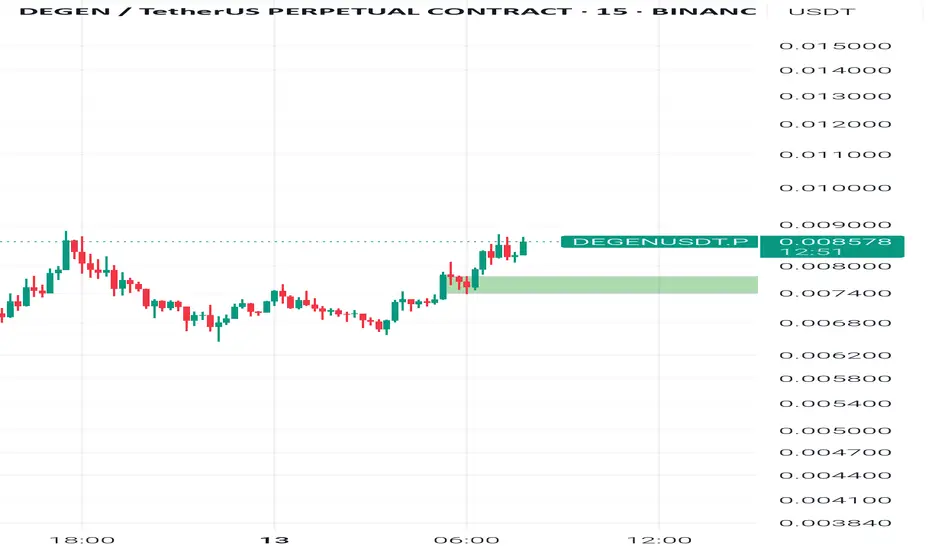
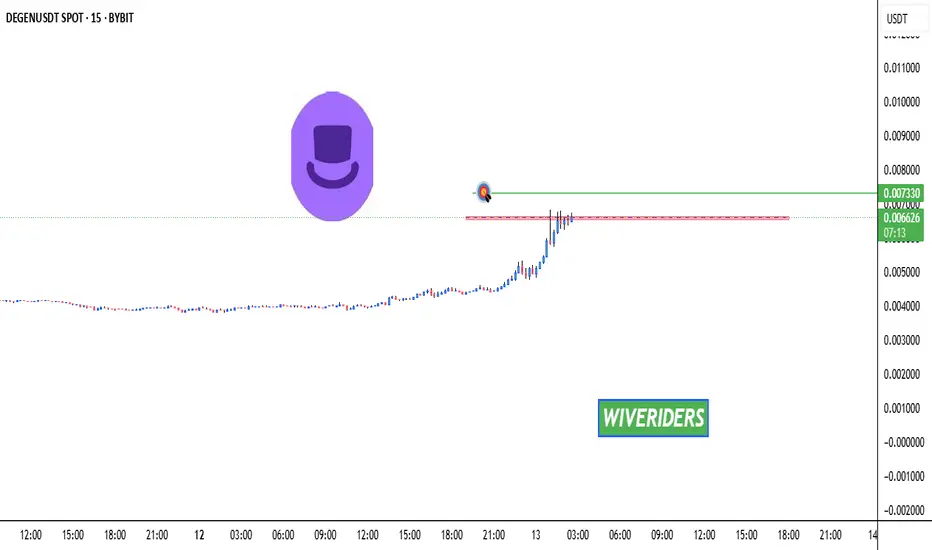
DEGEN Testing Red Resistance – Breakout Potential!🚀 DEGEN Testing Red Resistance – Breakout Potential! 📈
DEGEN has formed a red resistance zone, where we’re seeing some sellers stepping in. If the price breaks through, the trend could continue with the first target at the green line level! 📊
Let’s watch for that breakout together! 💼💸
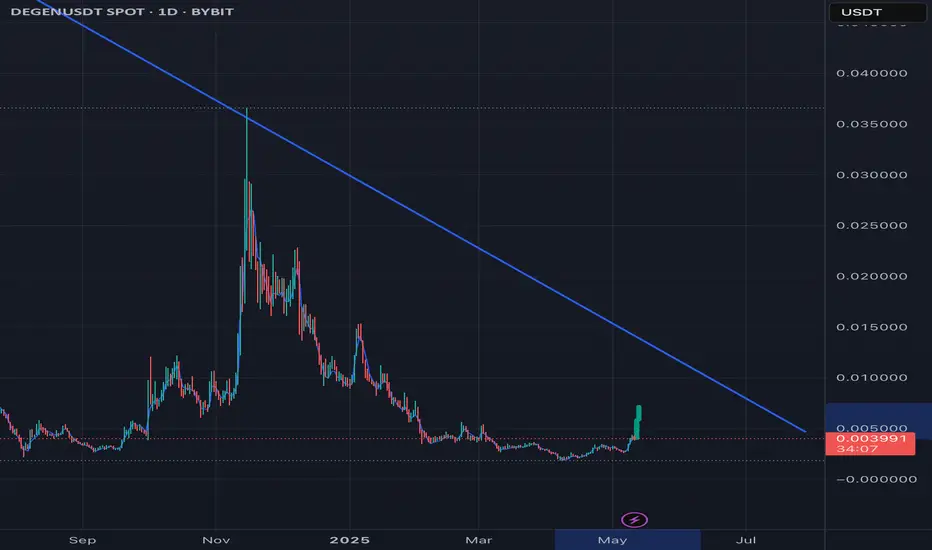
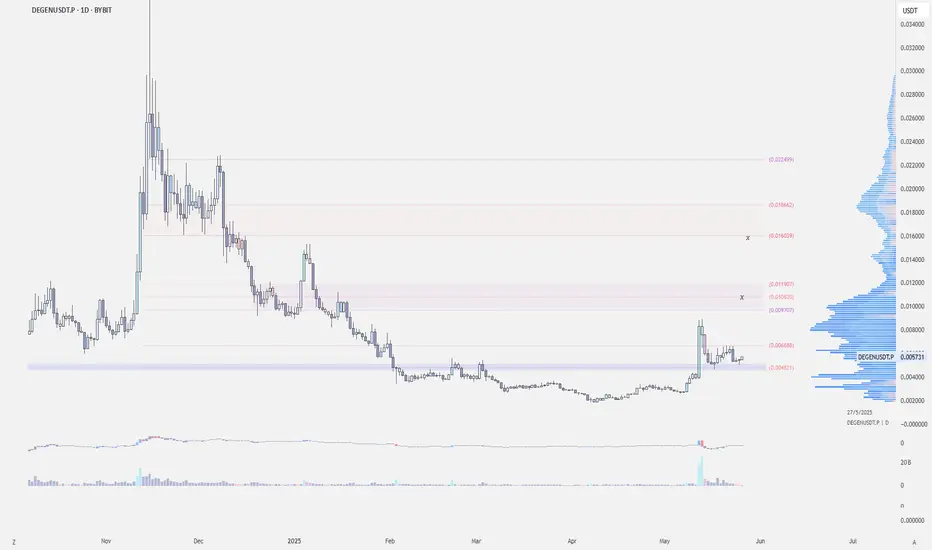
$DEGEN - Long Trade IdeaBYBIT:DEGENUSDT | 1D
I'd be looking to long this if we can hold .0032 to .0030
Stoploss: just below .0024
Targets:
.0040-.0044
.0050-.0054
.0057-.0062
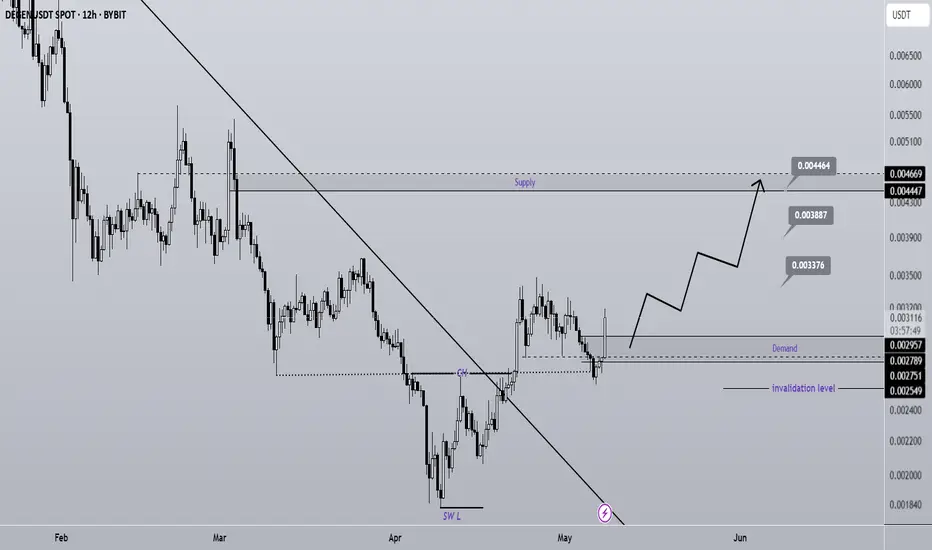
DEGEN Buy/Long Setup (4H)A significant trendline has been broken. The price has formed a bullish CH (Change of Character) on the chart. In addition to the identified support zone, a key level also passes through this area, which the price has successfully retested.
As long as the green zone holds, a move toward the targets
See all ideas
Summarizing what the indicators are suggesting.
Oscillators
Neutral
SellBuy
Strong sellStrong buy
Strong sellSellNeutralBuyStrong buy
Oscillators
Neutral
SellBuy
Strong sellStrong buy
Strong sellSellNeutralBuyStrong buy
Summary
Neutral
SellBuy
Strong sellStrong buy
Strong sellSellNeutralBuyStrong buy
Summary
Neutral
SellBuy
Strong sellStrong buy
Strong sellSellNeutralBuyStrong buy
Summary
Neutral
SellBuy
Strong sellStrong buy
Strong sellSellNeutralBuyStrong buy
Moving Averages
Neutral
SellBuy
Strong sellStrong buy
Strong sellSellNeutralBuyStrong buy
Moving Averages
Neutral
SellBuy
Strong sellStrong buy
Strong sellSellNeutralBuyStrong buy
Displays a symbol's price movements over previous years to identify recurring trends.