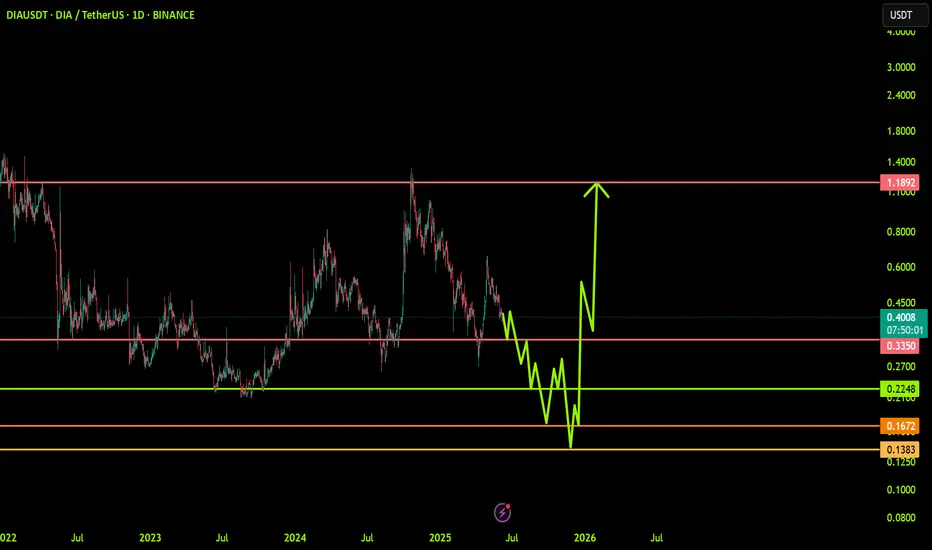
DIAUSDT: Trend in daily timeframeThe color levels are very accurate levels of support and resistance in different time frames, and we have to wait for their reaction in these areas.
So, Please pay special attention to the very accurate trend, colored levels, and you must know that SETUP is very sensitive.
Be careful
BEST
MT
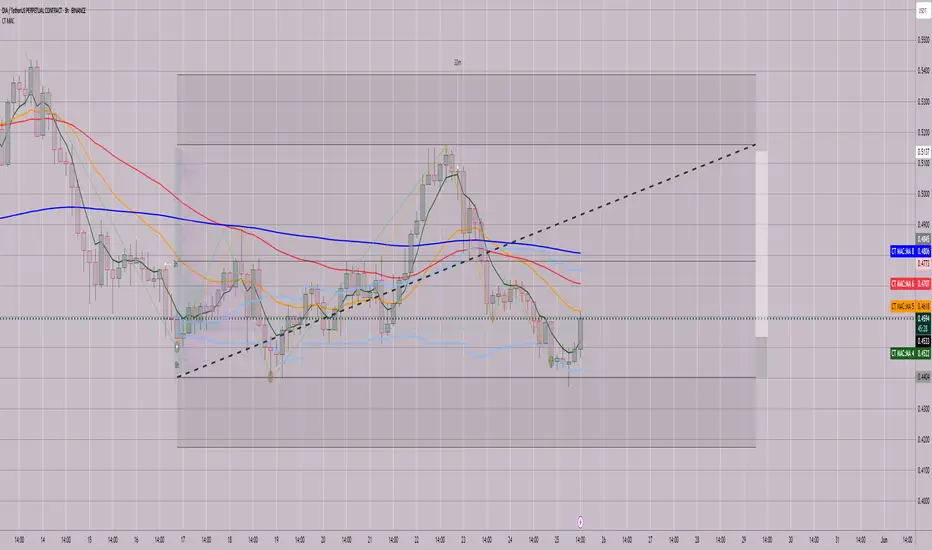
A strategic, short-term bullish trade driven by the USDT.D!This DIA/USDT long position is a strategic, short-term bullish trade driven by the USDT.D distribution pattern on the 45-minute timeframe, signaling a potential altcoin rally. DIA’s strong fundamentals, including its transparent data sourcing, DeFi adoption, and cross-chain compatibility, make it a
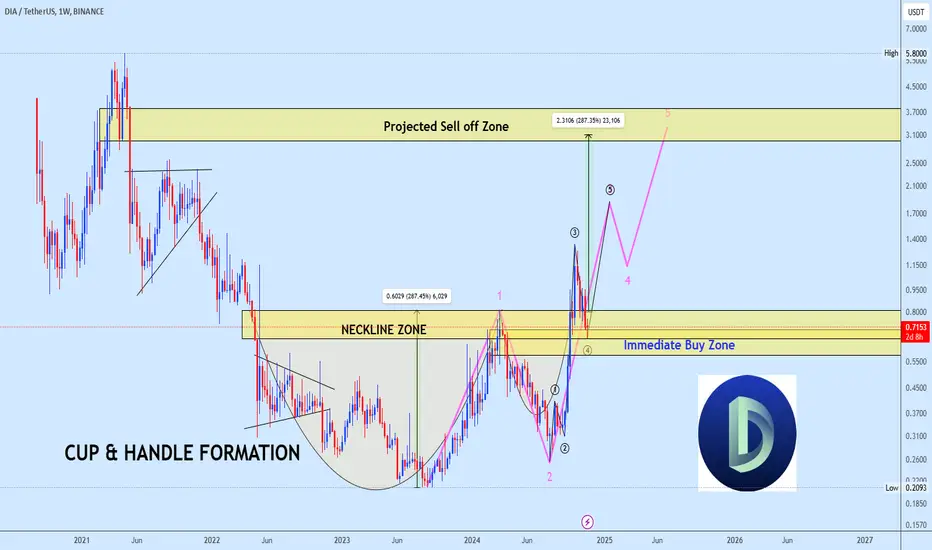
DIAUSDT buy opportunityDIAUSDT is displaying a well-defined cup and handle pattern, with the price successfully breaking above the neckline and currently retesting this zone as a healthy pullback.
The immediate buy zone serves as a strategic entry point, aligning with the continuation of the bullish structure. The wave
Trend Analysis for DIA/USDT### 📈 **Trend Analysis for DIA/USDT**
#### 1. **Current Trend:**
* DIA is in a **potential early-stage uptrend**, coming off a **long accumulation zone**.
* Price is **breaking out of a downtrend channel**, or at least testing the top of a sideways range that’s lasted for months.
* There’s a notic
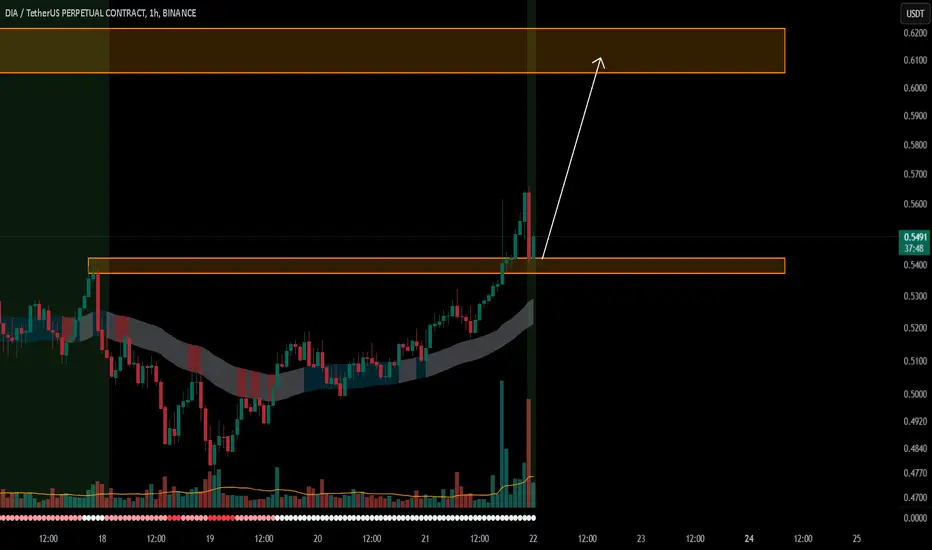
DIA/USDTKey Level Zone: 0.5370 - 0.5420
HMT v6 detected. The setup looks promising, supported by a previous upward/downward trend with increasing volume and momentum, presenting an excellent reward-to-risk opportunity.
HMT (High Momentum Trending):
HMT is based on trend, momentum, volume, and market struc
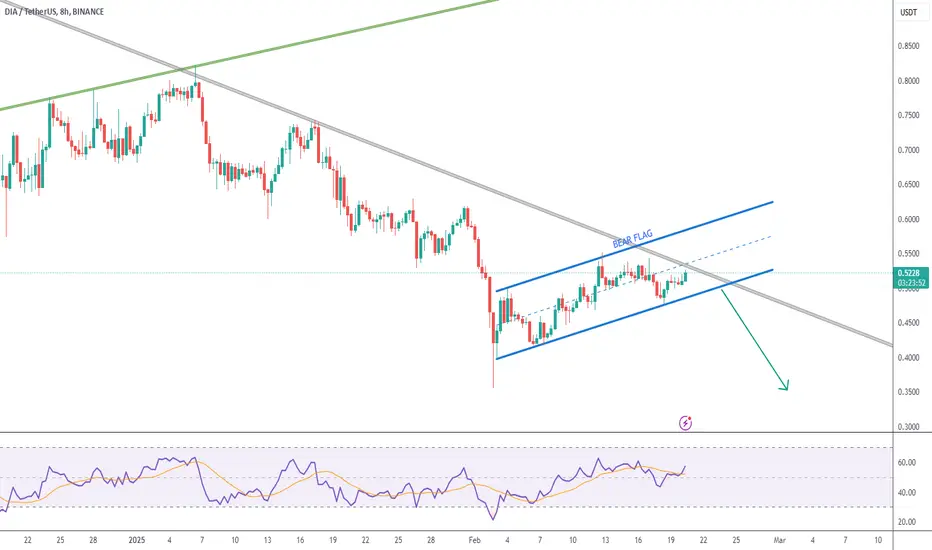
DIA 8H Chart Downtrend
Following up on my previous analysis, the downtrend is still strong, and I expect another leg down.
The upside grind has the look and feel of a bear flag, and there is no RSI divergence on the recent low.
The gray descending trendline could serve as resistance.
DIA / USDT looks great, holding to 5 usdt ?DIA is an Ethereum token that governs Decentralized Information Asset (DIA), an open source Web3 data and oracle platform. This platform allows smart contracts to connect to external data sources, such as DeFi market data and centralized APIs. DIA can be used to propose and vote on platform upgrades

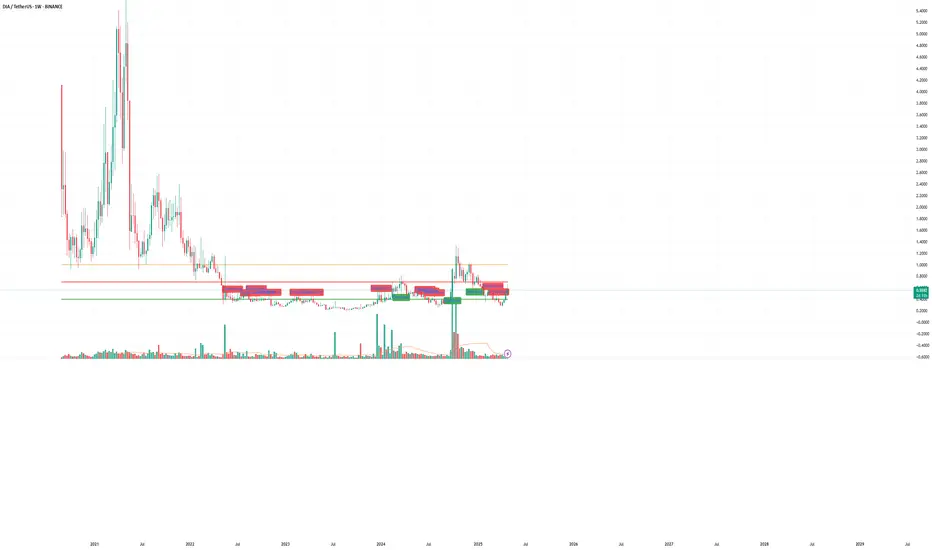
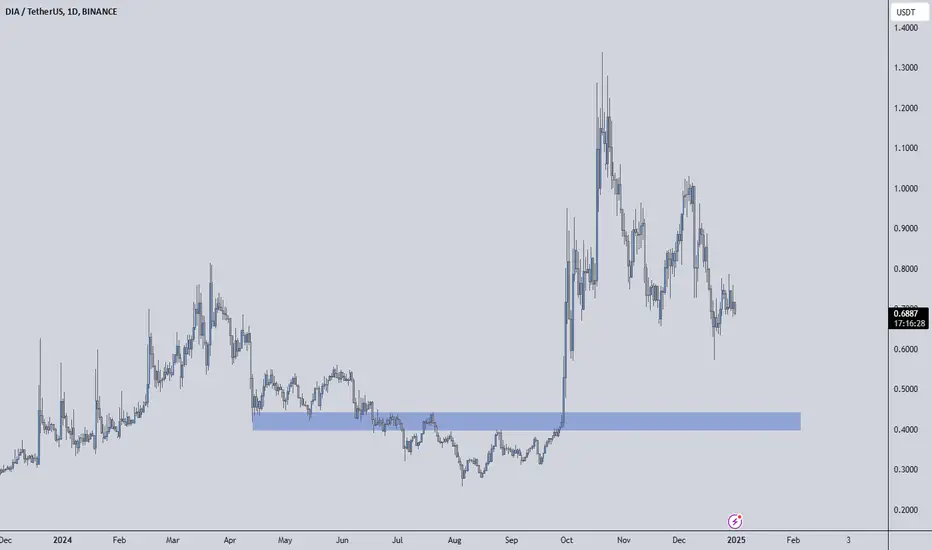
DIAUSDT Analysis: Volume Spike with a Strong Demand ZoneDIAUSDT Analysis: Volume Spike with a Strong Demand Zone
Daily Volume Increase: DIAUSDT shows a significant 96% spike in daily volume, indicating heightened interest.
Volume-to-Market Cap Ratio: The 60% ratio suggests active trading relative to its market cap.
Blue Box Entry Zone: The blue box is
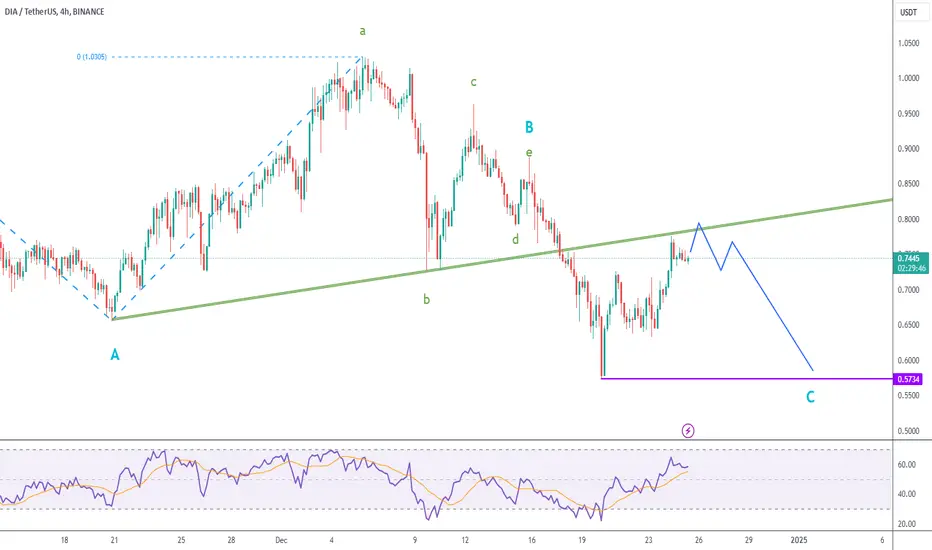
DIA Short Trading Plan
▶️I'm watching DIA's 4H chart price action for a short trade targeting 0.5734 (purple line).
▶️A failed retest of the green ascending trendline, with RSI divergence, followed by a lower low in smaller timeframes will be my trigger.
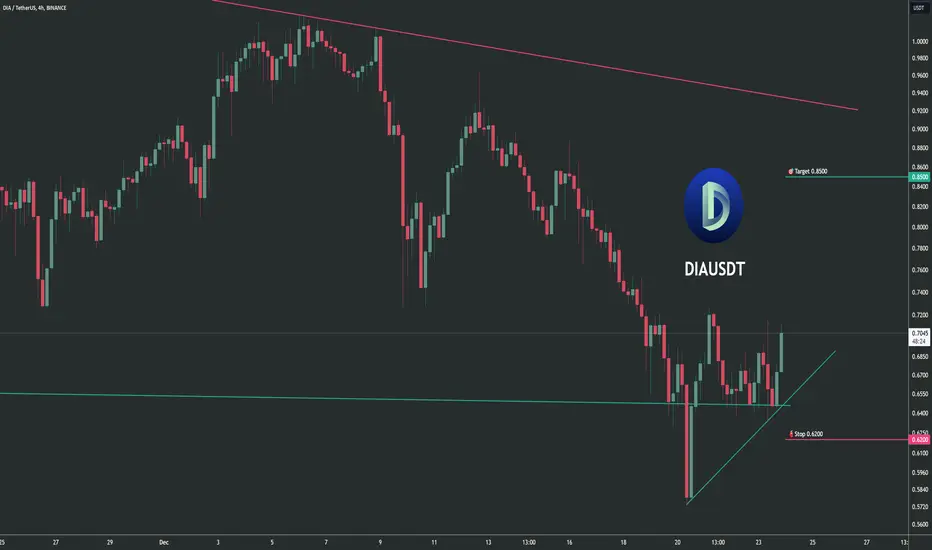
Trading opportunity for DIAUSDTBased on technical factors there is a Buy position in :
📊 DIAUSDT
🔵 Buy Now
🪫Stop loss 0.85
🔋Target 0.62
📏 R/R 1.7
💸RISK : 1%
We hope it is profitable for you ❤️
Please support our activity with your likes👍 and comments📝
See all ideas
Summarizing what the indicators are suggesting.
Oscillators
Neutral
SellBuy
Strong sellStrong buy
Strong sellSellNeutralBuyStrong buy
Oscillators
Neutral
SellBuy
Strong sellStrong buy
Strong sellSellNeutralBuyStrong buy
Summary
Neutral
SellBuy
Strong sellStrong buy
Strong sellSellNeutralBuyStrong buy
Summary
Neutral
SellBuy
Strong sellStrong buy
Strong sellSellNeutralBuyStrong buy
Summary
Neutral
SellBuy
Strong sellStrong buy
Strong sellSellNeutralBuyStrong buy
Moving Averages
Neutral
SellBuy
Strong sellStrong buy
Strong sellSellNeutralBuyStrong buy
Moving Averages
Neutral
SellBuy
Strong sellStrong buy
Strong sellSellNeutralBuyStrong buy
Displays a symbol's price movements over previous years to identify recurring trends.