🚀 "Swing into Profits: Ride the Bullish Momentum of DODOUSDT"💸💼 "Profit from the Swing: Capture Bullish Opportunities with DODOUSDT's High-Reward Trade Idea!" 🚀📈💥
🔥 Are you an investor seeking swing trade ideas with high reward potential and minimum risk? Look no further! Discover the lucrative trading opportunity with DODOUSDT, offering a 1:4 risk-to-reward ratio that maximizes your chances for success. 💪💰
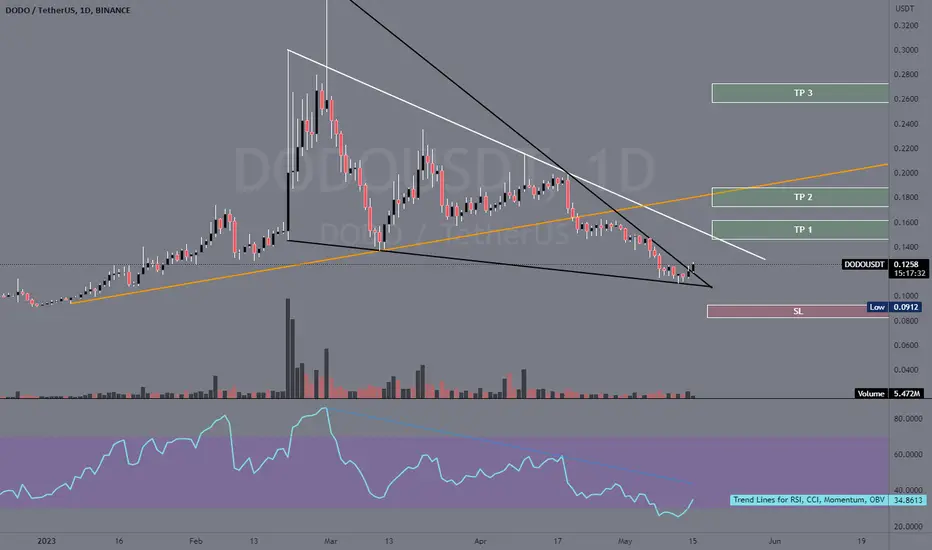
💡 Embrace the power of swing trading as you ride the bullish wave of DODOUSDT. This setup presents an ideal entry point to capitalize on short-term market movements and unlock substantial profits. 🌟📈✨
📊 Make informed decisions based on thorough market analysis. Stay ahead of the curve, identify key trends, and minimize risk while aiming for substantial gains. 💼💡📉
⏳ Time your trades strategically and position yourself for success. Seize the moment and let DODOUSDT swing your portfolio into a realm of profitable possibilities. 💯🚀
🔔 Like and share if you're ready to capture the bullish opportunities with DODOUSDT! Join the community of savvy investors and inspire others to swing into success in the dynamic world of trading. 💸📈💼
DODOXUSDT.P trade ideas

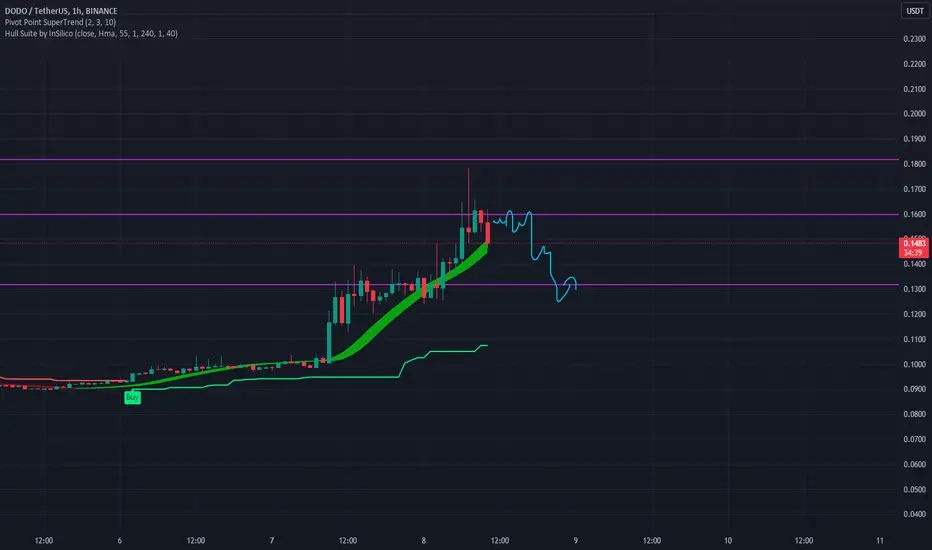
#DODO/USDT breaks the Diagonal Trendline in 1-Hour TF!#DODO/USDT breaks the Diagonal Trendline in 1-Hour TF!
SET:DOD looking good for Long position. Break PDL too. Expecting some bullish momentum. The major support level is PML $0.09045.

DoDo usdt and good for LONG positionDoDo usdt and good for LONG position
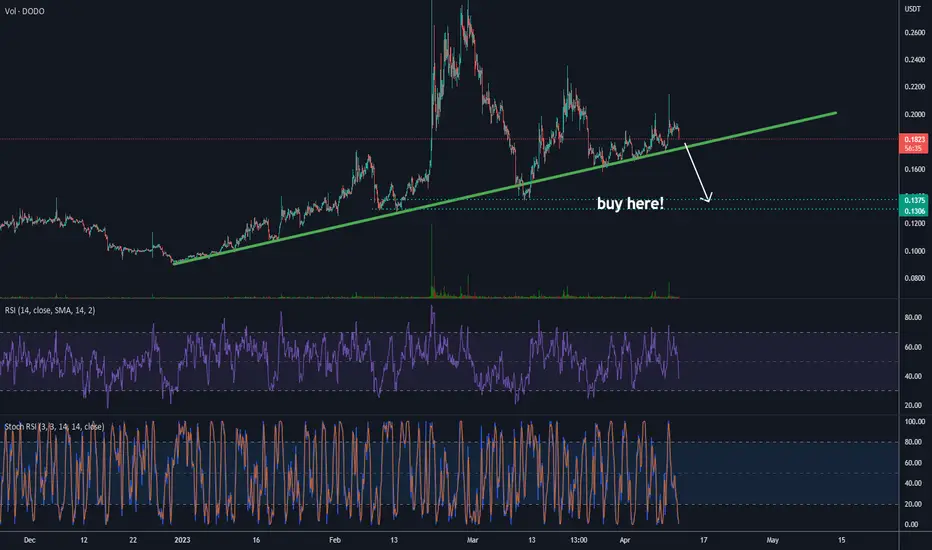
we have a pullback to the trendline

Dodousdt , technical analysis 🎯 TargetGoal 0.17 .... It seems to be able to grow to these areas,It is in a good support zone.It is in a good support zone. The trend line has broken.
Target 0.15 or 0.17
DODOUSDT 2DPay attention to #DODO
I'm Bullish on it. MACD and RSI are good. It's attempting to break out the channel + ichimoku cloud. My targets are on chart.

DODOUSDTDODOUSDT is just enter into the bullish trend make first HH.
We wait for the price retracement.
when price go down to made HL we wait there and made precise entry from here.

DODO/USDTDODO has broken out via the Bollinger Band Squeeze indicator which gives real time alerts for breakouts and breakdowns.

DODO 100 %+DODO possible move up 100 %+
After big move now we have correction, now we are at Supertrend support 4H, I think its good place to open long possition and hold for big profits

$DODO performing Descending TriangleWhat Is a Descending Triangle Chart Pattern?
A descending triangle is a powerful technical analysis pattern with a predictive accuracy of 87%. The pattern is flexible and can break out up or down, and is a continuation or a reversal pattern.
A descending triangle has one declining trendline that connects a series of lower highs and a second horizontal trendline that connects a series of lows. A descending triangle can be bearish or bullish or a reversal or continuation pattern, depending on the direction of the price breakout.
A descending triangle occurring during a price uptrend, with a price breakout above the resistance line, is considered a bullish continuation pattern. (See chart below)
Conversely, a descending triangle occurring during a price downtrend, with the price breaking out above the resistance line, is considered a reversal pattern.
KEY POINTS
The descending triangle has a horizontal support line and a declining slope resistance line.
If the price breaks out of the triangle in the direction of the previous trend, it is a continuation pattern.
If the price breaks out of the triangle in the opposite direction of the previous trend, it is a reversal pattern.

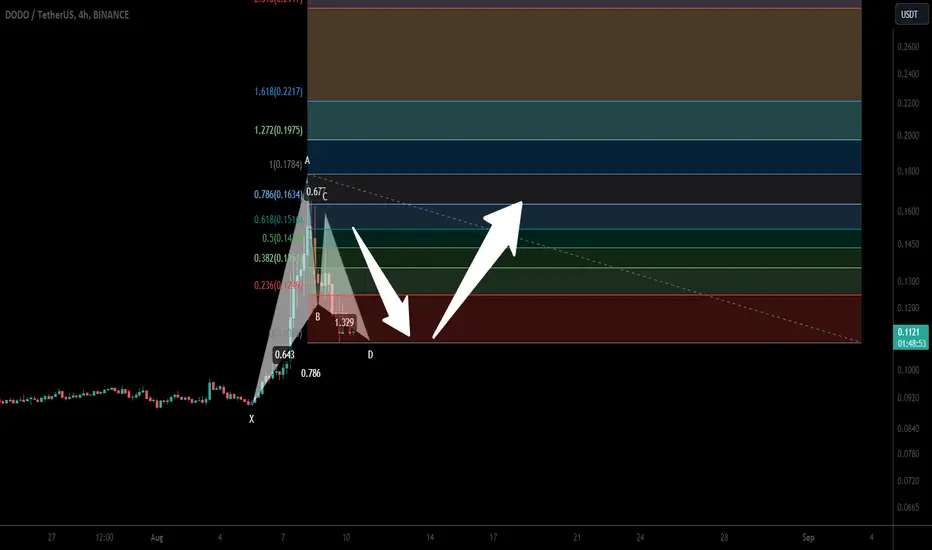
DODO token formed bullish Gartley for upto 82% pumpHey dear friends, hope you are well, and welcome to the new update on DODO token with US Dollar pair.
Previously we caught 70% pump of DODO as below:
Now on a 4-hr time frame, DODO has formed a bullish Gartley move for the next price reversal.
Note: Above idea is for educational purpose only. It is advised to diversify and strictly follow the stop loss, and don't get stuck with trade.
DODO Bird taking off?Well we did one more tiny low but might have started now what appears an wyckhoff spring where downtrend might get surpassed.
intermediate 0.618-0.886 might be areas of reversal, above 0.886 next target will be 1.272 intermediate and major (nice confluence).
Price now should retrace before taking local 4.236
---
If you like my content, if it helps you gain profit, give it a like!
Thanks!
---
Hold my beer pls
----
No financial advice, do your own research, don't be stupid

DODO might follow YGGHello Traders,
Binance Futures Will Launch USDⓈ-M DODO Perpetual Contract With Up to 20x Leverage.
The same story, same shitshow. Negative funding, so, don't try to short it early.
Please hit the boost button and follow me for more ideas.
Thanks

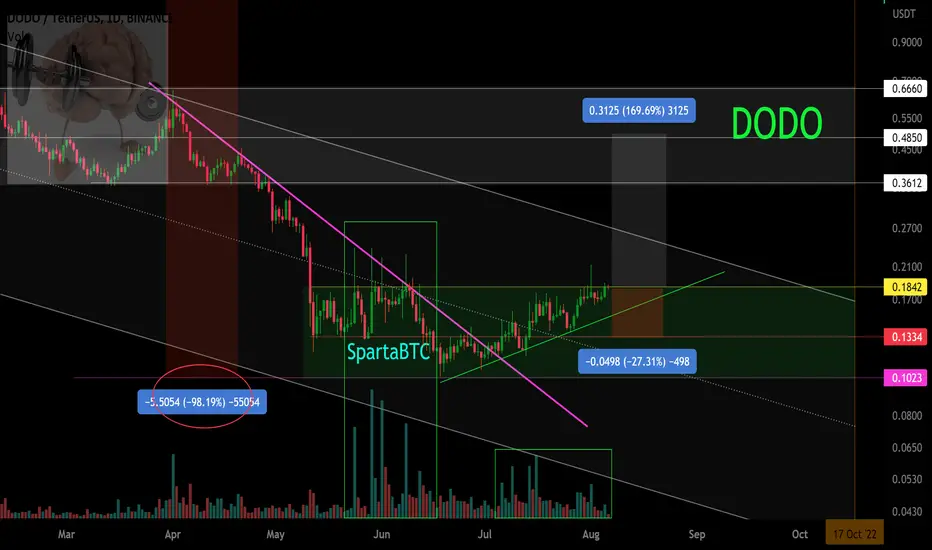
DODOUSDT ShortDodo is uptrend for 6 days.
If you zoom out and look 3D chart, you can see it is rising from 4-5th of August and it made 61% in 2 weeks.
But right now it's bear market, BTC just drops to 28k.
It looks like a pump and dump, just bigger.
0.15 USD is a pszicho-level, it's a round number. And we have the big spike to .18 in smaller CEXes to 0.20 in futures market.
Funding is -2 so lots of shorts are open. If the funding will go lower we will see the price fall also and spot and perp price will be the same.
Right now it is a good change to enter short.
If 0.15 fails clearly in a 1h or 4h chart we are the winners.
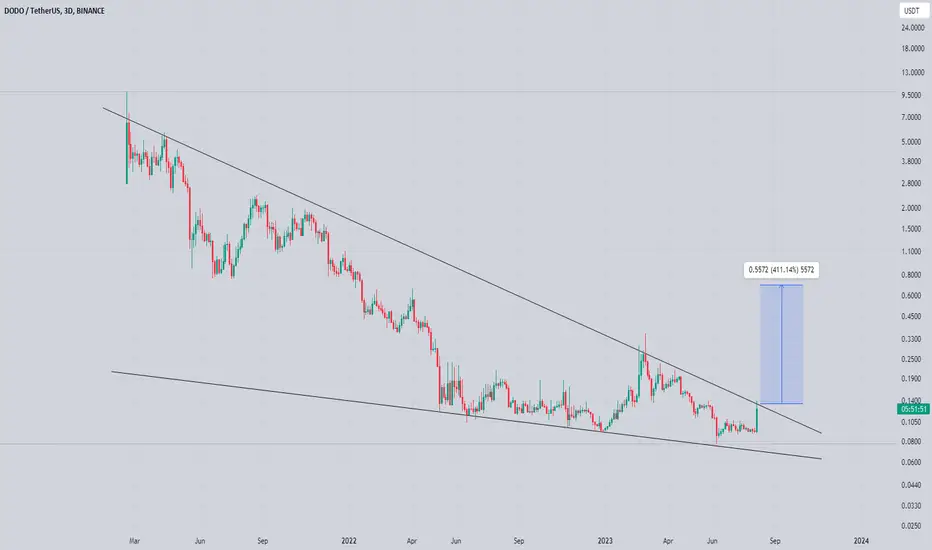
Dodo Trying To clear Falling Wedge Seems Like Long downtrend Getting Closer Towards Reversal Formed & trying To clear falling Wedge In 3 days Incase Of Successful breakout expecting Move towards 0.60$ Keep Eyes On For breakout Don,t trade without breakout
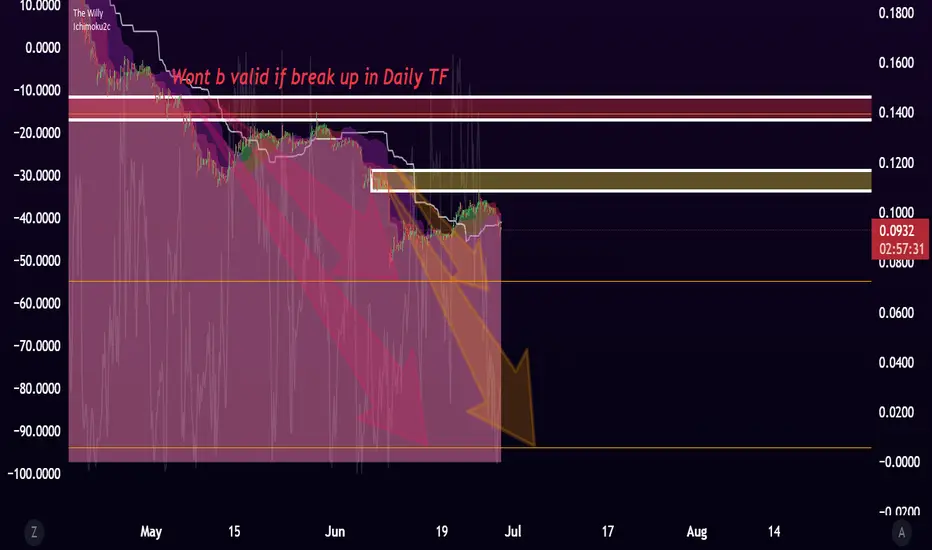
DODO/USDT Local work. VolumeLocal trend. Reversal zone. Time frame 1 day. Logarithm.
Coinmarketcap: DODO
Pay attention to the early redeemed large amount of the coin, before this accumulation.
Line graph of the given zone.
From the resistance of the distribution zone, the price decreased by - 98%
Main trend.
DODO/USDT Main trend. Descending channel
DODO ANALYSIS (3D)Hi, dear traders. how are you ? Today we have a viewpoint to BUY/SELL the DODO symbol.
We are in the E branch of the large diametric drop.
The time frame is big and time consuming.
Symbols that have such a situation are clearly not well founded
For risk management, please don't forget stop loss and capital management
When we reach the first target, save some profit and then change the stop to entry
Comment if you have any questions
Thank You

#DODOUSDT - Long - Potential 8.01%Direction: Long
Market: Spot
Risk: 0.25% - 1%
#USDT_DODO
Exchange: BINANCE
Timeframe: 360
TP1: 0.0998
Entry: 0.0927
STOP: 0.0902
Entry Conditions:
| RVOI Trendbreak
| Price downtrend break
| Bullish overhead Pivot


MY TRADE TODAY 001BYBIT:DODOUSDT.P
Hey guys I'm excited to show you my trades on these coins on a daily basis so to start it off today I'm looking to just simply follow the trend on the 15M timeframe on DODOUSDT I will be getting more into the day trading side of things instead of the swing trading side so I can be more active on here with everyone so sit tight and let me show you guys what i can do over a period of time. SO this is still a limit buy so sit tight and let it grab the bag!

#DODO Long Setup - $DODOUSDTIn my opinion, #DODO is going to run it back, Hard. - once Bitcoin #BTC settles or allows alts a breather.
As always, stay safe, and DYOR.
BINANCE:DODOUSDT
DODO at 2023 support test$DODO won't support for long this line. bear are sick and may see a break of the 2023 good trend.