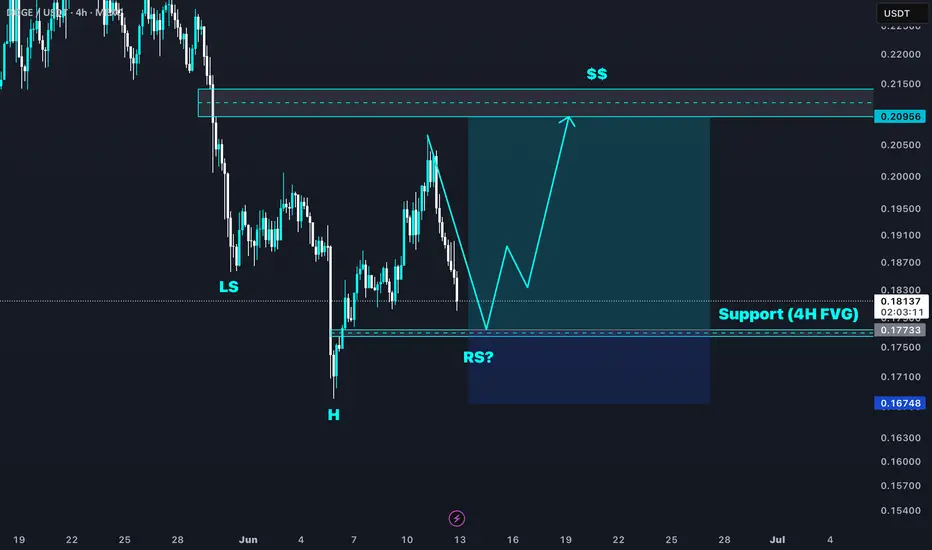
You were warned. Now it’s runningThis was the second test into the FVG + 4H OB confluence. High volume candle. Wicking liquidity. And structure still intact.
Why I stayed calm:
Price didn't just drop — it delivered into a known rebalance zone. That 0.176–0.178 box was a magnet, not a mystery.
The reaction came right on cue:
Volume confirmed interest
Structure stayed intact
And the engine kicked in right after the sweep
Now? The play isn’t about guessing the top. It’s about knowing where price is drawn — and why.
Play-by-play logic:
4H OB provided the base
FVG gave the imbalance
Reaction zone created a clean entry
TP target? +18% mapped to 0.21
I didn’t enter on emotion. I positioned based on structure. That’s why it’s already moving while others still think it needs “confirmation.”
Final words:
“You don’t need hindsight when your foresight is built on logic.”
DOGEUSDT.3L trade ideas

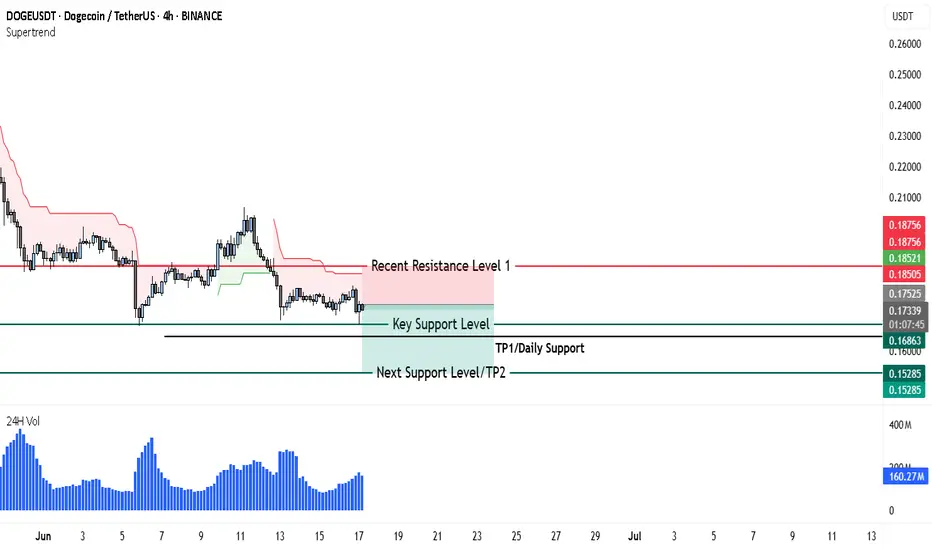
DOGE Support Is Crumbling Here’s Why a Drop to $0.15 Is On CardsThe 4-hour chart for DOGEUSDT reveals a weakening structure, with price currently hovering just above a key support at $0.16863, which also aligns with the marked TP1/Daily Support level. Price action has been consistently rejected from the upper zone near $0.18500–$0.18756, confirming that supply is dominant at higher levels.
The Supertrend indicator remains firmly red and is trailing far above the current price — a strong confirmation that the trend bias is still bearish. Each attempt to retest or reclaim higher ground is quickly sold off, indicating a lack of bullish conviction.
From a structural perspective, DOGE recently formed a lower high followed by a breakdown beneath the local mid-range. This has pushed the price back into a distribution-to-breakdown zone, where the probability of further downside is increasing. If the current support at $0.16863 breaks with momentum, the next obvious liquidity pool is sitting near $0.15285, which is already marked as the Next Support/TP2. That level could serve as the next major bearish target.
Volume also supports a bearish narrative — despite brief surges, the recent volume profile shows no sustained buying pressure, and sellers remain in control around each resistance test. The failure to push above the $0.173–$0.175 region in the last bounce attempt further reinforces the weakening bullish effort.
While some buyers may attempt to defend the $0.168 level, the lack of follow-through on rebounds suggests this support is softening. A clean 4H close below $0.168 — especially on volume — would likely trigger stop-losses and lead to a swift drop toward $0.160 and then $0.152.
If you're looking to position with the bearish trend:
• A low-risk short entry could be placed on any failed bounce near $0.173–$0.175 (prior local supply zone).
• Ideal targets remain at $0.160 and $0.15285.
• Stop-loss can be positioned just above $0.177–$0.180, depending on your risk appetite.
Given the current structure, DOGE is making lower highs, testing support more frequently, and showing no bullish divergence in volume — all classic signs of a market preparing for a breakdown. Unless a sudden reversal in momentum occurs (which would require DOGE reclaiming at least $0.180), short setups are favored.
Dogecoin is dead, short it to zeroDead coin already RIP
Doge coin can't go any higher and had lost fame and momentum

Doge will dodge buyers ?Pattern Observed:
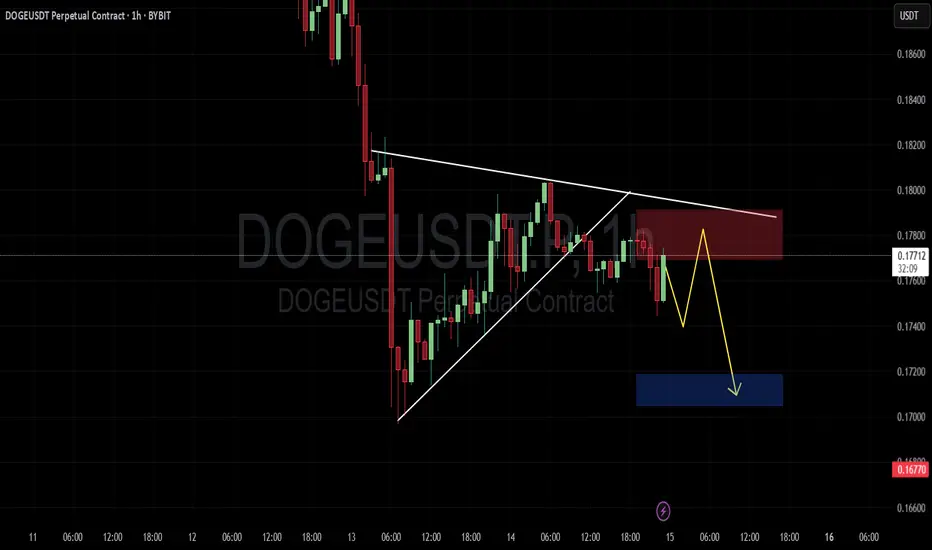
The chart shows a rising wedge that broke to the downside, a bearish continuation pattern.
Price attempted a retest to the wedge's base (marked in red zone), which aligns with lower highs — a strong sign of bearish rejection.
Key Zones:
Red Zone (Supply Zone / Resistance): Around 0.1775–0.1780
Acts as a bearish order block or supply area where price got rejected.
Blue Zone (Demand Zone / Bullish OB): Around 0.1705–0.1720
Anticipated target area where price might find support and possibly bounce.
DOGEUSDT 1D AnalysisDOGE ~ 1D Analysis
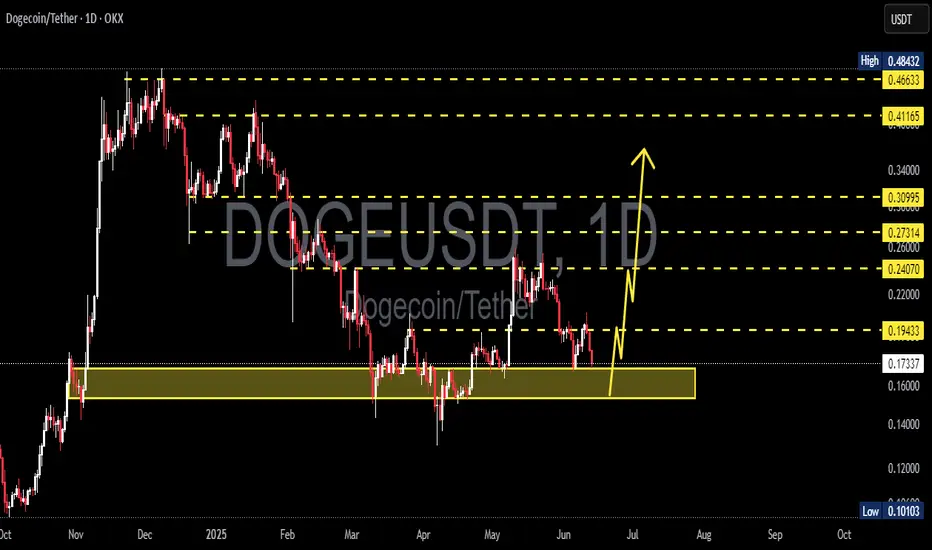
#DOGE Buy back gradually from here with a short term target of at least 15%+, Long term target $0.5
DOGE/USDTDogecoin is currently in a trading range and could enter a trend if it breaks the upper and lower lines. We'll have to wait and see what happens.
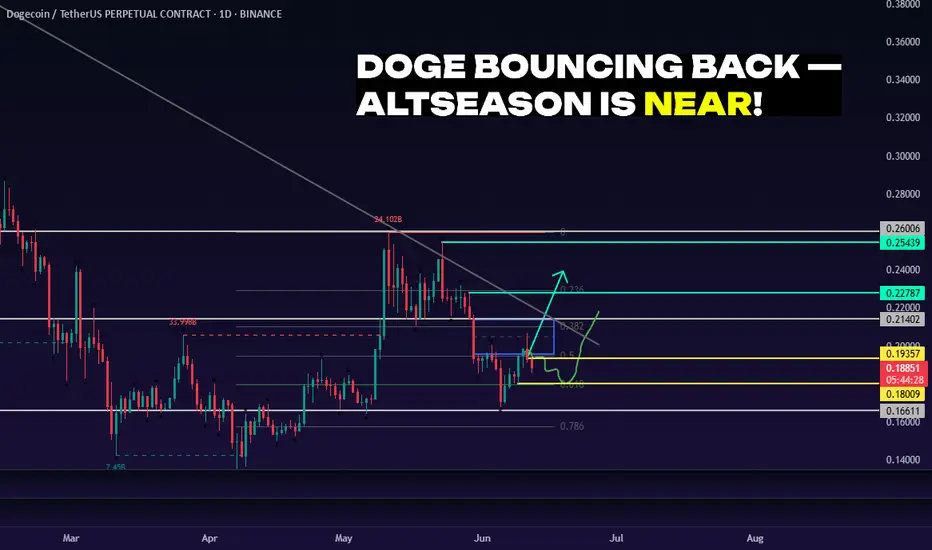
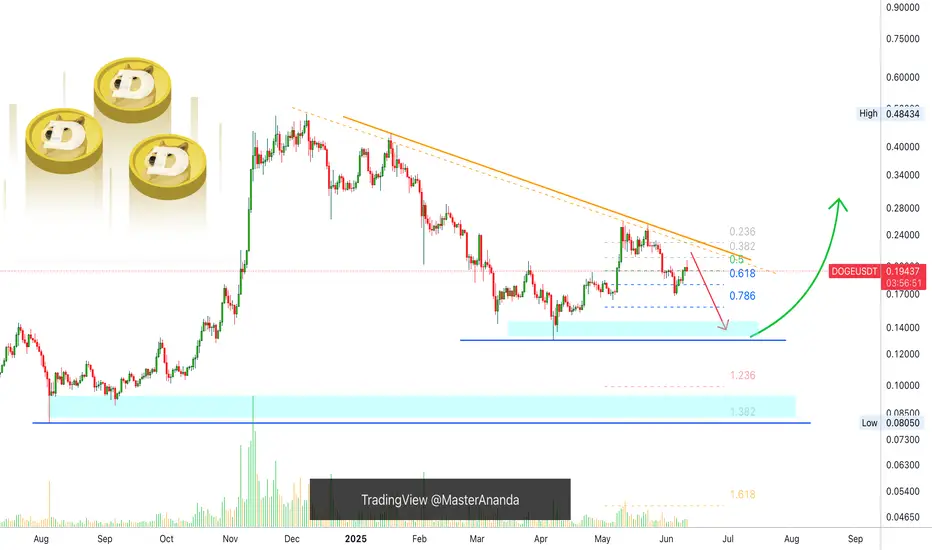
DOGE 1D: Missed PEPE? Don’t Miss DOGE 06/12/25BINANCE:DOGEUSDT
I’m expecting a continuation of the upward movement and a possible trend reversal.
There’s a chance we’ll revisit the 0.618 Fib level to shake out weak hands — a classic move before liftoff.
Looking at the chart, it really feels like altseason is closer than anyone expects. DOGE may lead the charge.
Entry Points (EP):
• Market
• $0.19357
• $0.18009
Take Profit (TP):
• $0.22787
• $0.25439
⚠️ My personal opinion only — not financial advice.
Do your own research and remember: all actions you take are your own responsibility. Practice solid risk management and avoid investing more than 2% of your total capital per trade.
DYOR.
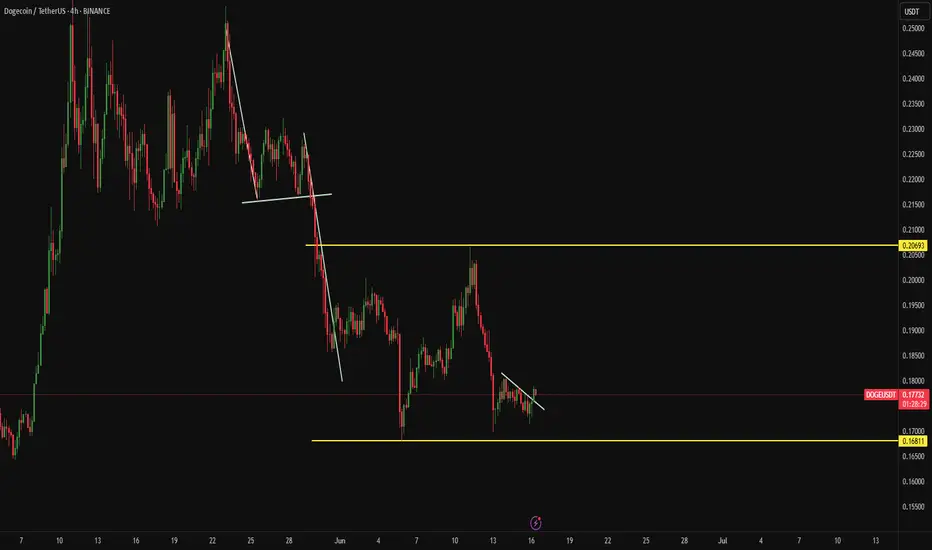
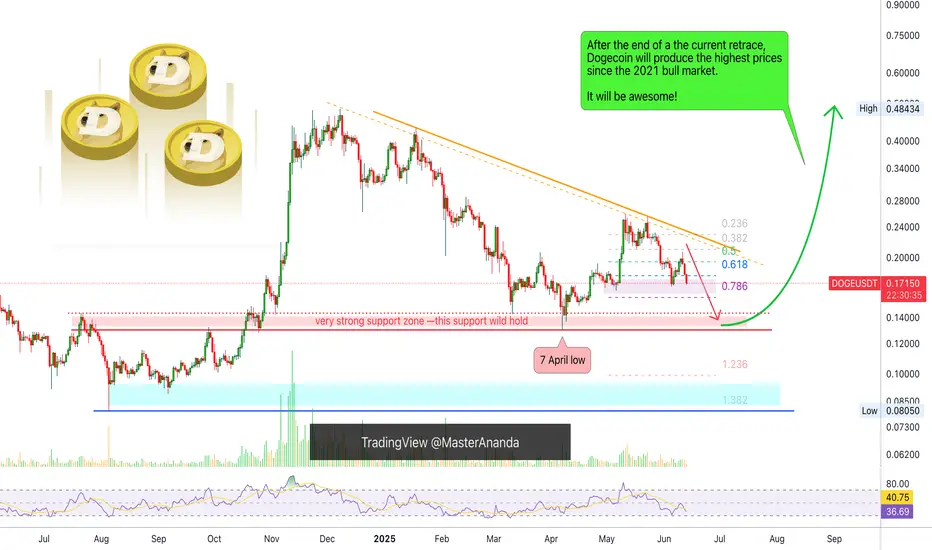
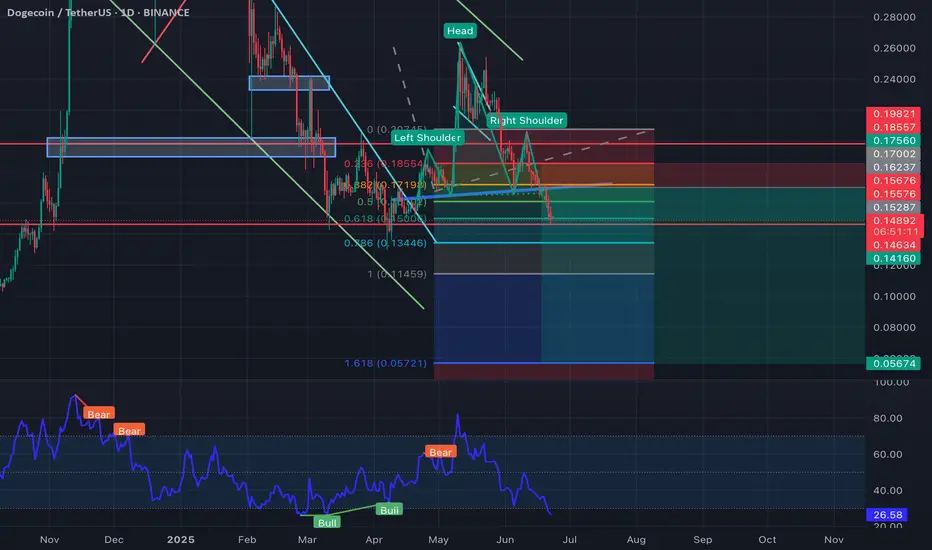
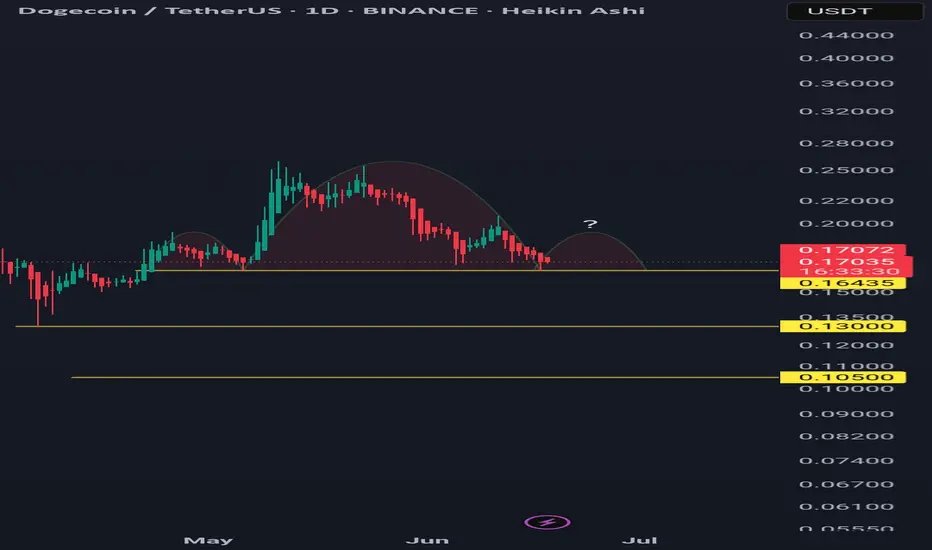
Dogecoin, How Far Down Can It Go? Support Confirmed!The retrace is on and Dogecoin is moving lower with a full red candle. The trading day just started and this is truly concerning. As soon as I saw what was happening, bearish momentum growing, I wondered, will the last low (7-April) break or hold?
That's the question I will try to answer.
Since we already looked at the candles and chart structure (lower highs), I looked at the RSI to try and find some clues. Sure, the RSI is already bearish and became really weak 5-June. This is a positive signal because we are looking for signs of a reversal.
Once the RSI becomes weak it immediately starts to turn and the change happens first on the RSI and later the price. This is how you end up with a bullish or bearish divergence on the chart.
For the 7-April low to break, the RSI would have to go into extreme levels, ultra-weak/oversold, but this isn't likely, which means that there is a good chance that the 7-April low will hold.
A support zone is already being tested now which is the 0.618-0.786 Fib. retracement in relation to the April-May wave. While this is a weak support because it is based on the short-term, it is still a support zone and lots of bearish ammunition will be consumed here.
The 7-April low was a peak in September 2024 and also a bigger range from July 2024 (resistance turned support). In October 2024 this level was broken and tested one last time as support before the last bullish wave Dogecoin produced leading to a multi-year high.
In November 2024 again this level was tested on a wick and held nicely.
All in all, this means that we are likely to end with a higher low because this is a very strong support zone. I made it red on the chart.
If the action does move lower, it should only do so briefly on a candle wick. If you are lucky enough to be around when this takes place, you can go all-in at this point and you will be sitting on a great position for the next bullish wave.
Namaste.
$DOGE Inverse head & shoulder pattern formingWe can see that CRYPTOCAP:DOGE is currently forming an inverse h&s best visible on the 4 hour timeframe. If the local FVG manages to hold then we could see a nice push up to external liquidity.
Good luck traders!
Kieza Tradez
Waiting DOGE to hit ATHDoge is showing reversal signs. My first target is ATH (all-time high), which is just 163% away. The next goal is at least a 3x from there. Right now, we're in the weekly overbought zone (OB). If we break through it, the idea is invalidated.
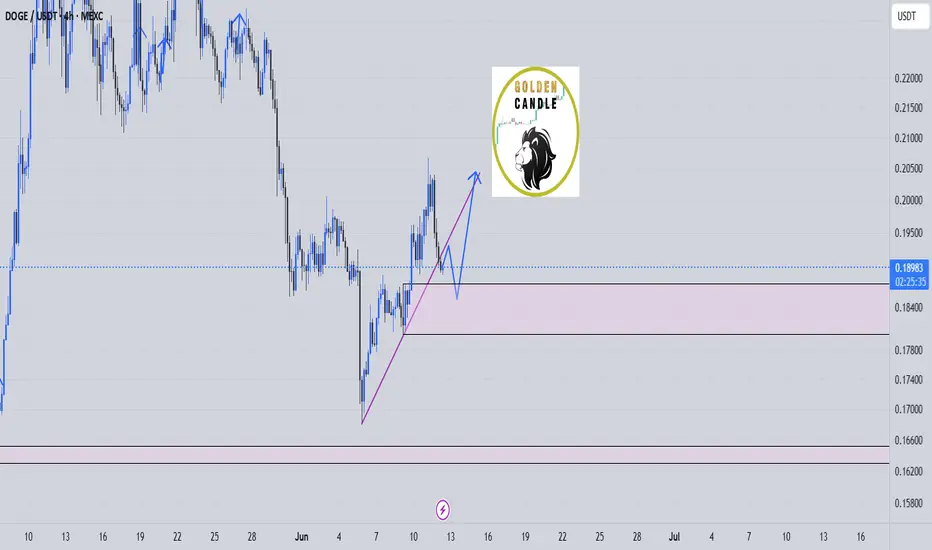
doge buy long term "🌟 Welcome to Golden Candle! 🌟
We're a team of 📈 passionate traders 📉 who love sharing our 🔍 technical analysis insights 🔎 with the TradingView community. 🌎
Our goal is to provide 💡 valuable perspectives 💡 on market trends and patterns, but 🚫 please note that our analyses are not intended as buy or sell recommendations. 🚫
Instead, they reflect our own 💭 personal attitudes and thoughts. 💭
Follow along and 📚 learn 📚 from our analyses! 📊💡"
DOGE NEED A MIRACLE RIGHT NOW!!Hello again everyone, this is my first post again a while..
I want to share my prediction again about CRYPTOCAP:DOGE this week, because there is a lot of negative sentiment right now.. my point of view, there is too much pressure to sell alt coins.. not only CRYPTOCAP:DOGE but another alt coin in bearish right now..
There only a few coins, that I can suggest to you all.. First coins is CRYPTOCAP:BNB and $BTC.. that's all what I thought.. Good luck everyone..
DYOR!!
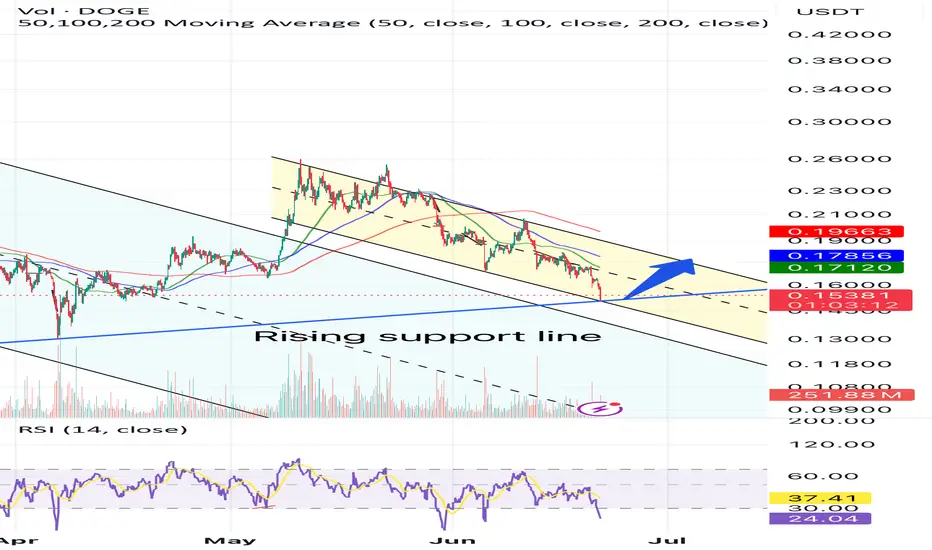
A time for a rebound? Doge just hit the bottom of the yellow descending channel and a rising blue support line.
Will the doge rebound to the upper channel area in coming days?
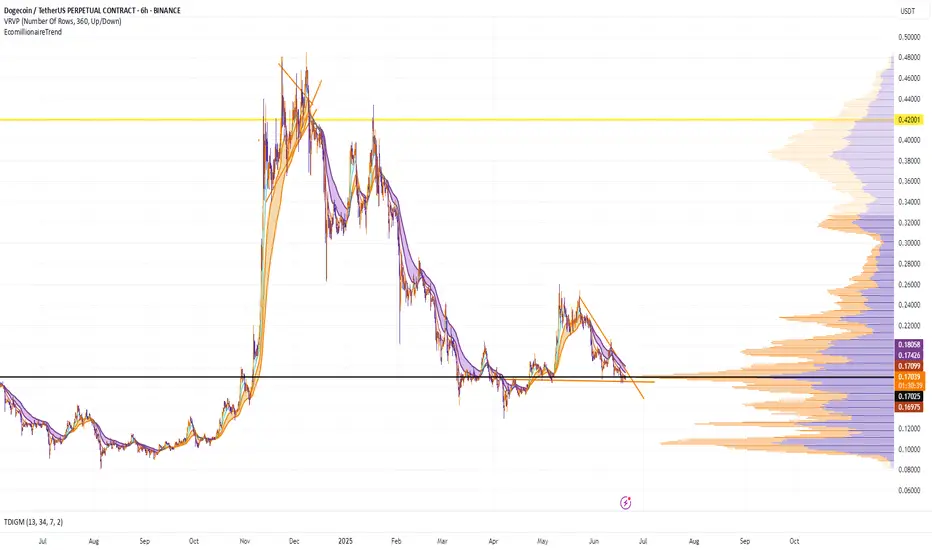
DOGE - At heavy volume rangeDOGE - At heavy volume range!
DOGE is at the heavy volume range on VRVP.
Great time to buy IMO.
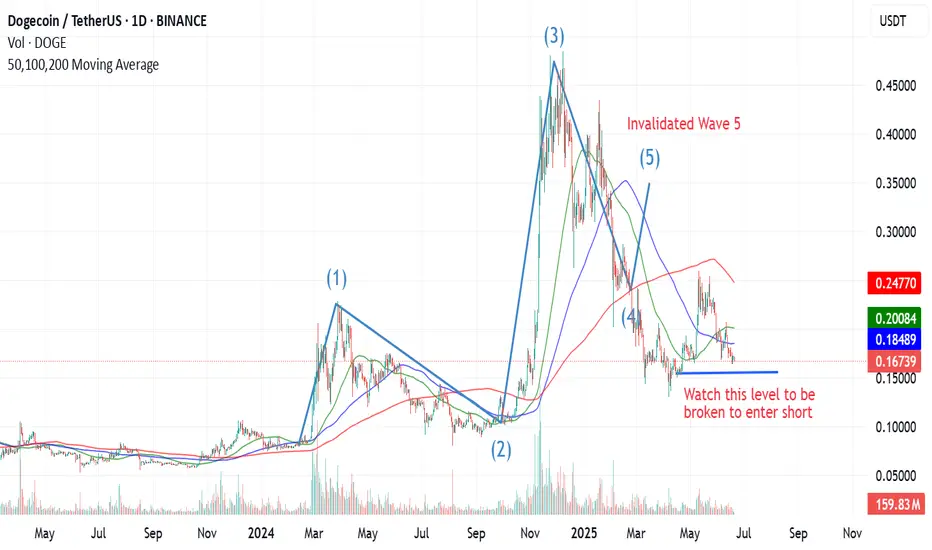
Elliot Wave Analysis for Doge - Bearish TrendLets analyse Doge on 1D timeframe since Feb 2024.
Wave 1 - It reached a high of 0.23 from a bottom price range of 0.084.
Wave 2 - Corrective wave take the prices back to 0.08 in Aug - Sep 24.
Wave 3 - As per theory should be the strongest and it proved to be one, taking the price to 4 year high of 0.4843.
Till now everything was fine and the next corrective Wave 4 started which as per classical Elliott Wave theory, should never enter the price territory of Wave 1.
Wave 1 high was 0.2288 however if we see the current price 0.168 (Wave 4), it already has invalidated the previous wave.
So now if we re-evaluate -
The run from 0.084 to 0.4843 was a Zigzag A-B-C Pattern with A marking as 0.2288, B as 0.08 and C = 0.4843. So seems we are in a complex correction phase and can see prices move down to previous lows or even lower.
So for now be patient and watch the prices between $0.168–0.182, if it reclaims $0.228–0.245, then we can consider entering a Long.
A breakdown below 0.154 can cause a lot of trouble for Bulls.
Trade Safely!
Thanks!
Where Most See Resistance, Smart Money Sees OpportunityDOGE is currently hovering around the 0.382–0.5 Fibonacci retracement zone after a reactive bounce from 0.618 (0.16784) — a critical discount level. Most traders panic at these levels, but experienced participants know this is the zone where price builds intention.
Here's the breakdown of the structure:
Price tapped into the 0.618 Fibonacci level (0.16784) and began showing signs of recovery — a typical Smart Money accumulation zone.
The next target is 0.17042, aligning with the 0.236 retracement level, followed by 0.17151, where previous supply might get mitigated.
Potential retracements are possible, but as long as price holds above 0.16670 (0.786), the bullish structure remains intact.
Execution strategy:
Entry (Accumulation Zone): Between 0.16784 and 0.16864
Invalidation: Break below 0.16600 would weaken the bullish case
Upside targets:
• TP1 → 0.17042
• TP2 → 0.17151
• Extension possibility beyond 0.17204
This move appears to be a classic premium-delivery setup — a structural reset, not a collapse. Smart Money steps in quietly when retail panic takes over. If you're trading DOGE like a pro, focus on levels, not emotions.
Let me know if you'd like this converted into a tweet format or turned into a technical newsletter paragraph.

Dogeusdt, daily time frame starting to look bearishStarting to form a bearish pattern in daily time frame, still not complete/confirm.
Trading below 100 daily ma.
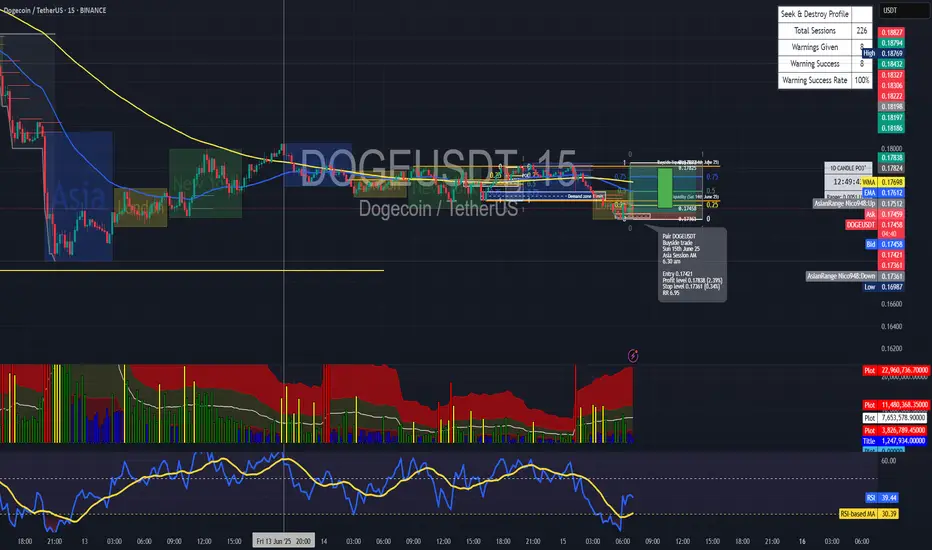
Long trade
🟢 DOGEUSDT – Buyside Trade
Date: Sunday, 15th June 2025
Session: Asia Session AM
Time: 6:30 AM
Entry Timeframe: 15min TF
Trade Parameters
Entry: 0.17421
Take Profit: 0.17838 (+2.39%)
Stop Loss: 0.17361 (−0.34%)
Risk-Reward Ratio (RR): 6.95
🧠 Trade Reasoning (Buyside)
DOGEUSDT printed a bullish market structure shift during the early Asia session after a sweep of short-term liquidity beneath the 0.17360 level.
doge coin targetsBased on the blocks formed and the trend of Dogecoin. The trend of Dogecoin in the coming days and possible targets are shown in the image. Follow me to be informed of new analyses.

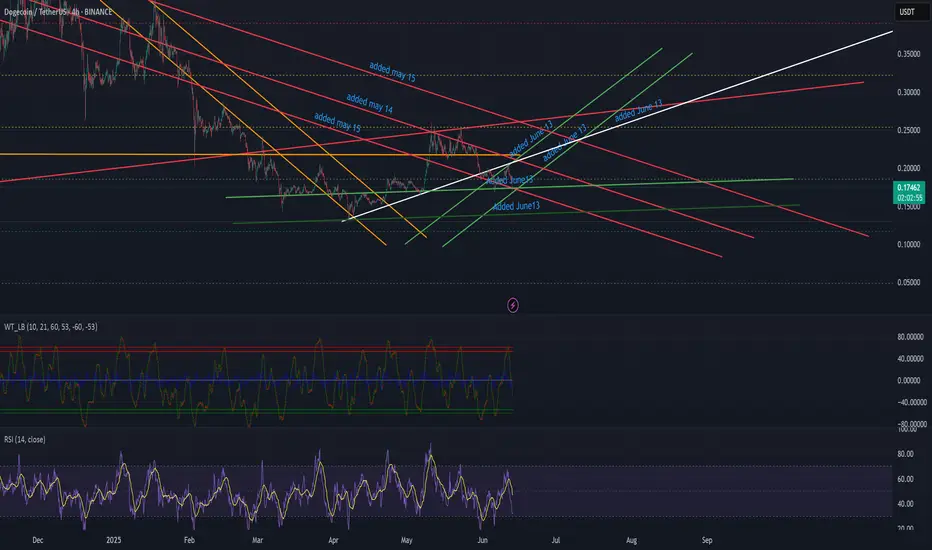
DogeHere is the possibility that i have drew up for the wave.
Horizontal ish dark and light green, buy marks/area
white is the gradual loop around rise
the light green up parrallel is boost growth.
i dont claim to know anything and am just seeing what i hit. along with sharing what my hailmary might be.
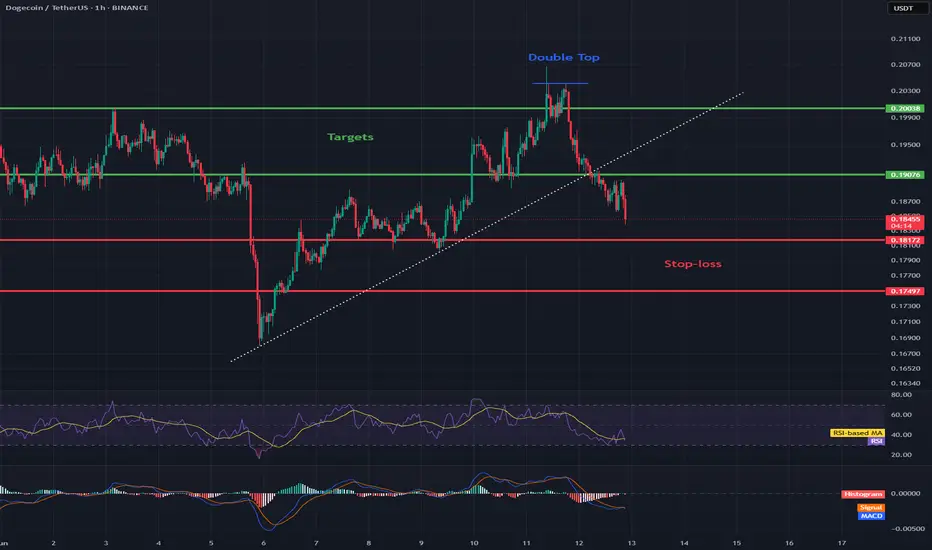
DOGE/USD 1H Short-term1. General situation on the chart
Trend: The last few dozen candles show a sideways movement with a stronger upward impulse, which was quickly corrected. We are currently seeing declines after the previous upward wave.
Current price: Approx. 0.1847 USDT.
Last structure: After the upward movement (peak around 0.205), the price dropped quite a bit, now consolidating below 0.19.
2. Formations and structures
Formation:
No clear classic formation (e.g. head-and-shoulders, triangle, flags) on the last candles.
However, something like a local peak ("double top") is visible around 0.203–0.205 — the price touched these areas twice and fell off, which suggests that this is a strong resistance.
Support and resistance:
Support: 0.1800–0.1820 — here is the last local low and the area where the price stopped before the previous upward movement.
Next support: 0.1740–0.1750 — the next low from the previous movements.
Resistance: 0.1900–0.1910 — here was the last consolidation, and then a sharp decline.
Strong resistance: 0.2030–0.2050 (recent highs).
3. Indicators
RSI:
RSI value close to 40 and is heading slightly down, but it is not oversold yet. This may suggest that there is potentially room for further decline.
MACD:
Histogram below the 0 line, MACD line below the signal, the bearish signal is still maintained.
4. Signals and potential scenarios
Base scenario (downside):
If the price breaks below 0.1820, the next target is around 0.1750.
Stop loss in this scenario: above the last resistance, e.g. 0.1910.
Alternative scenario (rebound):
If the price does not break 0.1820, and a demand reaction occurs - we may see an attempt to return to 0.1900, or even to the peaks in the area of 0.2000–0.2050.
Stop loss below 0.1800 (in the case of a long play).
5. Potential targets (by price action):
Short:
TP1: 0.1820 (nearest support, you can take some profit)
TP2: 0.1750 (next low, main target)
Long:
TP1: 0.1900 (nearest resistance)
TP2: 0.2000–0.2050 (highs, if the movement is strong)
Summary
Currently, the chart suggests a bearish scenario.
This is confirmed by the candlestick pattern, negative dynamics and indicators (RSI, MACD).
Key level to watch: 0.1820 – if it falls, we will probably go down to 0.1750.
If there is strong demand for 0.1820, a rebound to 0.19+ is possible.
Dogecoin Bearish But...Yes, Dogecoin is bearish now but this is only a short-term situation, it is the end of a long-term correction. Notice the chart, Dogecoin has been producing lower highs long-term, since December 2024.
Recently, there was a major low in April and then a recovery and after this recovery we have local lower highs. The current drop is the continuation of the retrace that started 11-May. This retrace should end soon, within weeks or just a few days.
As soon as the low settles, we can enter the market bullish again. If you trade spot, simply wait. Day traders can easily SHORT but the range is short, after a small drop cover and switch back to LONG. Experts only.
That's the scenario. We are very likely to get a higher low compared to 7-April. If too many leveraged positions are open though and the market wants to remove those, there can be a long wick that pierces support for the action to recover the next day.
So, the drop can be fast, can be small, can be hard, can be easy or it can be short, it doesn't matter, once it is over, Dogecoin will continue to grow.
Patience is key.
Thanks a lot for your continued support.
Namaste.
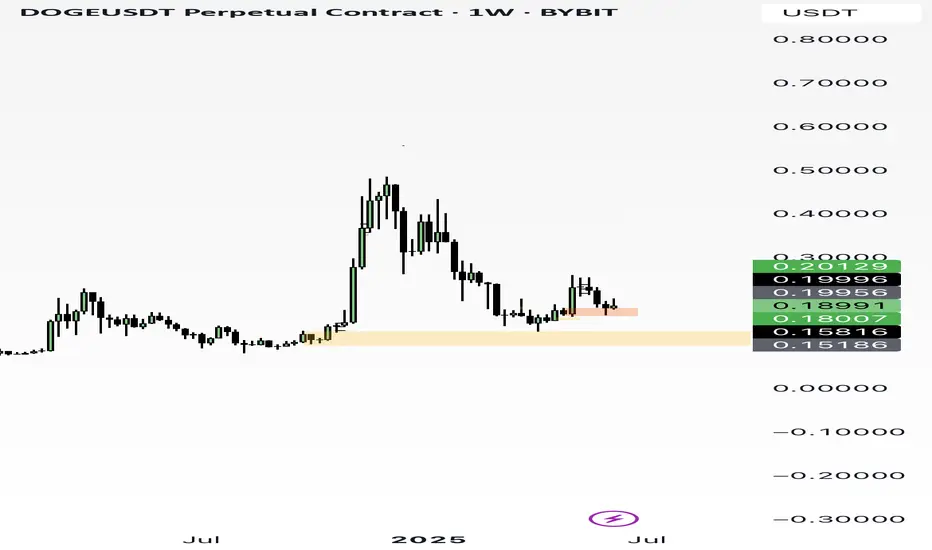
Technical Analysis for Dogecoin (DOGE/USDT) – Daily Chart
🔍 Current Price Action:
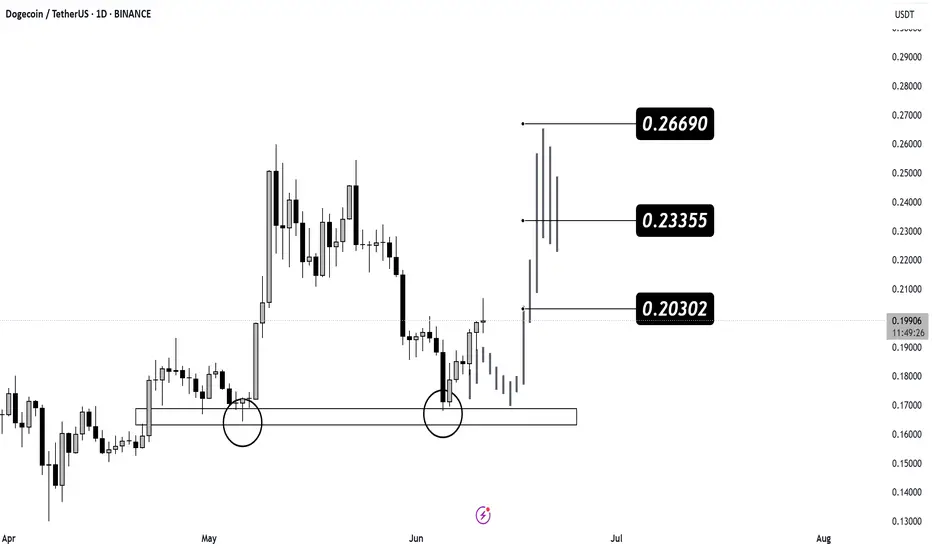
Current Price: 0.19892 USDT
The price is reacting positively from a key support zone (highlighted with circles), indicating a strong bounce and potential for upward continuation.
📈 Target Resistance Levels:
0.20302 USDT – First short-term resistance, may be tested soon.
0.23355 USDT – Intermediate resistance; a key breakout level.
0.26690 USDT – Major resistance; target if momentum remains strong.
🧠 Technical Insights:
Pattern Observation: A double bottom-type reaction from support suggests bullish reversal.
Projected Gray Candles: Show a potential bullish scenario toward the next resistances.
Trend Outlook: Bullish bias remains as long as the price holds above the 0.185 area.
✅ Strategy Suggestion:
Entry Zone: Between 0.195 – 0.200 USDT (after confirmation of support hold)
Take Profits:
Target 1: 0.203
Target 2: 0.233
Target 3: 0.266
Stop Loss: Below 0.180 (to protect against failed support)
📌 Summary:
A strong bounce from a confirmed support zone gives DOGE potential for a continued rally toward 0.23–0.26 if the current momentum is maintained.