DOGE Setup Heating Up: These Levels Could Define the Next Move!Prediction for the Period Ahead (Next 1–2 Weeks):
*Base case: Holding support at $0.198–$0.200 → test $0.215.
*Bull trigger: Break above $0.215 with volume → possible move to $0.232 and higher.
*Downside risk: Falling below $0.182 could drag the price to $0.175 before any recovery.
DOGE is currently consolidating in a tight range with a neutral to slightly bearish technical bias. However, a breakout above $0.215, particularly supported by volume, could set the stage for further gains targeting $0.232–$0.287 zone. Conversely, a downturn past $0.182 opens the risk of a deeper test toward $0.175. In either scenario, the upcoming weeks seem pivotal...
DOGEUSDT.3S trade ideas
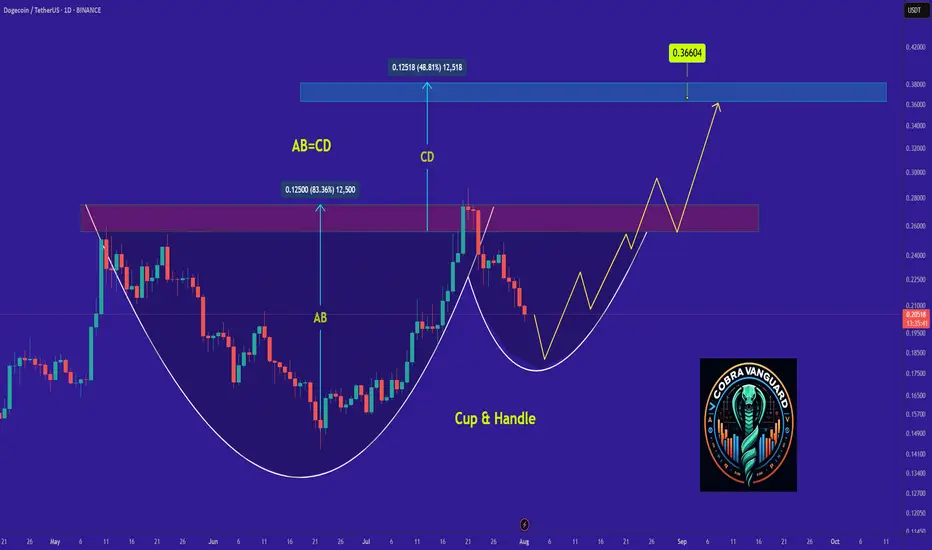
Why DOGE Remains Bullish and Its Next Potential Move !It appears that the price is forming a cup and handle pattern, and if this occurs, it could push the price above $0.30.
Best regards CobraVanguard.💚
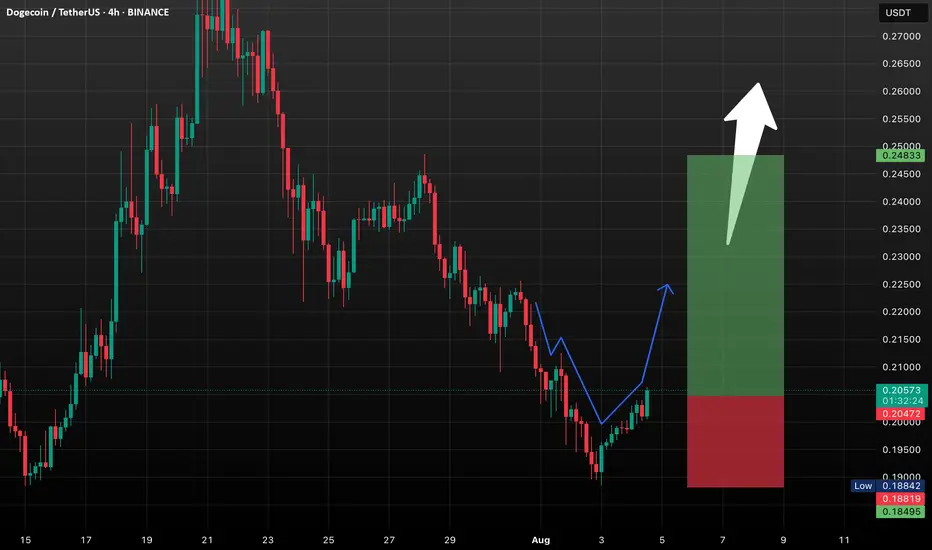
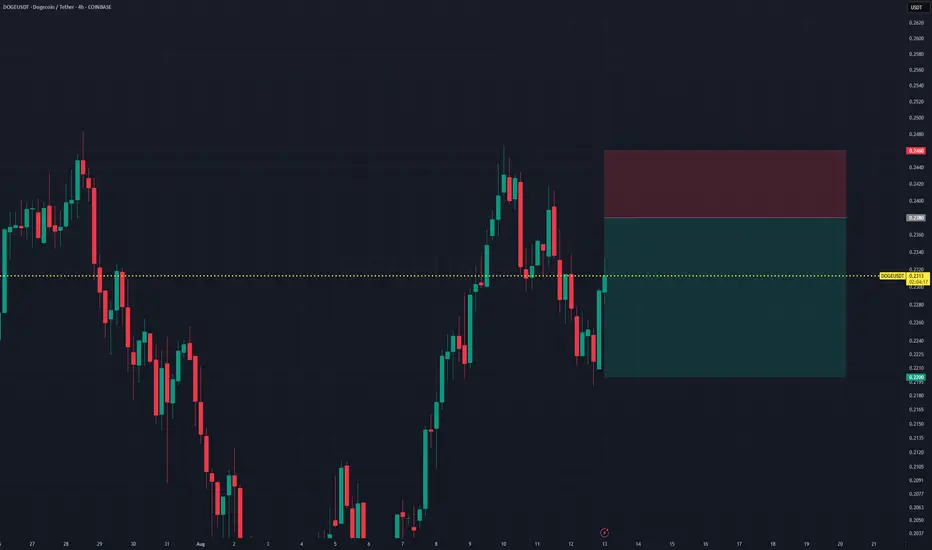
DOGE | 3D PlanPrice broke down instead of sweeping the range, leaving a new set of equal lows as liquidity targets. Structure now favors a patience play.
Triggers for action:
Monthly reclaim: Bullish trigger — reclaiming the M level signals strength, opens path for a trend reversal.
Sweep of equal lows: If price dips and runs the new set of equal lows (gray box), look for signs of absorption or reversal for a long setup.
No trade in the middle—waiting for either a proper liquidity sweep or a confirmed reclaim of the major level.

DOGE dumping will end soon.DOGE has been moving within the ascending channel. After hitting the upper resistant level of the channel, it has been dumping since then. Currently heading down to the bottom of the channel. Price Target $0.16-0.165

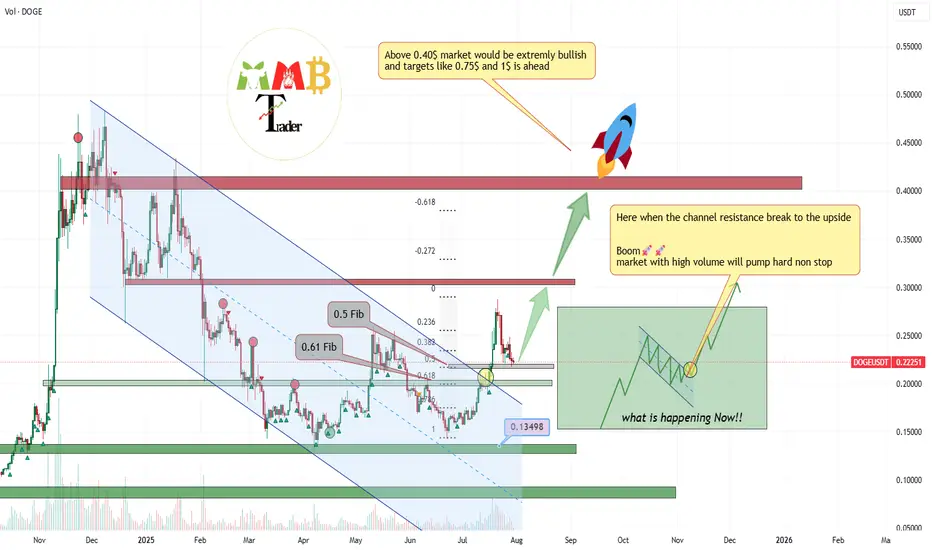
Those daily +20% to +30% candles soon will appear!!Those Fibonacci levels which are last supports for healthy & #Bullish market are all touching i mean the 0.218$(0.5 #Fibonacci) & 0.202(0.61 #Fibonacci) and i think these supports are strong enough to stop the correction and soon again it will pump and even can break daily high near 0.42$ and hit targets like 0.5$ and 0.75$.
DISCLAIMER: ((trade based on your own decision))
<<press like👍 if you enjoy💚
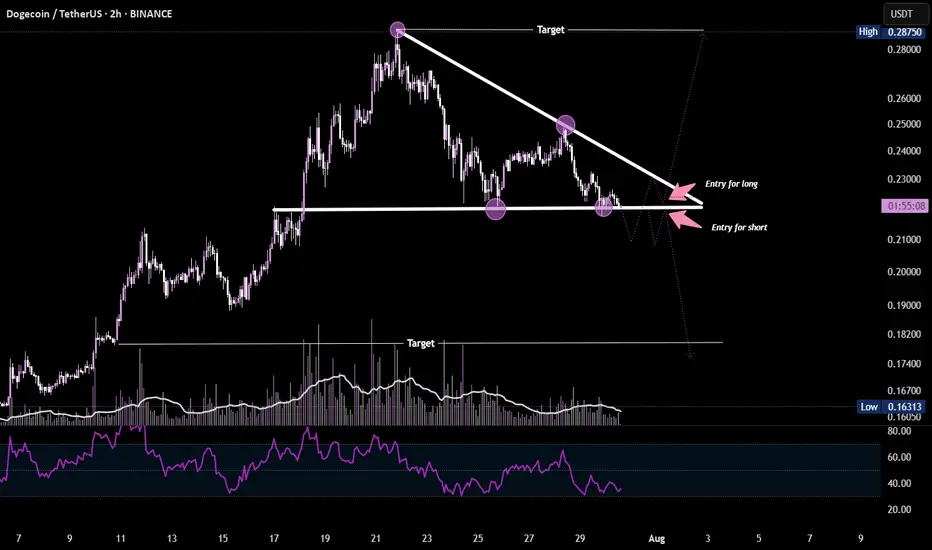
DOGE at Decision Point Dogecoin is forming a descending triangle pattern on the 2H chart, indicating a potential breakout setup.
A close above the resistance trendline ($0.23) could trigger a bullish move, while a breakdown below support ($0.215) may signal a bearish continuation. RSI and volume are suggesting weakening momentum — wait for confirmation before entering.
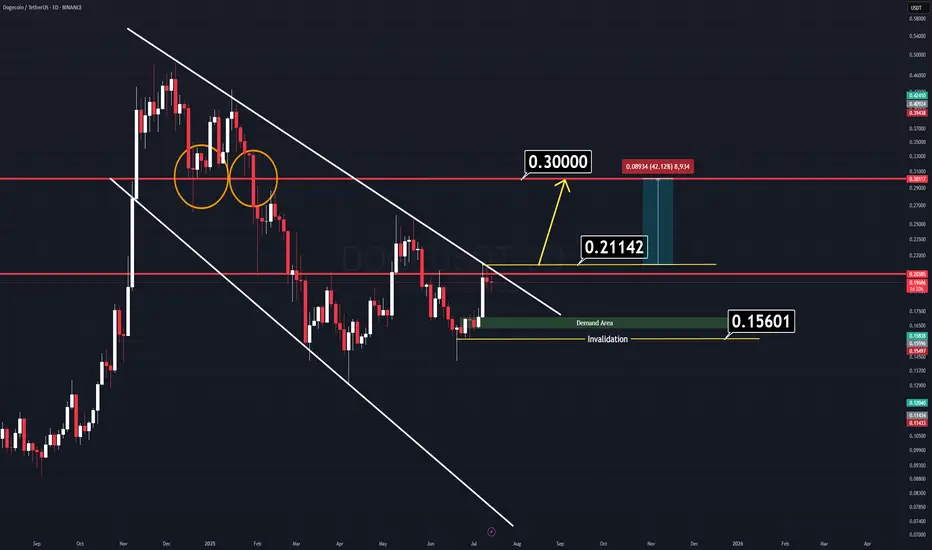
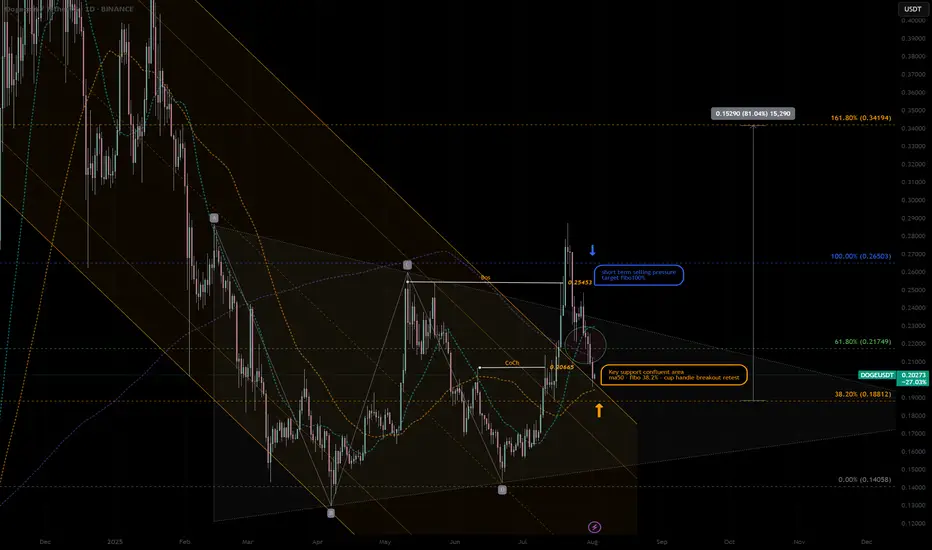
DOGE Analysis (3D)There’s a very simple and clear chart setup on Dogecoin (DOGE) right now.
We have two major horizontal key levels and a channel that is about to break down. If the price manages to close above the yellow-marked line ($0.21142), we can expect a strong rally to follow.
There’s no need for complicated indicators cluttering the screen — all relevant levels are clearly marked on the chart.
Two Logical Entry Approaches:
1️⃣ Breakout Entry: Enter on a confirmed breakout. (Waiting for a daily candle close on a memecoin might slightly reduce your profit range, but it’s the safer approach.)
2️⃣ Demand Zone Entry: Wait for the price to retrace to the green demand zone — though this scenario seems less likely for now.
A combined approach can work best: enter on breakout, use the horizontal levels as support, and set a tight stop-loss to manage risk.
Good Luck.
DOGEUSDT Analysis : Trendline Decision & Dual Directional Point📌 Market Context & Current Setup:
DOGEUSDT has been trading within a well-defined descending channel, respecting a strong trendline resistance, which has acted as a bearish ceiling for several sessions. The price action has been heavily influenced by supply zones formed after sharp impulsive drops, creating multiple QFL (Quick Flip Levels) — key to spotting structural bottoms and high-probability reversal zones.
Currently, the price is hovering near a critical decision point, where two key scenarios may play out:
A breakout and bullish reversal toward major resistance
A dip into a deep demand zone for final accumulation before reversal
Your plan reflects MMC (Market-Mind-Confirmation) methodology, preparing for either scenario with clear levels, logic, and psychology in place.
📐 Technical Breakdown:
🔻 1. Trendline Confirmation (Bearish Control):
The price has respected the downtrend line multiple times, confirming strong bearish momentum.
No candle body has closed decisively above it, showing sellers still have control.
However, price is now consolidating near this line, indicating a potential weakening of selling pressure — a classic sign of upcoming trend exhaustion.
🟩 2. Support Zones – Structural Layers:
📍 Minor Zone (S/R Flip – ~$0.215–0.220):
This zone is a previous support turned resistance.
It’s the first checkpoint the price needs to reclaim to confirm a breakout.
A successful flip from resistance back to support would add strong bullish confidence.
🟩 Reversal Zone (~$0.185–0.190):
Marked on your chart as a "Reversal Area" — likely derived from QFL methodology.
Price has historically bounced from this area, indicating buyers are willing to step in aggressively.
This zone aligns with smart money demand accumulation and could serve as a final liquidity sweep zone before a major reversal.
📍 Major Resistance Zone (~$0.250–0.260):
The next major objective once a trendline break is confirmed.
Also aligns with previous highs and volume nodes — a solid target for bullish trades.
🔄 Scenario-Based Strategy:
📈 Scenario 1 – Breakout Toward Major Resistance:
Price breaks above the descending trendline and reclaims the minor S/R zone.
This would confirm a bullish structure shift, validating that sellers are losing strength.
After reclaiming ~$0.215, the path toward $0.240–0.260 opens up.
Retests or flag breakouts within this range can be re-entry points for trend traders.
📉 Scenario 2 – Deeper Retest and Accumulation:
If the price fails to break out and dips further, the reversal demand area (~$0.185) becomes critical.
This is where buying pressure is expected to return, and as labeled in your chart:
👉 “If it goes down, we will double the supply”
This suggests an averaging-down or pyramiding strategy based on strong structural confidence.
This technique is valid only when the area is backed by solid confluence (trend exhaustion, demand, and past bounces).
🧠 MMC Strategy (Market – Mind – Confirmation):
Market: Bearish short-term trend, but price is approaching oversold territory near structural demand.
Mind: You’re prepared for both outcomes – breakout or dip. Emotion is out of the plan.
Confirmation: You wait for signs — break and retest of trendline, bullish engulfing candles, or wick rejections from demand.
This mental clarity helps maintain trading discipline and keeps emotional bias out of decision-making.
⚙️ Execution Plan:
Component Scenario 1 (Breakout) Scenario 2 (Deep Buy Zone)
Entry Signal Break & close above trendline + minor SR reclaim Bullish reversal candle within demand zone
Stop Loss Below trendline + S/R flip (~0.210) Below demand zone (~0.182)
Target 1 $0.235 $0.235
Target 2 $0.255–$0.260 $0.255–$0.260
Risk Level Medium Higher R:R potential
Strategy Notes Aggressive on confirmation only Add to position on wick traps
🧠 Trader Psychology Tips:
Be patient — confirmation beats prediction.
Set alerts at key levels to avoid emotional entries.
Scaling into trades based on zone reactions builds flexibility and control.
"Double the supply" approach must be paired with strict invalidation levels.
✅ Summary:
DOGE is trading within a descending wedge.
Key decision zones are marked clearly (trendline, S/R flip, reversal demand).
Breakout could lead to a quick 15–25% upside.
Reversal zone offers great R:R with accumulation opportunity.
Strategy is well-aligned with disciplined execution and trader psychology.

Lingrid | DOGEUSDT Pullback and Continuation OpportunityBINANCE:DOGEUSDT is currently testing the intersection of its upward channel support and a critical horizontal zone near 0.21378, after a steep corrective decline from the 0.28628 resistance area. The recent price action formed a rounded pullback, suggesting potential accumulation near trendline confluence. A bullish bounce here could trigger a strong rally toward 0.26350 as shown by the projected upward path. Failure to hold the 0.21000 area would expose the pair to deeper downside toward the 0.15706 support.
📌 Key Levels
Buy zone: 0.21000–0.21700
Buy trigger: Break and close above 0.23000
Target: 0.26350
Invalidation: Break below 0.21000
⚠️ Risks
Breakdown of ascending trendline support
Weak volume on upward breakout
Broader market weakness impacting altcoins
If this idea resonates with you or you have your own opinion, traders, hit the comments. I’m excited to read your thoughts!

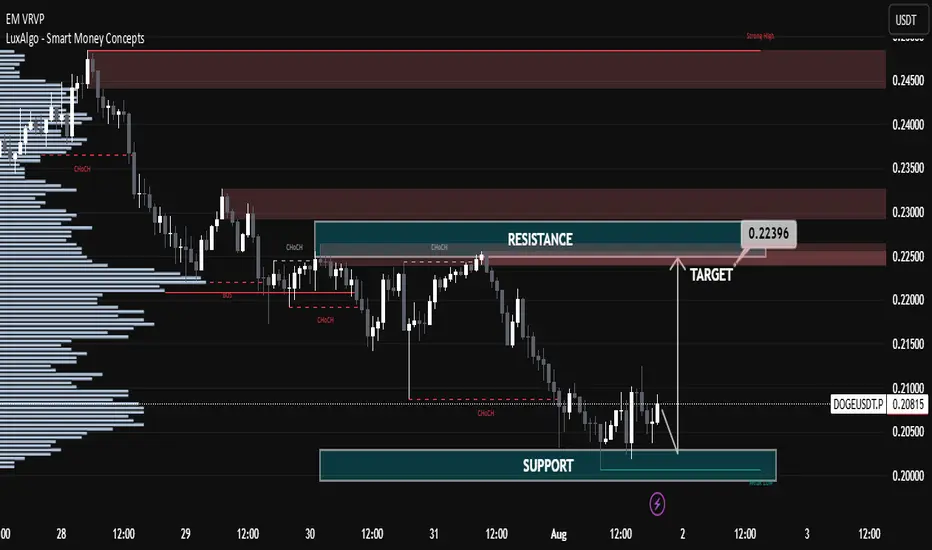
DOGEUSDT Technical Analysis – Bullish Reversal Anticipated DOGEUSDT Technical Analysis – Bullish Reversal Anticipated
🔍 Key Technical Zones:
Support Zone: $0.1990 – $0.2015
Strong bullish reactions noted from this level in previous attempts.
Confluence with volume accumulation on the left (as seen in the Volume Profile).
Signifies a strong demand zone where buyers are stepping in.
Resistance Zone / Target: $0.2220 – $0.2240
Previous structural high and supply zone.
Marked as the first major liquidity area.
Also aligns with imbalance and CHoCH (Change of Character), a common SMC concept.
🔄 Market Structure:
CHoCH (Change of Character) marked multiple times, indicating attempts by bulls to reclaim structure.
Recent price action shows accumulation near support.
Sideways consolidation suggests potential for a bullish breakout.
Liquidity sweep of recent lows could indicate that smart money is accumulating positions before a move higher.
🎯 Trade Setup Idea:
Entry Area: Between $0.2000 – $0.2060 (inside the support zone)
Target: $0.22396 (as marked)
Stop Loss: Below $0.1980 (below the visible support range)
🔧 Indicators and Tools Used:
Volume Profile (VRVP): Shows most volume traded around $0.205 – $0.207, indicating strong positioning from market participants.
Smart Money Concepts (SMC): CHoCH and liquidity concepts signal potential accumulation and reversal.
Price Action Analysis: Clean swing structure with support-resistance rotation visible.
📌 Conclusion:
DOGEUSDT is currently trading in a range-bound structure with a bullish bias from the support zone. If the price sustains above $0.205 and breaks above minor resistance, the upside target of $0.22396 is likely. This setup is supported by strong volume accumulation and smart money structure shifts.
Bears Target $0.14 DOGE — Is the Trend Your Friend?DOGEUSDT has been in a clear downtrend since late July, printing consistent lower highs and lower lows. The current market structure shows sellers firmly in control, with every bullish bounce quickly fading. The recent rejection near $0.2244 and the inability to sustain above the $0.21 zone highlight persistent selling pressure.
At the moment, DOGE is hovering around $0.2043, just under a short-term resistance band between $0.2067 and $0.2090. This area has acted as a rejection point in the last few sessions, suggesting that unless bulls can break above it with strong volume, the path of least resistance remains downward. Below, the first major support sits at $0.1855. If that breaks, the selling could accelerate toward $0.1680, a level that aligns with a previous consolidation base from June. In an extended decline, $0.1427 comes into view as a long-term support level that previously acted as a strong demand zone.
The chart also shows an active short trade setup in play:
• Entry: $0.2043
• Stop-Loss: $0.2244
• Targets: TP1 at $0.1855, TP2 at $0.1680, and TP3 at $0.1427
From a risk-reward perspective, this setup remains attractive, especially if the price breaks below $0.1855. However, traders should watch for any bullish invalidation signs — a close above $0.2136 could challenge the short bias, while a sustained break above $0.2244 would signal a possible trend shift. Until then, the broader technical picture still favors the bears.
DOGE (Y25.P3.E1). More lows to come before a longHi traders,
My thoughts on taking a short trade on Doge
why?
confluence on … 200 D ema, Avwap , previous support, etc
All the best,
S.SAri.
DOGE/USDT Trade Idea – Potential Cup & Handle Pattern Timeframe: Technical Analysis:
Price rallied from 0.142 to 0.287 and is currently forming the handle of a potential cup & handle pattern.
Price is sitting at the key 0.618 Fibonacci retracement level (0.198 USDT).
If this support holds and price breaks above resistance levels with strong volume, the cup & handle pattern may activate.
---
🎯 Targets:
1. First resistance: 0.215 USDT (50% Fib)
2. Second resistance: 0.232 USDT (38% Fib)
3. Key breakout level: 0.287 USDT
4. Classic pattern target: 0.432 USDT
---
🛡 Stop Loss:
Below 0.170 USDT (slightly under the 0.786 Fib & handle bottom)
---
✅ Entry Confirmation Criteria:
1. Hold above 0.198 support
2. Break and close above 0.215
3. Breakout above 0.287 with strong volume
---
💡 This analysis is for educational purposes only and is not financial advice. Always use proper risk management.

DOGEUSDT|Pullback Confluent Support -cup&handle next ext. +80%DOGE - retraced at the confluent support zone, high potential pullback buy position:
- SMA50 Dynamic support—often attracts mean-reversion buys.
- cup & handle support retest Price retested prior breakout zone—flips resistance to support.
- key 38% Fib “sweet spot” pullback level after corrective moves.
- Previous Change of Character marks shift from bearish to bullish structure—support confluence.
Potential Entry & Risk Management
Entry Zone
- Aggressive: immediate handle breakout support
- Conservative: Wait for liquidity pattern and re-bounce confirmation candle above SMA50
Stop-Loss
-Below Cup Handle low -10% larger position prior swing high RR:2.5/1
-Suggested SL: previous low -0.17 USDT - 5% below entry
Initial Targets
-Key resistance 61.8% Fib retracement — 0.217 USD
-100% Prior swing high — 0.26 USD
-162% Next extended target - 0.35 USD
Trade Rationale
-Mean-reversion into SMA50 and Fib 38.2% zone aligns multiple buyers.
-Pattern support: Cup & handle retest confirms breakout strength.
-Structure flip: CoCh zone indicates bullish regime shift.
Watch-Outs
-Rejection below 0.188 USD erodes support cluster—invalidates setup.
-Rising volume on bounce is crucial—low-volume lifts often fail.
-Beware broader market sell-offs impacting altcoins.
Next Steps:
-Monitor 4-hour candlestick close inside entry zone.
-Check volume spike on reversal candle.
-Adjust risk dynamically if price gravitates toward upper channel resistance.
Always trade with affordable risk and respect your stop..
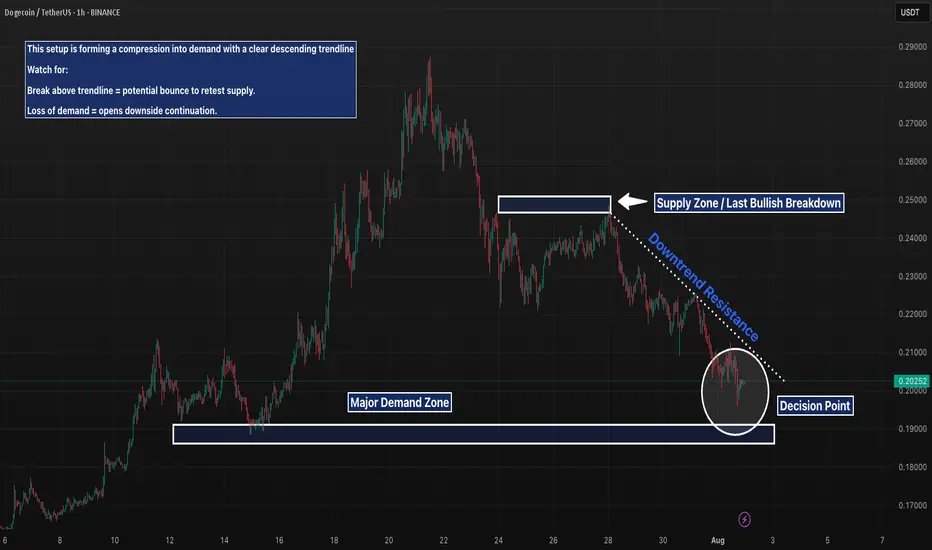
DOGE 1H – Descending Into Demand, But Will Buyers Step Up Again?DOGE is approaching a key inflection point after a clean rejection from the previous supply zone (~0.23) and consistent lower highs. The descending trendline has acted as dynamic resistance, compressing price into a major demand zone that previously triggered a strong rally. If bulls step in here, we could see a breakout and retest of the overhead supply. However, failure to hold this zone opens up potential for a deeper move toward the mid-$0.18s.
📌 Key Levels:
– Resistance: 0.23 (supply zone)
– Support: 0.19 (demand zone)
– Structure: Lower highs into horizontal demand = potential spring or breakdown.
This is a classic make-or-break structure — momentum and volume will reveal the winner.
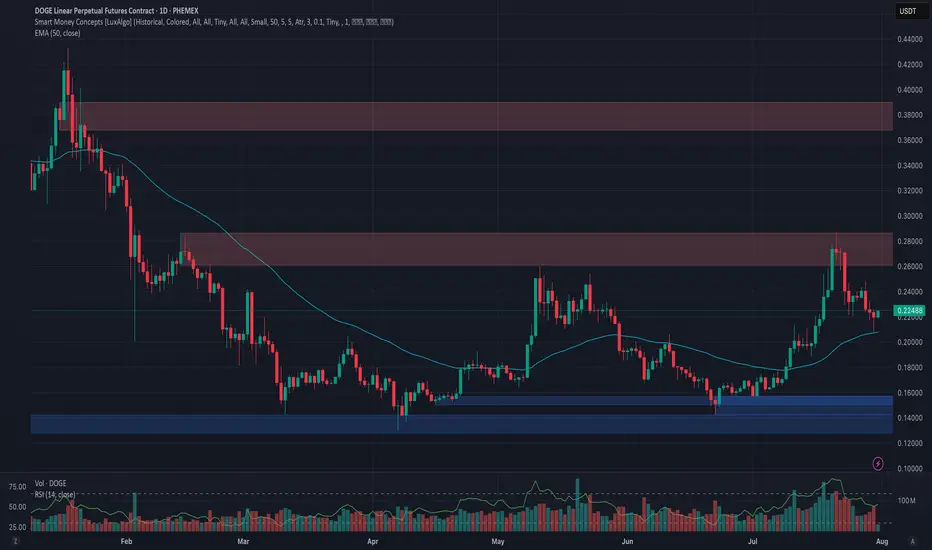
Phemex Analysis #101: Is Dogecoin (DOGE) Ready to Moon Again?Dogecoin ( PHEMEX:DOGEUSDT.P ), the original meme cryptocurrency, is once again capturing investor attention, fueled by impressive bullish movements. Currently trading around $0.2245, DOGE surged approximately 70% in July, decisively breaking the key resistance at $0.22 and challenging the next resistance level near $0.28.
With whale accumulation intensifying, renewed retail investor enthusiasm, and heightened speculation surrounding possible ETF approvals, Dogecoin appears poised to potentially sustain or even amplify its recent gains. But the key question remains: is DOGE truly ready to moon again, or is caution necessary following such rapid price movement?
Let’s carefully explore a few potential scenarios to inform your trading strategies:
Possible Scenarios
1. Bullish Continuation—Targeting Higher Levels
After successfully breaking above the crucial $0.22 resistance, Dogecoin could maintain its upward momentum if buying pressure remains strong. In this bullish scenario, DOGE might swiftly retest the immediate resistance at $0.25, then target higher levels near $0.28, and potentially surge toward the significant resistance at $0.39.
Pro Tips:
Entry Signals: Watch for a confirmed breakout above $0.25, especially if accompanied by rising trading volume, as a potential bullish entry point.
Profit-Taking: Strategically secure partial profits at resistance zones around $0.28 and $0.39.
Risk Management: Implement tight stop-loss orders just below the key support at $0.20 to guard against unexpected reversals.
2. Retest and Accumulation—Neutral Scenario
Given DOGE’s rapid price rise, a short-term pullback towards previous resistance-turned-support at $0.22 or even $0.20 is plausible. Such retracements, particularly on decreasing volume, might signal healthy consolidation, setting the stage for future bullish momentum.
Pro Tips:
Buying Opportunities: Look to accumulate DOGE if a low-volume pullback occurs toward support zones around $0.22 or $0.20.
Monitor Volume: Observe closely for decreasing trading volume during retracements, which typically indicates positive consolidation rather than a bearish reversal.
3. Bearish Scenario—Deeper Correction Possible
Should overall market sentiment shift negatively or DOGE fail to hold crucial support at $0.22, bearish pressure could escalate, potentially pushing Dogecoin down to deeper support levels around $0.198, and possibly as low as $0.15 or $0.13.
Pro Tips:
Risk Management: Consider reducing or exiting positions if DOGE decisively breaks below $0.22 on increased selling volume.
Long-Term Accumulation: Long-term holders may strategically accumulate DOGE at historically strong support levels ($0.15 or $0.13) once price stabilization occurs.
Conclusion
Dogecoin (DOGE) stands at a pivotal point, balancing bullish enthusiasm against the possibility of a correction. Traders should carefully monitor resistance at $0.25, the critical support at $0.22, and closely observe volume dynamics. By strategically aligning their trades with these outlined scenarios and employing disciplined risk management, traders can confidently navigate DOGE’s volatility and potentially capitalize on its next significant move.
🔥 Tips:
Armed Your Trading Arsenal with advanced tools like multiple watchlists, basket orders, and real-time strategy adjustments at Phemex. Our USDT-based scaled orders give you precise control over your risk, while iceberg orders provide stealthy execution.
Disclaimer: This is NOT financial or investment advice. Please conduct your own research (DYOR). Phemex is not responsible, directly or indirectly, for any damage or loss incurred or claimed to be caused by or in association with the use of or reliance on any content, goods, or services mentioned in this article.
DOGEUSD : Short-term longHere is the DOGEUSD level, which is likely to rebound on small timeframes. Those who trade intraday may wish to pay attention to it.
It will also be possible to look for a good long position from this level after volume has been accumulated on it.

DOGEUSDT Bearish Reversal Setup From Resistance Area(AI) Trade Setup Analysis
Timeframe: 1D (Daily)
Position Type: Short (Sell)
Entry Point: 0.2380
Positioned exactly between the stop loss and take profit zones, providing a balanced short entry from a key resistance level.
Stop Loss (SL): 0.2460
Placed above the resistance zone to protect against a bullish breakout. Risk is approximately +3.36% from entry.
Take Profit (TP): 0.2200
Target set at a significant support area, offering a potential downside of around -7.56% from entry.
Risk/Reward Ratio: 2.25
A moderate but favorable setup with more than double the reward compared to the risk.
Technical Outlook:
DOGEUSDT is approaching a resistance zone after a short-term bounce. This area could act as a ceiling, potentially triggering a retracement toward the $0.2200 support.
Bearish Scenario: Rejection at 0.2380 could open the way for a move toward the 0.2200 target.
Bullish Invalidation: A sustained close above 0.2460 would invalidate the bearish outlook and could trigger further upside.
Summary:
This setup aims to capture a potential short-term reversal from resistance with a clearly defined stop and target, supported by a favorable risk/reward ratio.
Weekly trading plan for DOGE Last week, BINANCE:DOGEUSDT showed strong growth and is now in a correction. At the moment, the price reacted from the moving averages and has impulsively broken this week’s pivot point at 0.225 . Therefore, as long as we stay above 0.218 , the target remains the 0.2440–0.257 range.
If support breaks, I’ll be watching the 0.205–0.193 zone.
More details are in the idea video. Also, let me know which format you prefer — photo with description or video format?

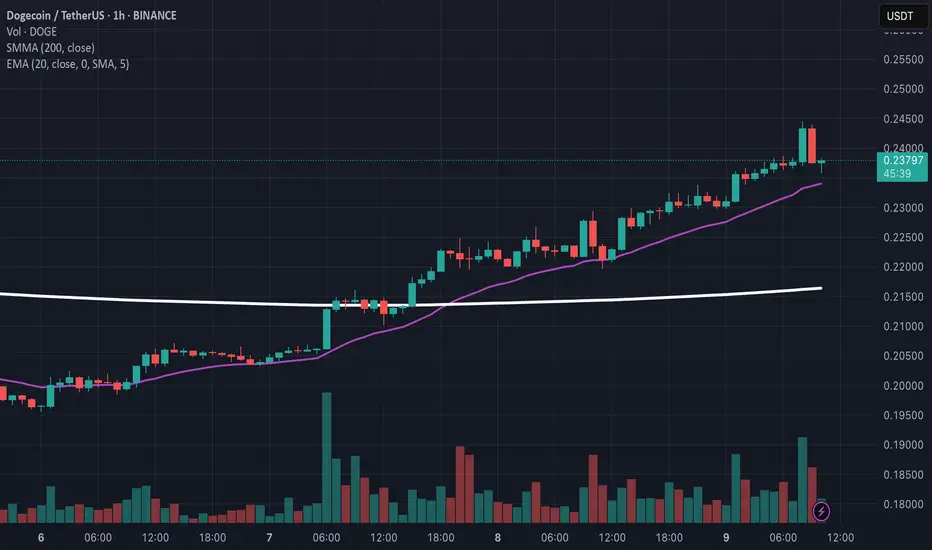
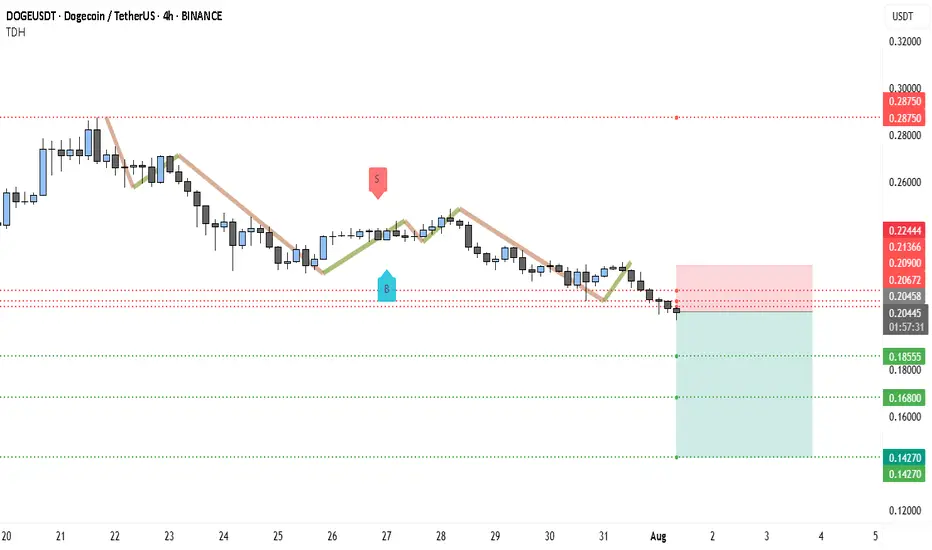
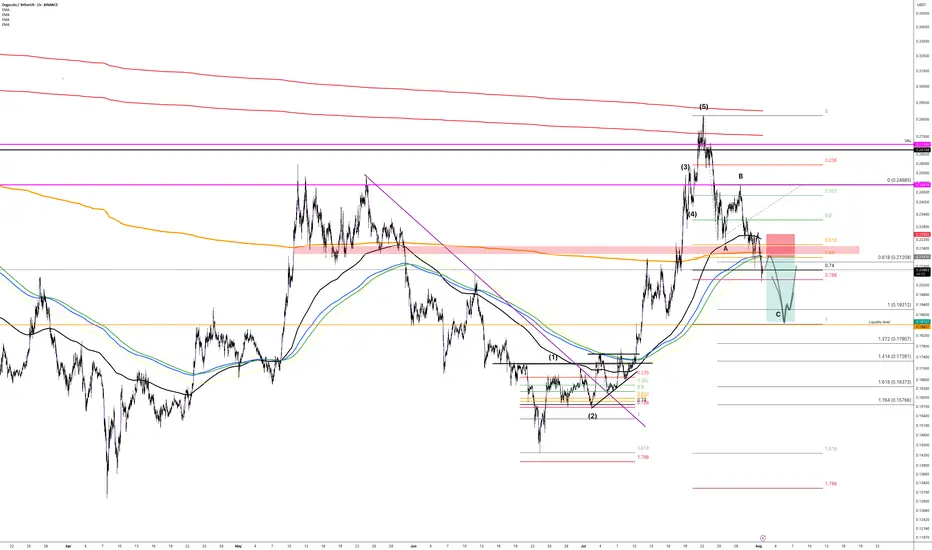
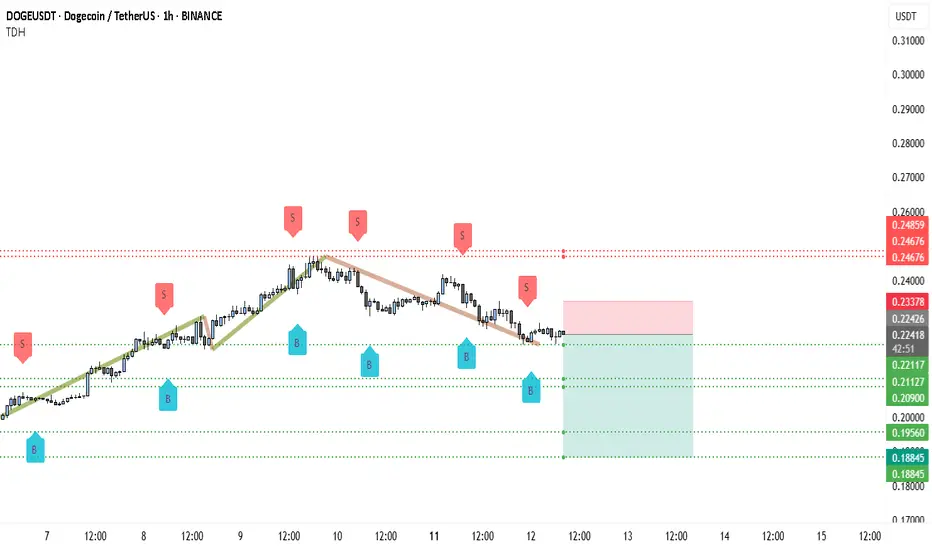
Sellers Tighten Grip on DOGE — $0.20 in SightDOGEUSDT has clearly transitioned from its earlier bullish phase into a decisive downtrend. After peaking near the 0.248–0.250 zone, price has been consistently printing lower highs and lower lows, confirming that sellers have taken control. The rejection around this major resistance has set the tone for a gradual but steady decline.
On the current 1H chart, candles are closing below the short-term moving average, and every attempt at a bounce (seen from the “B” buy signals) has been weaker than the last, showing fading buyer strength. The 0.23378 level is now acting as a strong short-term resistance where sellers have been quick to re-enter. Above that, the zone between 0.24676 and 0.24859 remains the critical ceiling for any bullish attempt.
Support on the downside is stacked quite close, starting with 0.22426–0.22420, which is being tested. A confirmed break here could open the path toward 0.22117, then the more significant 0.21127–0.20900 range. If selling pressure accelerates, the psychological 0.20000 level could be tested, and deeper targets such as 0.19560 and even 0.18845 may come into play.
Volume and price behavior suggest that sellers are dominating momentum. Sharp rejections after sell markers, combined with the lack of bullish engulfing patterns, indicate that downside continuation is more probable than a reversal at this stage.
Trading Idea (Bearish Bias) 📉
• Entry: ~0.22420 on breakdown confirmation
• Stop Loss: Above 0.23378
• Targets: TP1: 0.22117, TP2: 0.21127, TP3: 0.20000, TP4: 0.18845
It’s recommended to take partial profits at each target and trail the stop loss to protect gains if the drop extends.
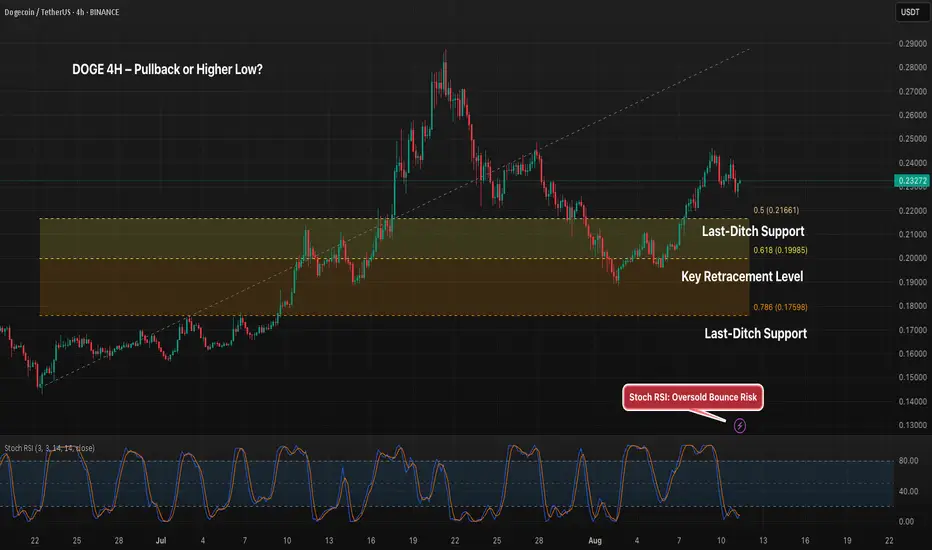
DOGE 4H – Holding Above 0.5 Fib, Can Bulls Push Higher?DOGE is holding above the 0.5 Fib retracement at $0.2166 after a strong move up from August lows. Stoch RSI is curling upward from oversold territory, suggesting a potential shift in momentum. A push above $0.245 could signal trend continuation toward $0.26, while losing the $0.2166–$0.1998 support range risks a deeper retrace toward $0.1759.
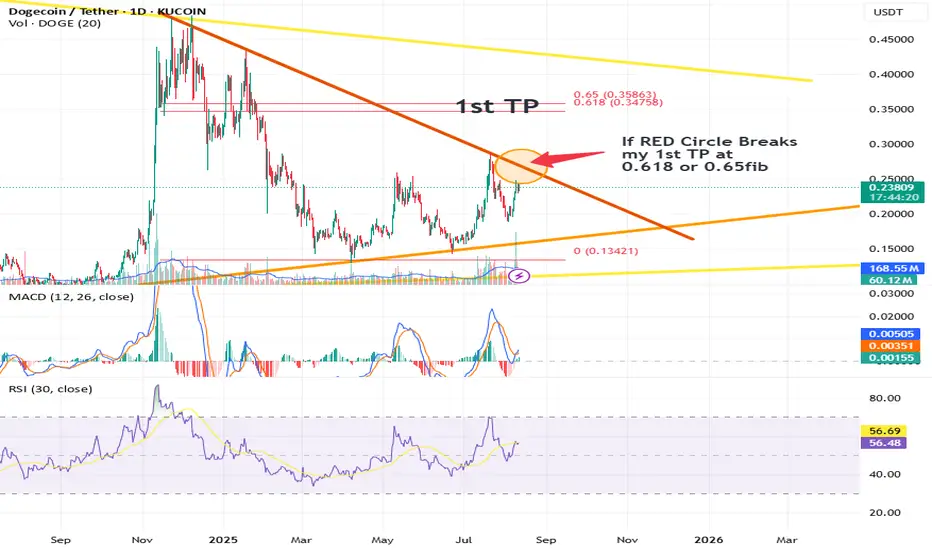
DOGE Bullish Breakout Setup ~ Watch the RED Circle DOGE is currently testing a key resistance zone marked by the red circle on the chart. This area coincides with the crucial Fibonacci levels of 0.618 to 0.65, a classic retracement zone that often signals strong reversal potential.
Key points to watch:
The orange descending trendline is the main resistance. A break above this line combined with the red circle zone breakout could trigger a strong bullish momentum.
My 1st Take Profit (TP) target is set around the 0.618 to 0.65 Fibonacci retracement level (~$0.34 - $0.36).
Support is well-defined by the ascending orange trendline, providing a good risk management area if the price pulls back.
Trading strategy:
Consider entering long if price decisively breaks above the red circle resistance with strong volume confirmation.
Use the ascending trendline as a stop-loss area to protect your position.
First target is at the Fibonacci zone mentioned above, but be prepared for potential continuation if bullish momentum sustains!
Stay tuned for updates and always use proper risk management. Let me know your thoughts or alternative targets below! 👇
DOGE x7 ShortEntry $0.237 Short
SL $0.02448
Just below high close for the day
Target $0.22
Sell 100%
Just above 200EMA
Risk - 6/10