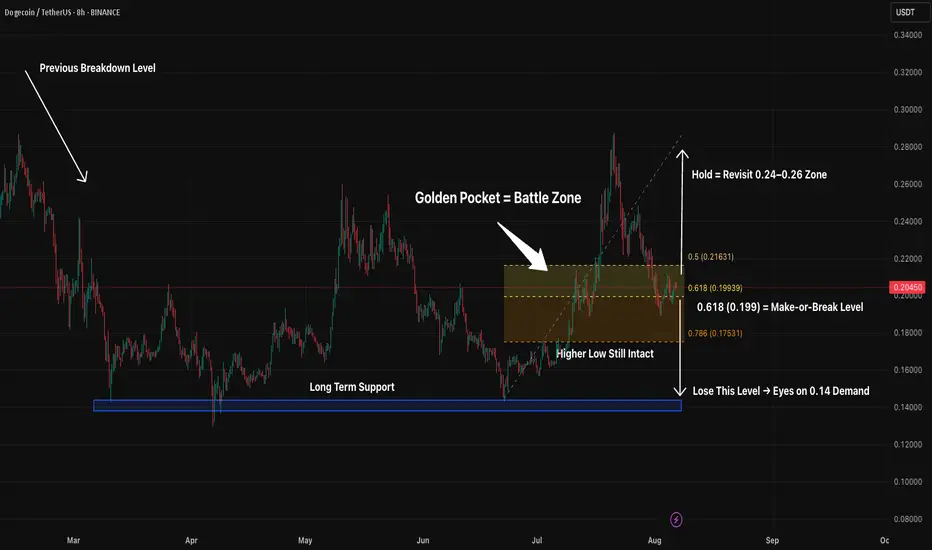
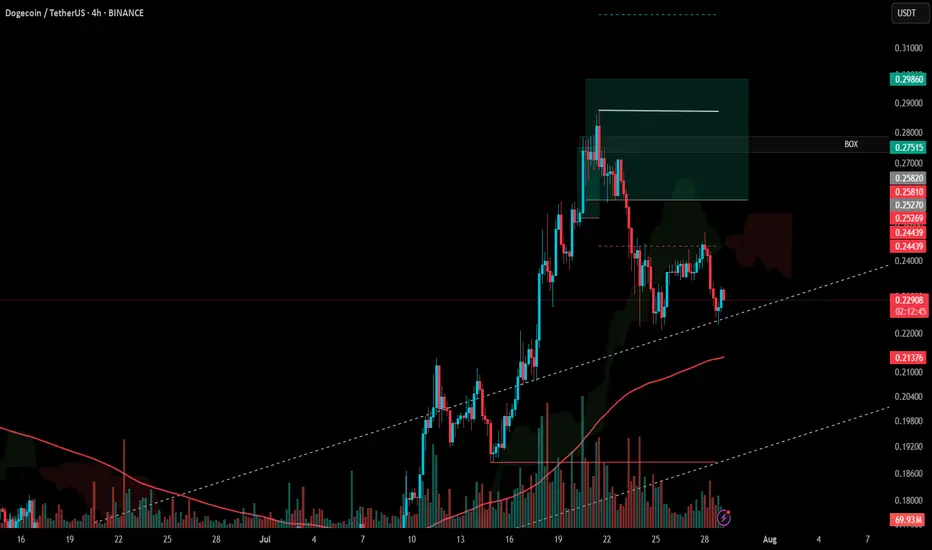
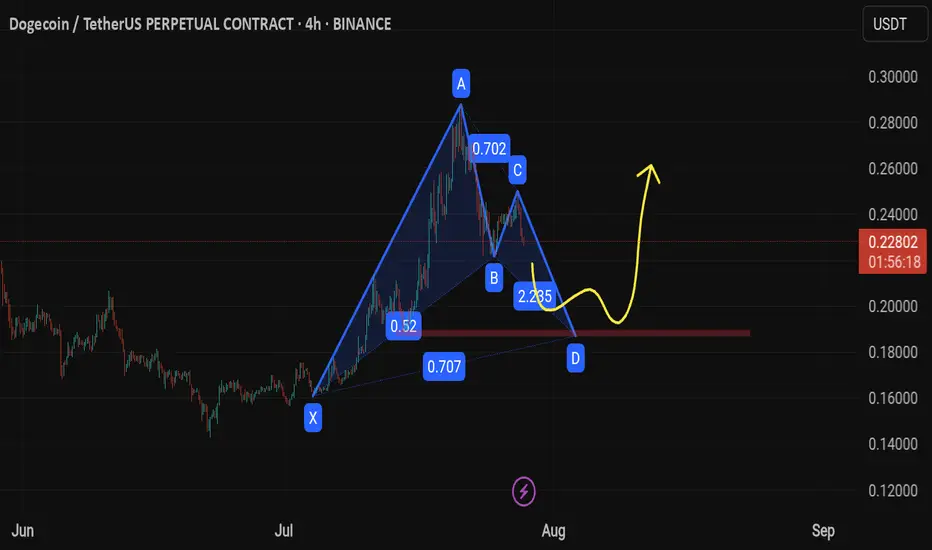
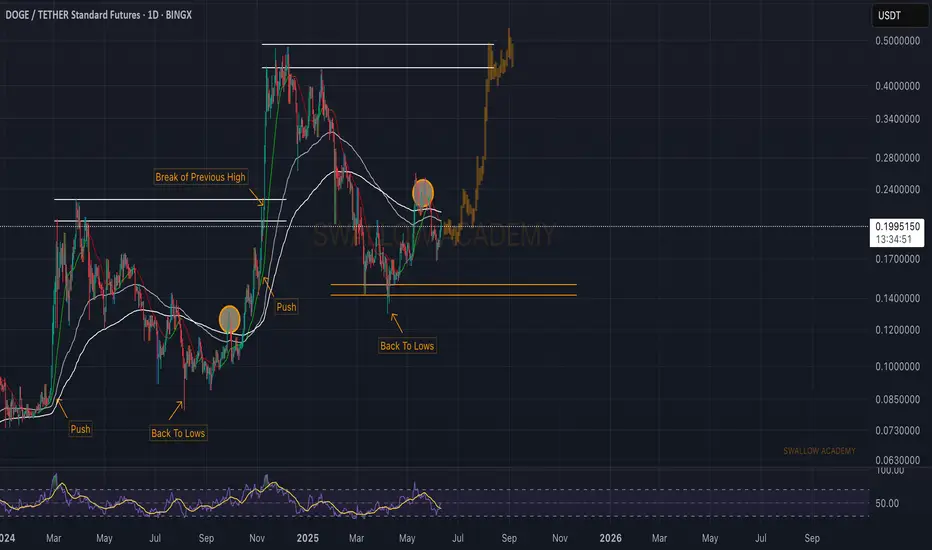
DOGE 8H – Fib Confluence Holding, But Decision Point Is HereDogecoin is at a pivotal moment.
After a sharp rally into the $0.28 zone, price retraced directly into the golden pocket (0.5–0.618 fib zone between $0.216 and $0.199). That area — historically known for decisive continuation or breakdown — has turned into a congestion zone.
Price is sitting right on top of 0.618, a level that lines up with prior structural resistance from June and swing support from July. This “support clustering” forms a critical level for the bulls to defend.
If the 0.618 Fib holds, this remains a healthy pullback in a broader bullish structure — and a push toward $0.24–$0.26 becomes likely. But lose it, and the door opens to a full retrace toward the high-demand blue zone around $0.14.
In short:
– Holding Fib = Bullish continuation bias
– Lose 0.199 = Trend invalidation and deeper pullback likely
– Still a higher low for now — but it’s hanging by a thread
Watch this level closely — this is where the next wave is born.
DOGEUSDT.3S trade ideas
IS DOGE Losing Steam or Gearing Up? Pro-Level Market Structure IS DOGE Losing Steam or Gearing Up? Pro-Level Market Structure
📊 Technical & Trend Analysis
Current Price & Structure:
DOGE is trading around $0.2058 and has recently fallen below both the ascending trendline since late June and the 50‑day EMA (~$0.20), signaling weakening momentum
Resistance & Support Levels:
Major Resistance: ~$0.21–$0.212 — price has repeatedly failed at this zone, forming a possible bearish flag or resistance trap
X (formerly Twitter)
+15
Mitrade
+15
Cryptonary
+15
.
Support Zones: Key levels around $0.196 and $0.18, breach of these may open path to $0.15 or lower short-term
Mitrade
.
Trading Sentiment & Derivatives:
Rising short interest and negative funding rates in futures suggest growing bearish sentiment among traders. Long-short ratio is near 0.86—indicating more shorts than longs
Binance
+1
.
🎓 Technical Setup Summary (Educational Breakdown)
Chart Pattern: Potential bearish continuation forming with flag or descending consolidation after breakdown.
Momentum Indicators: Weak RSI and MACD below zero typically align with this structure—though check live chart from platforms like TradingView or Investing.com
Investing.com
.
Trade Selection Approach:
Short Trade Setup: Wait for confirmation below $0.196 to test trend continuation toward $0.18 or $0.15. Stop-loss above $0.202–$0.205.
Long Trade Setup: If DOGE reclaims $0.21 with volume and breaks above the broken trendline + 50‑day EMA, potential rebound toward ~$0.225 or higher. Stop-loss below $0.20.
🔮 Forecast & Outlook
Short-Term: Likely consolidation or correction toward $0.18 unless bullish momentum resumes. Analysts eye potential targets around $0.199–0.215 in early August, rising maybe toward $0.232 by mid-August if sentiment snaps back
Binance
+2
Indiatimes
+2
Indiatimes
.
Medium to Long-Term:
Some speculative projections place DOGE near $1 by year-end, driven by hype cycles, meme coin revival, celebrity tweets, and ETF optimism. That being said, DOGE’s unlimited supply makes $1 an aggressive target requiring massive capital inflow
Crypto News
+5
Wikipedia
+5
Indiatimes
+5
.
✅ Key Takeaways for Traders & Learners
Concept Insight
Support/Resistance $0.196–$0.18 = bearish supports; $0.21 = strong resistance zone
Trendline & EMA Breaking below trendline/50‑day EMA signals weakening structure
Volume & Funding Increasing shorts and low funding rates hint at bearish pressure
Risk Management Use proper stop-loss zones ($0.196 for shorts, $0.20 for longs)
Catalysts to Watch Whale accumulation, meme hype, ETF news, celebrity endorsements
🚨 Risks & Important Considerations
Volatility & Pump Risks: MEME coins like DOGE are susceptible to pump-and-dump dynamics and social-media driven surges or dumps
Indiatimes
Binance
+1
.
Inflationary Drag: Without a supply cap, DOGE’s price is diluted by thousands of coins mined daily, limiting long-term upward momentum unless demand rises significantly.
Macro Events: Broader economic shocks—such as U.S. tariffs or regulation changes—can rapidly swing sentiment across crypto markets. Recent U.S. tariffs pulled DOGE down ~8% with Bitcoin and Ethereum
Wikipedia
.
🧭 Final Summary
Current Bias: Slightly bearish-to-neutral—downward pressure from technical breakdowns.
Watch Closely: $0.196 support and $0.21–$0.212 resistance; reclaiming one of these defines short-term bias.
Strategy:
Consider short plays below $0.196 toward $0.18.
Consider long plays only after strong breakout above $0.21–$0.212.
Always apply strict risk controls.
—
DOGE LONGPossible good area to bid.
- start to reak trendline resistance and consolidating.
- SL can be used or just accumulate
- Personally believe this won't go as low as .13

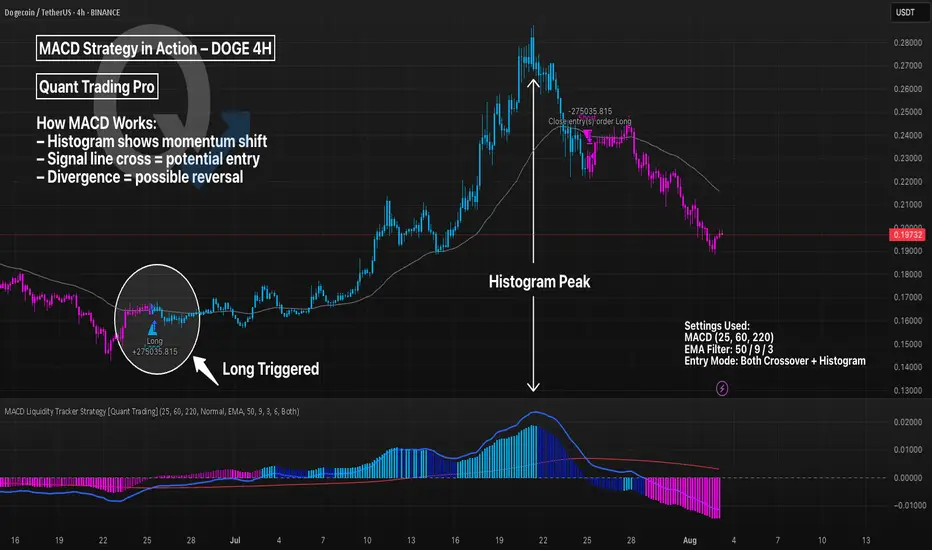
MACD Liquidity Strategy in Action – DOGE 4HThe MACD (Moving Average Convergence Divergence) is a trend-following momentum indicator. It uses two EMAs to generate signals via crossovers and histogram shifts.
This chart shows DOGE 4H with a long-only MACD Liquidity Tracker Strategy, using:
Fast EMA: 25
Slow EMA: 60
Signal Line: 220
These longer settings reduce noise and provide higher-conviction swing entries, though at the cost of late signals.
💡 Tweak Tip:
Lower values (e.g. 12/26/9) = more signals, better for scalping
Higher values (e.g. 25/60/220) = fewer signals, better trend filtering
Adjust the EMA filter (50/9/3 here) to match asset volatility
📊 Use MACD for:
Trend continuation confirmation
Exit timing via histogram fading
Divergence spotting (momentum vs price)
#DOGE Update #3 – July 29, 2025#DOGE Update #3 – July 29, 2025
I’m still holding my Doge position and haven’t been stopped out. I plan to lower my average cost by adding to the position at potential reversal zones. This is how I intend to proceed. My entry level is currently $0.2583, and my target is $0.2986, which means I’m aiming for roughly a 15% profit.
At the moment, the price has pulled back about 11% from that level. There’s nothing to worry about—it’s perfectly normal. Doge is continuing its movement by taking support from the bottom of an upward trend. I’m still in the position and planning to exit with profit without setting a stop.
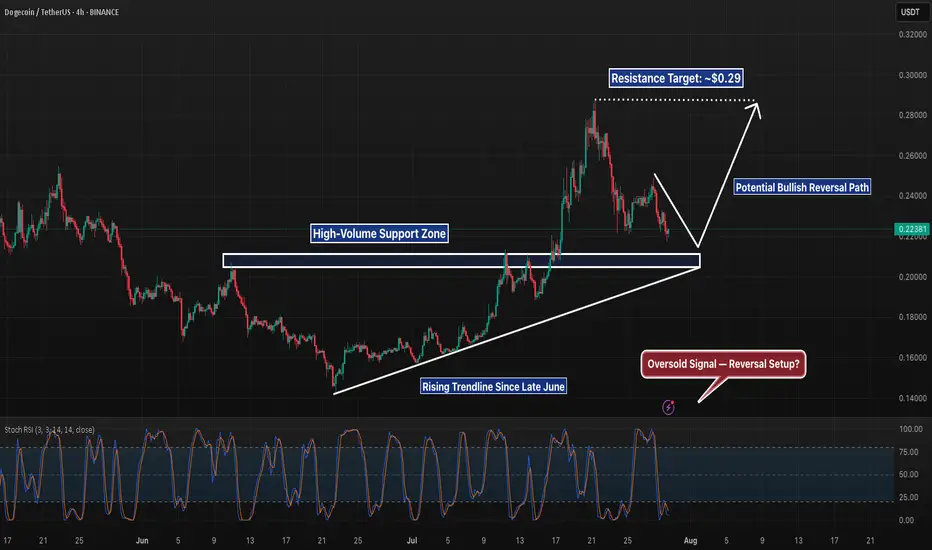
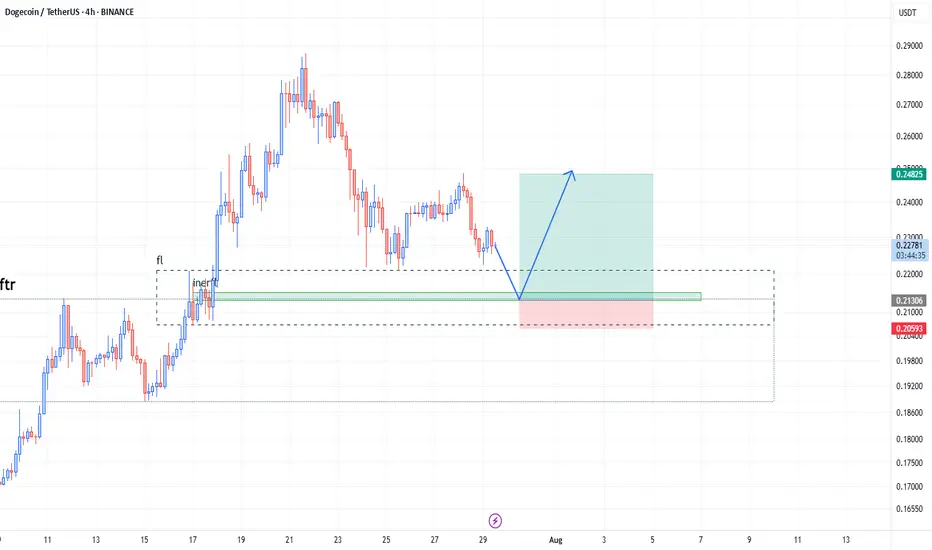
DOGE 4H – Strong Support Test Before Alt-Season??DOGE is approaching a pivotal support zone on the 4H chart — the same area that acted as the breakout base in mid-July before price surged nearly 40% higher. This horizontal level is now being tested again, offering a potential opportunity for trend continuation if bulls can defend it.
The support zone also aligns with an ascending trendline that has been respected for nearly a month, creating a key confluence point. Combined with an oversold Stochastic RSI reading, the setup is beginning to show early signs of a potential reversal — but confirmation is still needed.
Price structure remains technically bullish unless this area breaks. A clean bounce here could trigger a new wave toward the prior high at $0.29. On the flip side, a breakdown of this confluence zone would invalidate the current trend structure and likely target the $0.19–0.20 region.
📊 What I’m Watching For:
– Bullish price action (e.g., hammer candle, engulfing) off this zone
– Higher low confirmation with volume
– Trendline retest and hold
– Momentum alignment with RSI/Stoch flip
DOGE remains one of the more technically clean charts among majors — but holding here is key. Watching closely.
DOGE Looking Strong as Support HoldsDOGE Looking Strong as Support Holds
🔹 1. Support Zone Validated
The chart shows Dogecoin retested the lower boxed region around $0.221–$0.223, and bounced sharply from that zone. Given the heavy spike in volume during the retest, this suggests aggressive buying and accumulation—a hallmark of bullish conviction.
CryptoRank
The Tradable
🔹 2. Fibonacci 0.618 Support Bounce
On the 4‑hour timeframe, DOGE held firm above the critical Fibonacci 61.8% retracement level, and delivered a strong rebound—indicating technical significance and buyer interest at this level.
Blockchain News
🔹 3. Double-Bottom + Trendline Breakout
Analysts have identified a classic double-bottom formation, with price clearing the neckline (~$0.230–$0.231) and then retesting it successfully. Holding this retest confirms a breakout, suggesting more upside ahead.
Crypto Basic
🔹 4. Whale Activity & Accumulation
On-chain data shows $250 million in Dogecoin accumulation by whales, especially around the support zone—creating a structural demand base and reinforcing the bullish setup.
CoinCentral
🎯 Price Targets & Key Levels
Scenario Levels Rationale
Bullish continuation $0.239–$0.241 union resistance First resistance zone—price must reclaim to continue bullish momentum
$0.260–$0.280 Reclaiming $0.241 could open room toward mid‑channel resistance or prior highs
$0.300+ Potential target if momentum sustains and broader breakout occurs
Bearish invalidation $0.223 support Invalid break below suggests fading momentum—risk of correction to $0.215–$0.218
$0.215–$0.218 Secondary support zone if expansion of sell side continues
⚙️ Trade Setup for a Bullish Bias
Entry Focus: Consider entering long near $0.223 if price retests and holds, with a tight stop just below support.
Stop-Loss Zone: Slightly beneath $0.221 to account for volatility.
Targets: Scale out around $0.241, with larger targets at $0.260–$0.280, and possibly $0.30+ on sustained strength.
Confirmation: Watch for rising volume, break and close above resistance zones, and bullish indicator alignment.
⚡ Market Sentiment & Broader Themes
Momentum Shift: A bearish retrace reversed quickly amid accumulation, suggesting strong buyer commitment.
CryptoRank
The Tradable
AInvest
Double Bottom Status: Analyst commentary supports a reversal setup, with targets toward $0.310–$0.46 if the neckline holds.
Crypto Basic
AInvest
CryptoRank
Macro View: DOGE remains within a bullish channel; some forecasts project
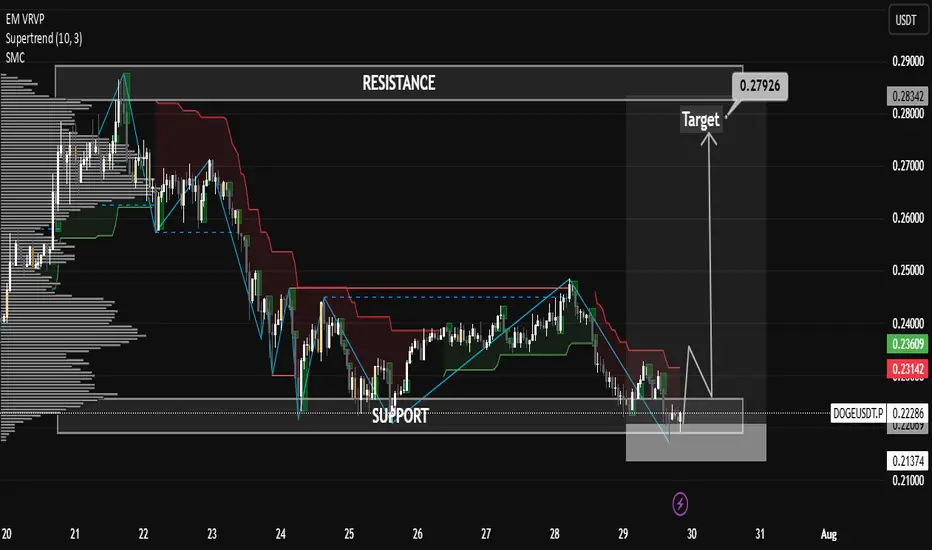
DOGE/USDT Technical Analysis – Breakout AnticipationDOGE/USDT Technical Analysis – Breakout Anticipation
As of the current market structure, DOGE/USDT is showing signs of a potential bullish reversal from the demand zone (support), aiming toward the projected target at 0.27253 USDT.
🔍 Chart Structure & Price Action
Support Zone (0.21873 – 0.22568): The price has previously respected this area, making it a strong demand zone where buyers stepped in.
Resistance Zone (0.27756 – 0.29000): A key supply zone where previous rallies halted. This is the ultimate test for bulls after the breakout.
Current Price (0.23743) is showing consolidation above the support, suggesting accumulation before a move.
🧠 Technical Indicators
Supertrend Indicator: Currently flipping to bullish (10,3 settings), indicating potential upside continuation.
Volume Profile (VRVP): Shows high volume nodes around the support level, confirming strong interest from institutional players or large orders.
Market Structure: A higher-low is forming, indicating early signs of a bullish market shift.
🎯 Target
The projected move towards 0.27253 USDT aligns with previous price action and supply zone interaction. A clean breakout from the current consolidation could fuel momentum toward this level.
🎓 Educational Insight
This setup reflects the principles of Smart Money Concepts (SMC):
Price tapping into demand before impulse moves.
Liquidity grab at lows.
Break of structure (BOS) to the upside could trigger continuation.
Traders can learn the value of combining structure-based trading with volume analysis to improve entry precision and confidence.
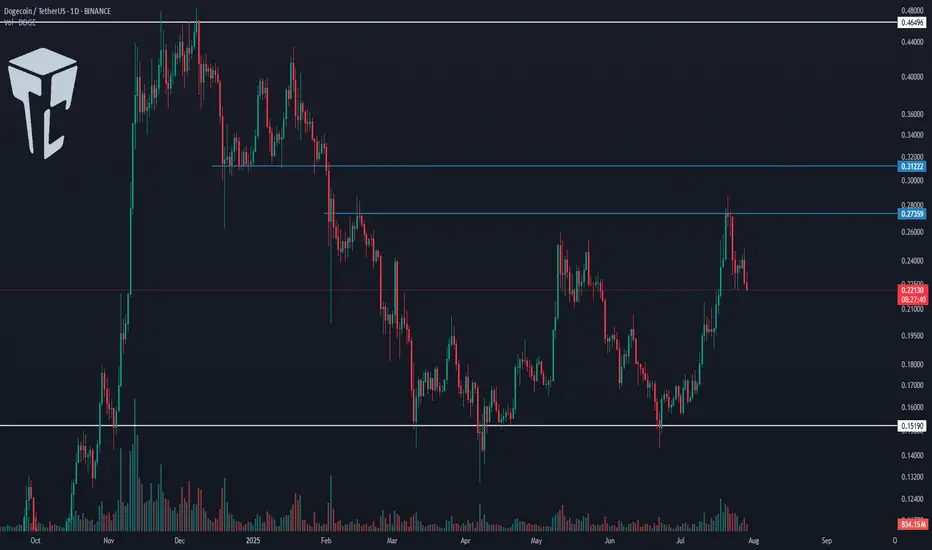
TradeCityPro | DOGE Faces Resistance with Altseason Tailwinds👋 Welcome to TradeCity Pro!
In this analysis, I want to review the DOGE coin for you. One of the first and most popular shitcoins in crypto, which managed to attract a very strong market cap during the previous bull run due to the hype around Elon Musk.
🔍 Currently, this coin has a market cap of $34.06 billion and ranks 8th on CoinMarketCap.
📅 Daily Timeframe
In the daily timeframe, this coin has created a very strong support level at 0.15190, and now after a bullish leg, it has formed a top at 0.27359.
📊 The buying volume increased nicely during this bullish leg, and the price moved up to the 0.27359 resistance.
✔️ Now, after the first touch, the price has started a slight correction and is moving downward. If further touches occur, we can open a long position after breaking the top.
📈 Breaking 0.27359 could be one of those positions that stays open all the way up to 0.46496, and we can buy this coin in spot using the profit from that trade. I will try to have a position open after breaking 0.27359, aiming for 0.46496.
💥 The next trigger we have is the break of 0.31222, but the price should first form some structure after reaching that area, and only after confirmation should we open a position. Just entering based on that break doesn’t seem logical to me.
🔽 If a correction and drop happen, as long as the price stays above 0.15190, there’s no problem for the trend to continue. But if the price stabilizes below that level, a trend reversal might occur.
📝 Final Thoughts
This analysis reflects our opinions and is not financial advice.
Share your thoughts in the comments, and don’t forget to share this analysis with your friends! ❤️
dogeusdtMy opinion is based on the Arti M strategy. Share your thoughts with me. Is your opinion right or wrong?
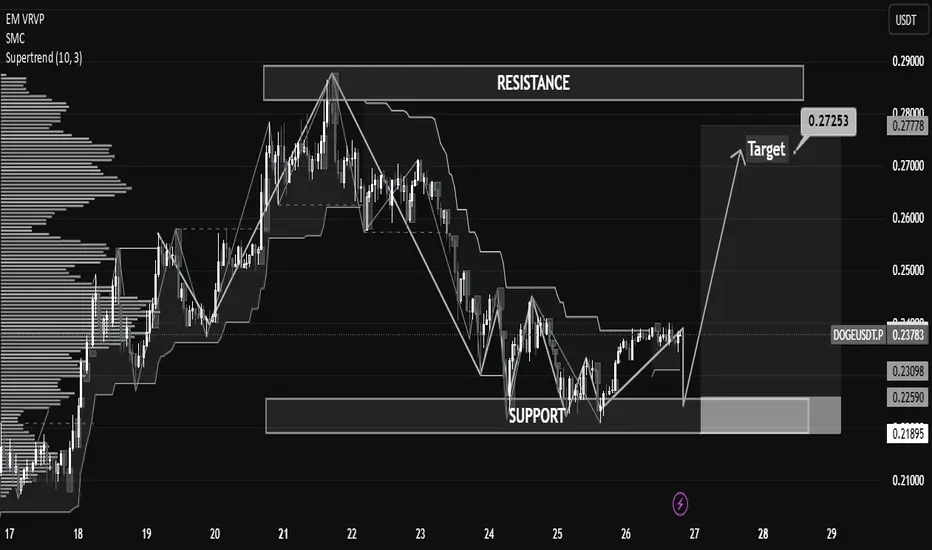
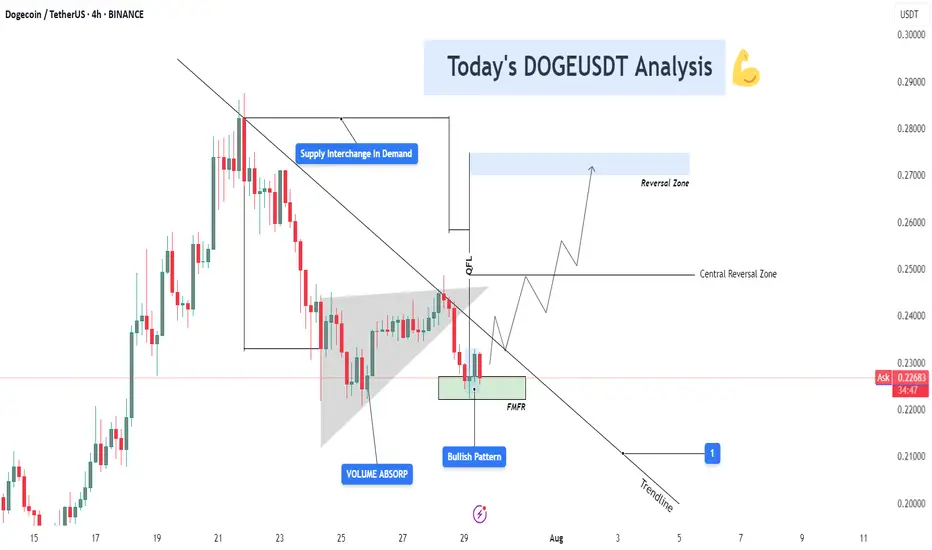
DOGEUSDT 4H – Bullish Reversal Building from FMFR Zone📊 Chart Context & Market Maker Concept Breakdown
DOGEUSDT on the 4H timeframe is setting up for a potential trend reversal, following a structured retracement into a strong demand zone that aligns with multiple smart money confirmations: QFL base, trendline break, volume absorption, and FMFR (Final Move Final Reaction). Let’s dive into the technical layers of this setup:
🔻 1. Downtrend Phase & Structure Setup
After peaking near $0.29, DOGE entered a controlled downtrend, respecting a descending trendline and forming a consistent lower-high structure.
Each rejection from the trendline reflects institutional distribution, gradually pushing price into lower demand levels where value buyers can step in.
🔄 2. Supply Flips into Demand (S/D Flip Zone)
A key level near $0.225 – $0.230 initially acted as a supply zone — but following QFL logic and smart money reaccumulation, it is now showing signs of demand activation.
The chart highlights “Supply Interchange in Demand”, which means that this zone has been repurposed — from distribution to accumulation — another MMC footprint.
📌 Interpretation: This is where large players flip their position bias and start loading for the next leg up.
🔵 3. Volume Absorption Confirmed
Prior to the current bounce, a strong volume absorption phase was detected within a falling wedge or triangular base, shown on the chart.
Despite sell-side pressure, buyers continued to absorb orders — a sign that selling is weakening, and accumulation is underway.
📌 Clue: Volume absorption often precedes an explosive breakout, especially when aligned with FMFR or QFL patterns.
🔁 4. Final Move Final Reaction (FMFR)
Price tapped into the green box zone one final time, marked as FMFR (Final Move Final Reaction) — a key MMC reversal signal.
This occurs when market makers fake a breakdown (creating panic) and then sharply reverse, trapping breakout sellers and scooping up liquidity.
A small bullish candle formation (Bullish Engulfing / Pin Bar) can be seen within this zone — the “Bullish Pattern” label marks this.
🧠 Smart Money Logic: Institutions want liquidity. FMFR fakes weakness to attract retail shorts, then reverses to ride liquidity to the upside.
🔗 5. QFL Base + Break of Structure Setup
A QFL (Quick Flip Level) pattern is forming. This represents a market structure flip, where price first drops from a base, reclaims it later, and continues in the opposite direction.
Breaking this base and confirming above it would mark a true reversal in structure.
🛠️ Technical Confluences at Work
Element Insight
🔹 QFL Structure Base level reclaim in play (structure shift)
🔹 Volume Absorption Smart money soaking up sell pressure
🔹 FMFR Reaction Final stop hunt before the rally begins
🔹 S/D Flip Supply turned to demand near $0.225 zone
🔹 Bullish Pattern Early confirmation of reversal
📈 Projection Path & Reversal Zones
Two projected zones are mapped for price behavior:
🔸 Central Reversal Zone (~$0.250):
First significant resistance where price may pause or react.
Ideal partial profit level or re-entry after pullback.
🔹 Main Reversal Zone (~$0.270–0.275):
Target area for a full liquidity sweep.
This was a previous high-volume supply zone.
If price reaches here, expect potential rejection or distribution unless momentum is strong.
🎯 Trade Setup Strategy (Based on Your Chart)
Entry Area: $0.225 – $0.229 (FMFR Reversal Zone)
Stop-Loss: Below $0.221 (beneath FMFR low)
Take Profit 1: $0.250 (central zone)
Take Profit 2: $0.270 – $0.275 (main reversal zone)
📐 Risk-to-Reward:
TP1: 1:2
TP2: 1:3+ depending on entry timing
🧠 Psychology Behind the Setup
This DOGE setup is engineered to trap emotional traders:
Retail sellers enter late near the bottom.
Smart money waits at FMFR zone, absorbing liquidity.
Volume builds quietly.
Market reverses explosively, catching retail off guard.
By recognizing this setup early, you’re aligned with Market Makers, not against them.
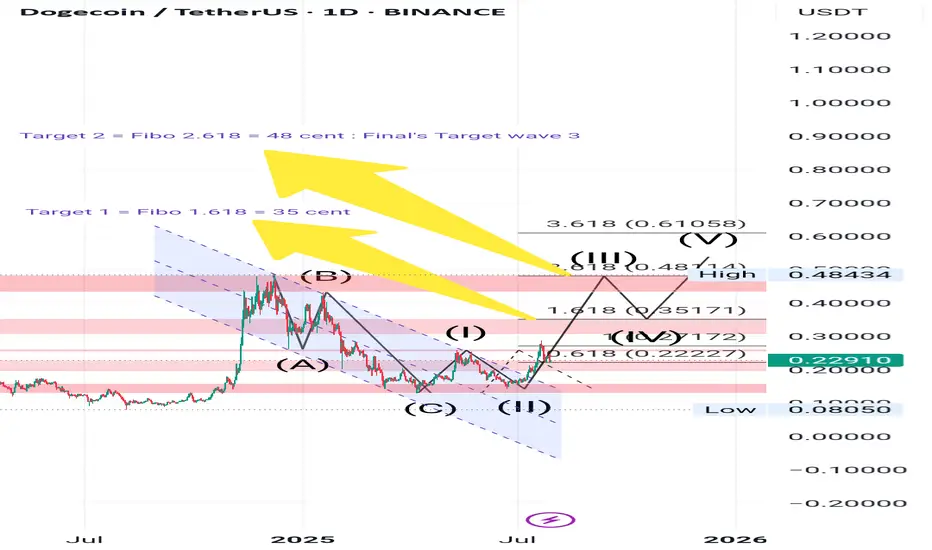
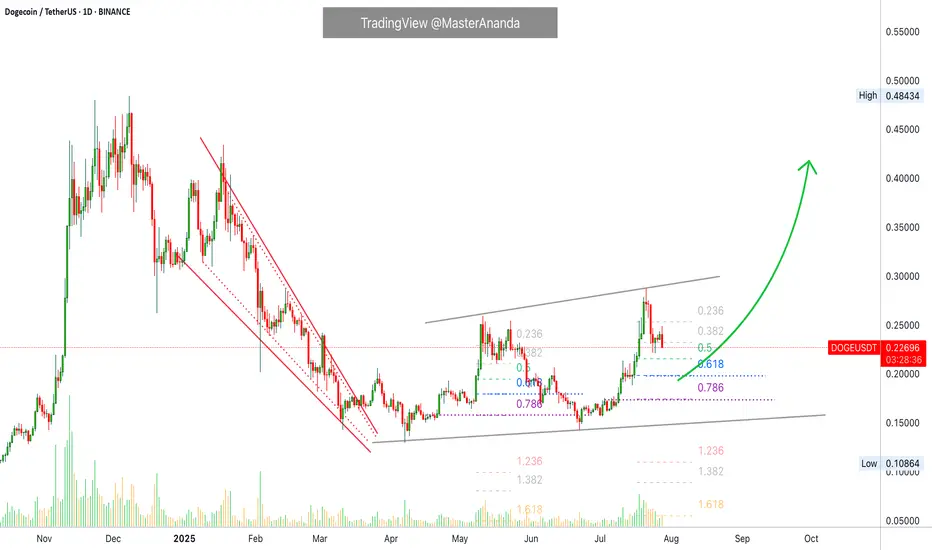
Doge: Daily TimeFrame: wave 3 ?! MaybeDogecoin chart on Daliy Timeframe.
Price is completing wave 3.
The targets are clearly visible on the chart.
Target 1 = 35 cent
Target 2 = 48 cent
Dogecoin · Risk of Much Lower is MinimumWe start the process by looking at a few charts. We start with the big projects in order to gain a perspective of the bigger picture. After reviewing 10-20 charts, we start to get an idea, but we don't form any picture in our minds, we just continue reading; reading the articles and reading the charts.
After just 10 days, we have anywhere between 80 and 100 articles/charts. Now we have a better picture of the market. We know how each sector is doing and this further helps us develop our bigger picture, the one that will help us call the shots.
After we review 150 to 200 charts and trading pairs, we get the pulse of the market. Where the energy flows, our attention goes and sometimes our attention reaches before the energy and this gives us an entry prize.
It will continue to work in this way. If you look at the market daily, read open to accepting new information, accepting always that I can be wrong, we can continue to develop a sense of what is really happening.
Dogecoin is making a minor pause after weeks of sustained growth. It is normal, if the market is going to be growing for months, everything cannot happen in a day. Five steps forward, three steps back.
Namaste.
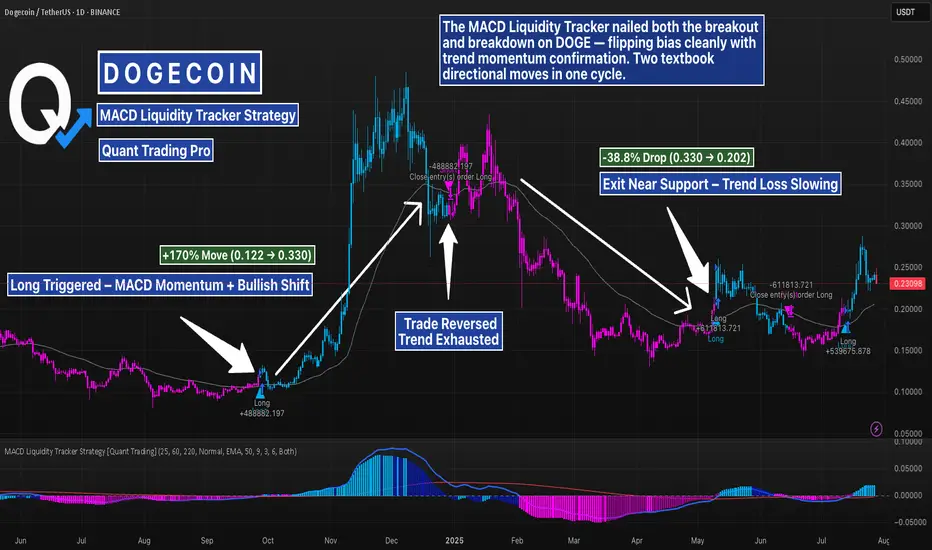
DOGE MACD Liquidity Tracker Strategy – Trend Flip & Breakdown 1DThis DOGE 1D chart highlights two key directional shifts caught by the MACD Liquidity Tracker Strategy — a bullish breakout near $0.12 and a clean reversal near $0.33. The system flipped long once MACD momentum aligned with trend structure, and later rotated bearish as the trend exhausted.
Both moves were captured without guessing — using dynamic trend coloring and a momentum-backed entry logic. Visual bias (blue/pink) helps contextualize the trend at a glance, and the EMA filters reduce chop during sideways conditions.
To explore this setup yourself, search for the strategy by name and run your own backtests to refine inputs per asset and timeframe.
📊 Strategy Name:
MACD Liquidity Tracker Strategy
This is one of several strategy visualizations — more incoming.
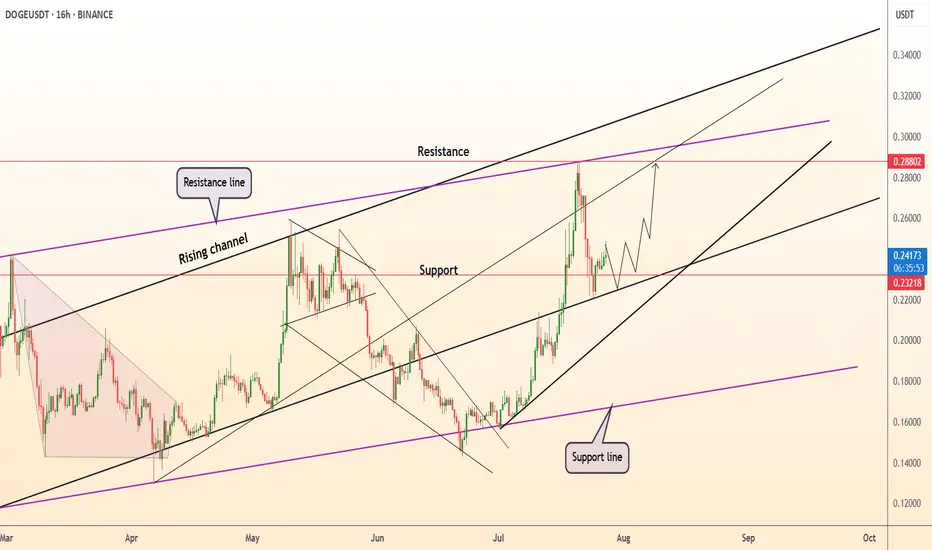
DeGRAM | DOGEUSD above the support level📊 Technical Analysis
● DOGE keeps printing higher swing-lows inside the 5-month rising channel; the latest pull-back bounced precisely at the mid-band/0.232 support, turning May’s flag roof into demand.
● A fresh micro bull-flag is unfolding above that rail; its pole height and channel geometry project follow-through toward the upper red supply 0.288-0.300 where the purple macro cap meets the channel crest.
💡 Fundamental Analysis
● Binance confirmed its late-July quarterly burn will include >150 M DOGE trading-fee tokens, trimming float, while reports of X testing DOGE micro-payments boosted social volume this week.
✨ Summary
Long 0.232-0.245; hold above 0.232 targets 0.272 → 0.288. Invalidate on a 16 h close below 0.214.
-------------------
Share your opinion in the comments and support the idea with a like. Thanks for your support!
Dogecoin (DOGE): Getting Ready For Buyside Movement | $0.44Dogecoin is repeating its pattern where, after forming local lows and the first breakout above EMAs, the price is not getting ready for a proper push, it seems to us.
We are monitoring for the EMA line here, as once we see a proper break (the second one), we will be aiming for the $0.44 area.
Swallow Academy
DOGEUSDT is testing 0.5 Fibonacci support (more gain)As we can see the breakout of red trendline also completed and volume increases after that and now market is testing major Fib levels like 0.5 & 0.61 soon we can expect more pump and gain here like the green arrows.
so many stop loss also hit on this fast correction to the downside and price is ready to start next boom pump with kicking out leverage buyers first.
DISCLAIMER: ((trade based on your own decision))
<<press like👍 if you enjoy💚
#DOGE Update #2 – July 27, 2025#DOGE Update #2 – July 27, 2025
I previously made two purchases in Doge, and closed one of them with approximately a 10% profit. You can see this in earlier posts as well. After that profit-taking, I opened another position in Doge. However, this time Doge chose to make a correction.
I’m still holding the position and haven’t averaged down yet. My entry level is currently around the $0.262 zone. Unless I see a sharp drop or a clear breakout signal, I find it more reasonable to hold onto the cash in my account rather than averaging down.
At the moment, along with XRP, I’m experiencing around a 10% drawdown from the current level. However, I will continue to wait. I don't think it's reasonable to make a new purchase from this level.
If I decide to average down, I plan to do it near the $0.18 zone. There's also a slight chance I may add at the $0.21 level, but I'm not certain yet. From its current position, I expect approximately a 14% profit. I will continue holding this position.
DOGEUSDTBINANCE:DOGEUSDT is in good level for pump because if breaked trendline and resistance 0.200$ ready for sharp movement to next levels.
Resistances: 0.25 - 0.32 - 0.45
Support: 0.15
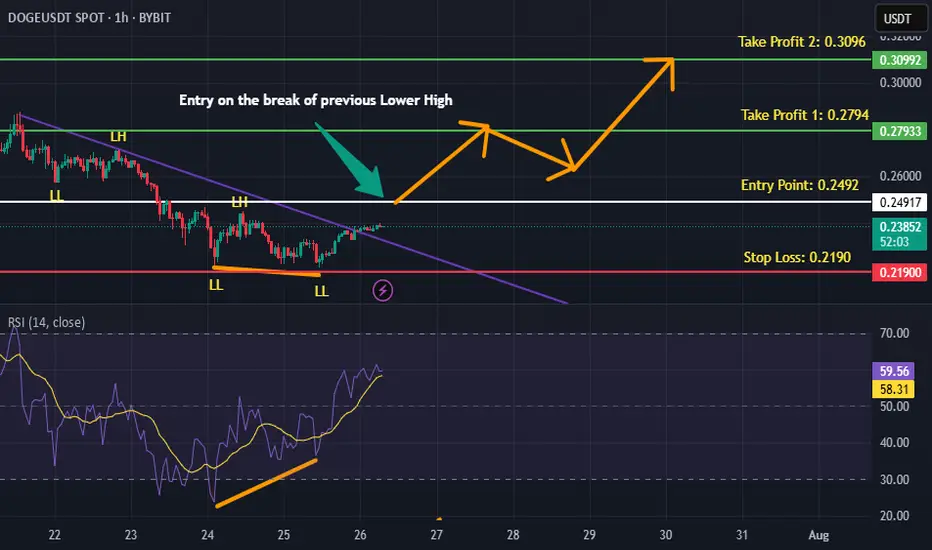
DOGEUSDT is BullishPrice went down for a small retracement on hourly timeframe, however the double bottom formation coupled with bullish divergence and breaking of descending trendline hints that bulls are assuming control of the price action. This sentiment would be validated with the break of previous lower high, according to Dow theory. Targets are mentioned on the chart.
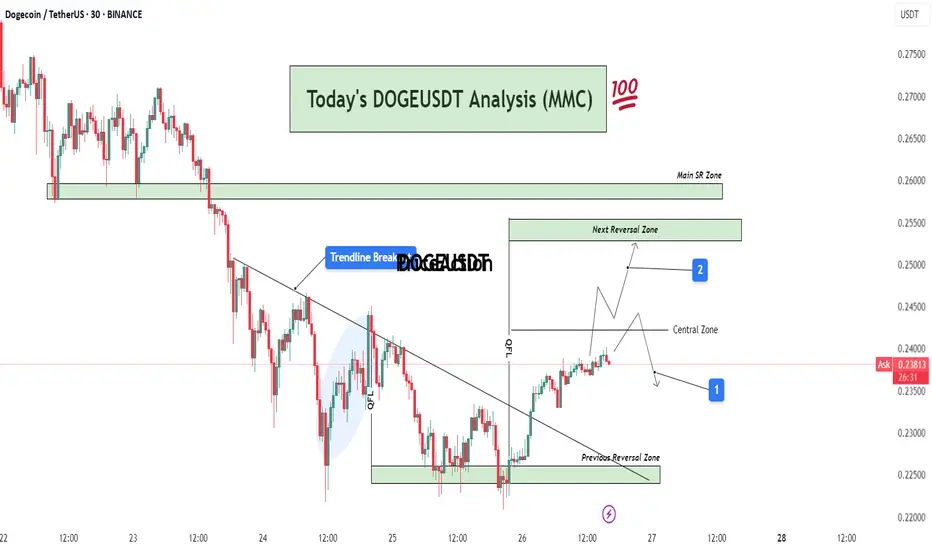
DOGEUSDT Analysis : Bullish Breakout, Reversal Zones + Target📊 Full Technical Analysis:
This chart presents a structured and precise MMC-based analysis of DOGE/USDT on the 30-minute timeframe, integrating key price action zones, trendline structure, and potential market scenarios.
🧩 1. Downtrend Phase and Trendline Formation
DOGE was in a continuous downtrend, creating lower highs and lower lows. A bearish trendline had been acting as dynamic resistance for multiple sessions. Price consistently respected this trendline, indicating strong seller dominance.
However, after repeated taps on the trendline and rejection from lower support, price finally broke above the trendline — marking a potential trend reversal or corrective phase.
🔄 2. Previous Reversal Zone – Demand Zone (0.225–0.228)
This zone acted as the major turning point where buyers aggressively stepped in. The demand was previously tested and respected, indicating strong accumulation here.
From this zone, a bullish reversal was initiated, leading to the current price rally.
This area can now be considered a structural support base – ideal for watching future re-tests or consolidation.
🔁 3. Central Zone – Decision Area (0.238–0.240)
This is a critical intraday resistance zone acting as a central decision-making area for traders.
Two Key Scenarios Could Play Out from Here:
Scenario 1 (Marked by Blue Box 1):
Price could face rejection from this zone and fall back slightly toward minor support levels for a retest or liquidity grab. If bullish pressure sustains, a higher low may form before continuation upward.
Scenario 2 (Marked by Blue Box 2):
If price breaks above the central zone with strong volume, momentum can push it toward the Next Reversal Zone between 0.250–0.255.
In either case, watching price behavior and candle structure near the central zone is critical for confirmation of the next move.
🔼 4. Next Reversal Zone – Supply/Resistance (0.250–0.255)
This zone marks a historical resistance area where DOGE faced heavy selling pressure before.
If price reaches this zone, expect:
Either profit-taking and short-term selling from intraday traders.
Or a possible breakout continuation if broader market sentiment remains bullish.
This zone will act as a key test of DOGE's strength and market conviction.
📌 5. Main SR Zone – Strong Structure (0.258–0.260)
Beyond the Next Reversal Zone lies the Main SR (Support-Resistance) Zone, where price has reacted strongly in the past.
If DOGE manages to break and hold above the 0.255 range, this zone will likely become the next upside target and strong resistance zone.
🔍 Additional Market Context:
Breakout Volume: The trendline breakout was accompanied by rising volume, which suggests stronger conviction behind the move.
QFL Zone: Price structure also aligned with a QFL (Quick Flip Level) bounce within the shaded region before breakout, further validating the bullish pressure.
Psychological Levels: 0.240 and 0.250 are psychological levels, which often act as magnet points and temporary resistance/support.
🧠 Mirror Market Concepts (MMC) Insight:
This analysis is rooted in Mirror Market Concepts, where the market tends to reflect past behavioral zones. Each marked zone (Demand, Central, Reversal, SR) is based on previous reaction points that guide current sentiment.
The market is now in a mirror reaction phase, moving from the previous demand zone toward historical supply zones. If the symmetry continues, the pattern supports a gradual bullish continuation with measured pullbacks.
✅ Trading Plan (Educational Purpose Only – Not Financial Advice):
Entry Zone 1: Breakout traders may have entered after the trendline breakout near 0.233–0.235.
Entry Zone 2: Conservative traders can look for retest confirmation in the Central Zone.
Target Zone: Next Reversal Zone (0.250–0.255) and possibly Main SR (0.260).
Stop Loss: Below the Previous Reversal Zone (~0.224) for swing setups.
Risk-to-Reward: RR setup of 1:2 or higher possible depending on entry strategy.
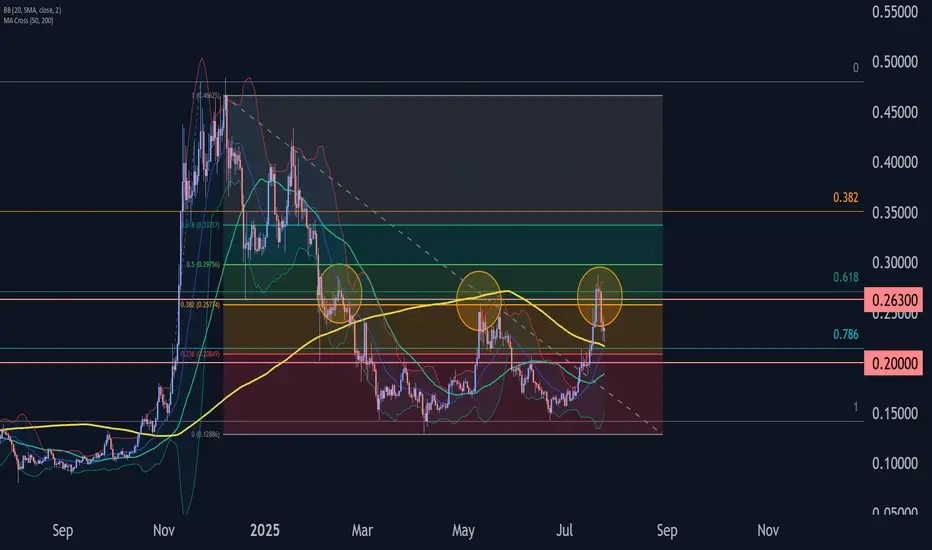
Dogecoin Wave Analysis – 25 July 2025
- Dogecoin reversed from resistance zone
- Likely to fall to support level 0.2000
Dogecoin cryptocurrency recently reversed down from the resistance zone between the key resistance level 0.2630 (former monthly low from December, acting as the resistance now), standing near the upper daily Bollinger Band.
This resistance zone wad further strengthened by the 38.2% Fibonacci correction of the previous sharp downward impulse from December.
Given the clear daily downtrend, Dogecoin cryptocurrency can be expected to fall to the next round support level 0.2000 (target price for the completion of the active correction ii).