next levels for Dogecoin id very promising honest and well-made TA for doge next levels , with explanations and know how notes full of evedinces with solid knowledg of TA and Volume prifiles with calsics too. btc also , startes is wave D formation upwords, after that a good correction is comming to the market for late entries who did not see our TA's before and now . your support join and share some of a littile bit of your profit will make you make more and safe in this very hard market. peace and stay safe
DOGEUSDT.3S trade ideas
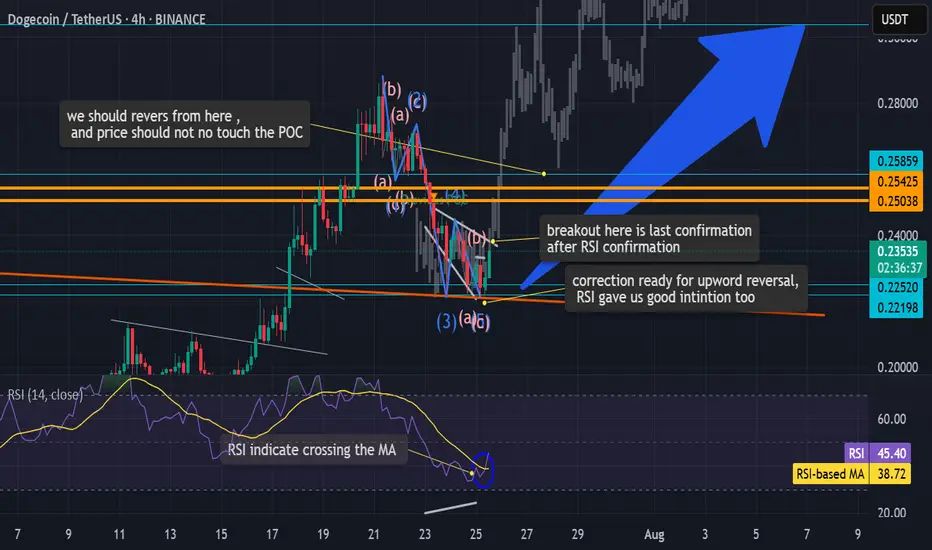
DOGE H4 – Demand Zone Reclaim as Bullish Trigger
Price is currently testing the H4 demand zone (~0.227–0.254).
Watch for price to reclaim the demand zone and close back above 0.254.
If confirmed, expect a move up toward the red resistance cluster at 0.271–0.275.
Consolidation above this area (highlighted in blue) would be a strong signal for continuation.
Invalidation: clean breakdown and acceptance below 0.227 signals failure of demand and deeper retrace.
This setup aims to capitalize on a classic liquidity sweep and demand reclaim. Typically, after taking out the flat open and collecting late shorts/stop losses, strong buying often steps in if demand is genuine. A successful reclaim and consolidation above the previous resistance will set the stage for bullish continuation. If this zone fails to hold, the move is invalidated and lower targets come into play. Waiting for confirmation reduces the risk of a failed bounce.

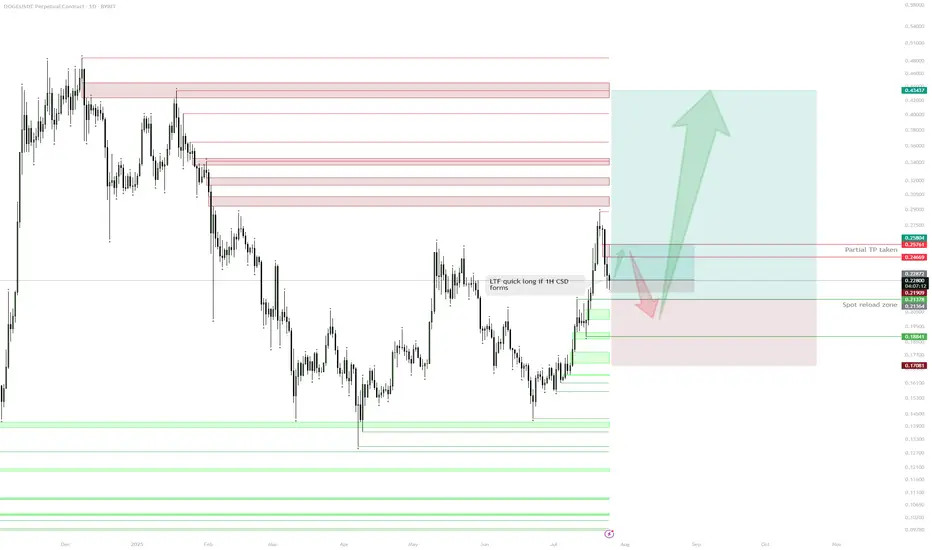
DOGE – HTF Plan & Spot Reload ZoneSpot Position & Realized Profit:
Spot position held from the $0.19 sweep.
Previous long from demand taken and partially realized at $0.26, de-risking the core position.
Current Structure:
After reaching resistance ($0.26–$0.27 zone), price is retracing.
Daily demand/support sits around $0.20–$0.21, with multiple confluences for spot re-accumulation.
Immediate Plan:
Waiting for price to revisit daily demand ($0.20–$0.21) to reload spot and/or open fresh longs.
Watching for a possible lower timeframe (1H) bullish confirmation (e.g., 1H change of structure/1H CSD) as a trigger for a tactical long before daily demand is tagged.
LTF Play:
If price prints a 1H CSD, a quick long up to daily imbalance ($0.24–$0.25) can be considered.
Invalidation:
Loss of daily demand ($0.188) would invalidate the bullish scenario and require re-evaluation.
Upside Target:
If demand holds, looking for moves back into daily supply/imbalance, with ultimate HTF targets at $0.26, $0.32, and higher.
Reasoning:
The core plan is to build spot exposure at strong demand after de-risking on the first move up. The context is that DOGE has shown willingness to bounce at major demand, and with realized profits in the pocket, risk can be managed comfortably on new entries. Short-term, LTF confirmation (such as a 1H CSD) can offer a tactical long back into daily imbalance before the main reloading zone is tagged. Patience and precise triggers are key—no need to rush until price action confirms.
Dogecoin (DOGE): Breakout Happened | Another 200% Incoming!Dogecoin has had a really good rally so far, but that's not all; we might see another 200% movement from the current market price!
More in-depth info is in the video—enjoy!
Swallow Academy

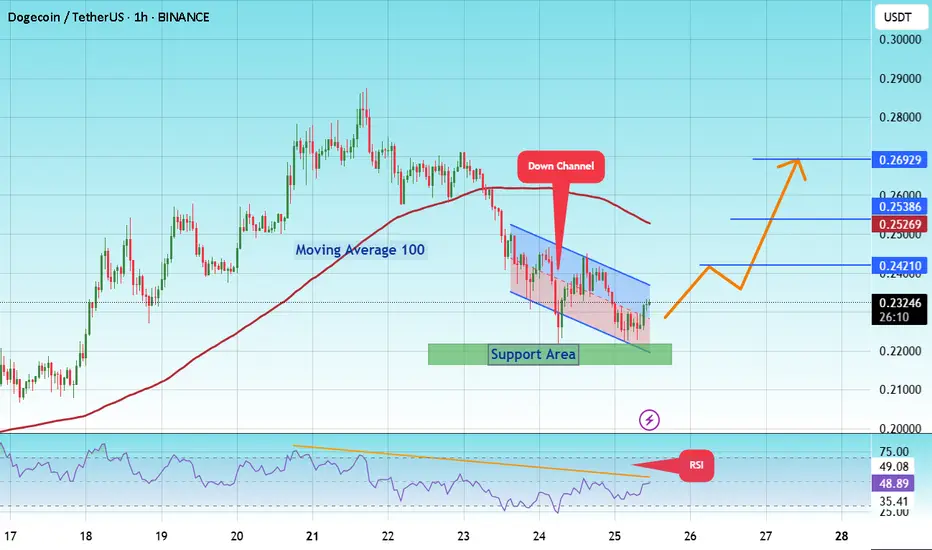
#DOGE/USDT falling wedge#DOGE
The price is moving within a descending channel on the 1-hour frame and is expected to break and continue upward.
We have a trend to stabilize above the 100 Moving Average once again.
We have a bearish trend on the RSI indicator, supporting the upward break.
We have a support area at the lower boundary of the channel at 0.22270, acting as strong support from which the price can rebound.
We have a major support area in green that pushed the price upward at 0.21777.
Entry price: 0.2320
First target: 0.24210
Second target: 0.25380
Third target: 0.26920
To manage risk, don't forget stop loss and capital management.
When you reach the first target, save some profits and then change the stop order to an entry order.
For inquiries, please comment.
Thank you.
DOGE : Idea.Hello, good ? Good.
Enter in doge here is not a bad idea in SPOT.
• Above the last important resistance.
• Retest on 50 Weekly MA.
• Above 50 rsi weekly.
• Bollinger bands in consolidation.
Need to confirm rejection in weekly like always.
If rejectyion here : x2 incoming.
Good luck guys, take care of you.

The Pullback Panic? Your Whole Plan Dies?!!!!!One red candle is all it takes to destroy your entire plan.
Why do we panic so fast? Why do we exit too early before a rally?
And worse: why do we FOMO back in at the worst possible time?
Hello✌️
Spend 3 minutes ⏰ reading this educational material.
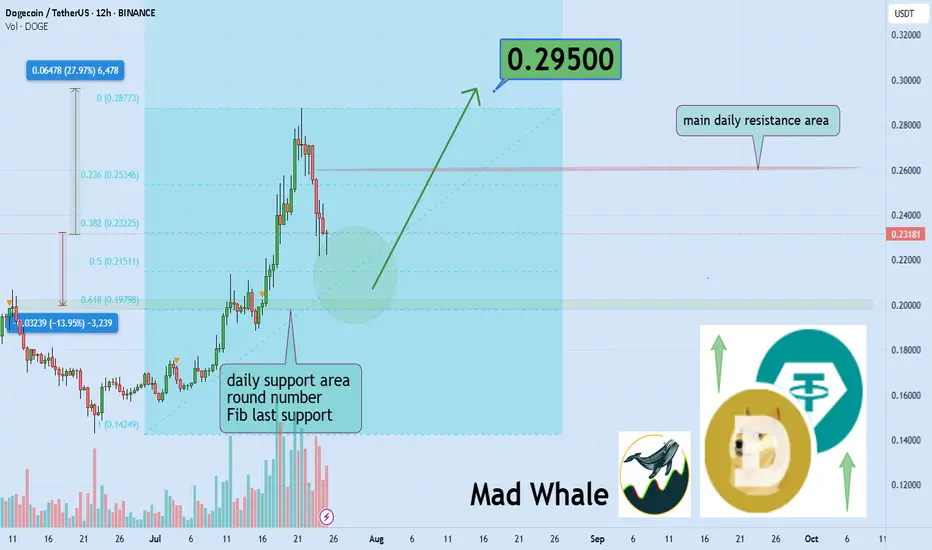
🎯 Analytical Insight on Dogecoin:
BINANCE:DOGEUSDT is approaching the key psychological level of 0.20, which also aligns with a strong daily support and the final Fibonacci retracement zone 🧭. Despite recent volatility, it continues to hold its mid-range Fib level, suggesting potential accumulation. If this support holds, a rebound toward the 0.30 resistance — a move of around 27% remains on the table 🎯.
Now , let's dive into the educational section,
🧠 The Victim Mindset in Crypto Markets
Here’s the uncomfortable truth.
Most traders believe they’re making rational decisions but in reality, they’re reacting emotionally to past pain.
One bad experience during a correction makes us fear all pullbacks.
Missing one big rally creates constant FOMO.
We can’t handle drawdowns but we accept buying tops again and again.
It’s not just you. This is how most retail traders operate and whales know it.
🐳 How Whales Profit From Our Fear
Whales never buy during hype. They buy during fear.
Mini pullbacks, shakeouts and false breakdowns are designed for one thing.
To make you exit so they can enter.
A red candle, a small wick, maybe a fake support break.
We sell out of fear, they buy the dip.
We FOMO back in too late.
Pullbacks are not just price moves. They are psychological traps.
📈 How to Break This Cycle
You don’t need to predict the future. You need to understand yourself.
Ask if this correction is technical or emotional.
Use confirmation from volume, OI and divergence.
Enter after traps, not inside them.
Question your feelings before every move.
You are not trading the chart. You’re trading your mind reacting to the chart.
📊 TradingView Tools to Escape the Fear Greed Cycle
TradingView gives you access to several practical indicators that can help protect your capital from emotional decision-making.
🔹 Fear and Greed Index (Crypto)
Simple but powerful. When the index drops below 30, most traders are in panic mode. That is exactly where whales accumulate, while we run away.
🔹 Open Interest Heatmaps
When open interest rises but price stays flat, it often signals an upcoming shakeout. One scary-looking red candle and the weak hands are gone.
🔹 Volume Profile and VPVR
Perfect for distinguishing between healthy corrections and manipulative dumps. If price pulls back but buying volume remains strong, it's not a real sell-off. It’s a trap.
🔹 Divergence Indicators like MACD or RSI
If RSI rises during a pullback, there’s a hidden bullish divergence. Exiting may be the worst thing to do.
🔹 Liquidity Maps
These show where stop losses and liquidation clusters are located. Often before any major move up, the market takes a detour to liquidate these levels.
Use these tools to stop reacting emotionally and start trading rationally.
📍 Final Thoughts
Small corrections are not the enemy.
Your emotional reaction to them is the real threat.
Before you panic-exit, ask yourself if this fear is justified or just mental conditioning.
The market always gives second chances but we rarely wait for them.
✨ Need a little love!
We pour love into every post your support keeps us inspired! 💛 Don’t be shy, we’d love to hear from you on comments. Big thanks , Mad Whale 🐋
📜Please make sure to do your own research before investing, and review the disclaimer provided at the end of each post.
DOGEUSDT at a Make-or-Break Level: Bounce or a Breakdown?📉 Overview:
After a strong rally from the $0.13 zone to a recent local high of $0.272, DOGE is now undergoing a healthy correction. The price has retraced to a critical Fibonacci Golden Pocket zone (0.5–0.618) between $0.21609 and $0.20222 — historically one of the most powerful zones for market reactions.
This area also aligns with a previous resistance zone that is now being retested as support — a classic SR Flip (Support/Resistance Flip).
---
📌 Key Technical Structure:
🔸 Support & Demand Zone (Golden Pocket):
$0.21609 (Fib 0.5) and $0.20222 (Fib 0.618) – key retracement levels of the recent bullish swing.
Acts as a confluence zone with horizontal support from prior consolidation.
🔸 Major Resistance Levels:
$0.24472 – immediate resistance to reclaim.
$0.27237 – recent high and a major supply zone.
$0.31057, $0.33624 – historical distribution zones.
$0.41366 – breakout confirmation zone for a full trend reversal.
---
🧠 Market Psychology & Patterns:
Breakout & Retest: DOGE recently broke out from a long-term range and is now retesting the breakout zone.
Potential Bull Flag or Descending Channel: Current pullback resembles a flag or bull pennant — both continuation patterns if confirmed with volume.
---
✅ Bullish Scenario (Bounce):
If DOGE holds the Golden Pocket ($0.216–$0.202) and prints a strong bullish reversal candle:
A bounce may push price back to $0.244, and if reclaimed, back to $0.272.
A confirmed breakout above $0.272 with volume could lead to:
Mid-term targets: $0.310 → $0.336 → $0.413 → $0.466.
📈 Confirmation: Daily candle close above $0.244 with rising volume.
---
❌ Bearish Scenario (Breakdown):
If price fails to hold above $0.202 and breaks below with daily close:
It signals invalidation of the bullish structure and possible reversal.
Downside targets:
$0.186 – short-term support.
$0.150 – psychological support.
$0.129 – Year-to-date low (YTD Low).
This would also form a Lower High – Lower Low structure indicating a shift to a bearish trend.
---
🔍 Volume & Momentum Clues:
Watch for volume spikes near $0.202–$0.216.
Strong green candle + volume = likely reversal.
Weak reaction or breakdown on low volume = potential continuation downward.
---
🎯 Trader Playbook:
Signal Action Target
Bounce from $0.216–$0.202 Long Entry $0.244 – $0.272
Daily close below $0.202 Short / Avoid Longs $0.186 → $0.150
Breakout above $0.272 w/ volume Breakout Entry $0.31 → $0.336 → $0.41+
---
🏁 Conclusion:
DOGE is currently at a critical inflection point. The Golden Pocket zone will likely determine whether bulls are accumulating for another leg up or bears are about to reclaim control.
💡 This is a time for strategy, not prediction. Wait for confirmation before committing to either direction. The market is speaking — all we have to do is listen.
---
📊 Chart Summary:
Timeframe: Daily (1D)
Pattern: Breakout Retest + Fibonacci Retracement + Bull Flag
Structure: Higher High – looking for Higher Low confirmation
#DOGEUSDT #Dogecoin #CryptoTA #GoldenPocket #AltcoinAnalysis #FibonacciTrading #BreakoutSetup #BullishContinuation #BearishReversal


Doge is ready to complete double bottom!I'm closely monitoring DOGE as it approaches a critical technical zone. Based on recent price action and volume behavior, there’s a strong possibility to pump!
DOGECOIN : Should we expect an increase?Hello friends🙌
📈Given the decline we had, you can see that buyers entered at the specified support and formed a double bottom reversal pattern, which is a strong signal on support.
📉Considering the possible market correction, we placed two more buy levels lower so that we can buy there if the price corrects.
⚠Don't forget about capital and risk management, friends.
🔥Follow us for more signals🔥
*Trade safely with us*


DOGE Swing Trade – Key Support in PlayDOGE is currently holding a major support zone, offering a strong risk-reward opportunity for a long swing position. With bullish sentiment and meme coin narratives returning, this level is worth watching for upside continuation.
📌 Trade Setup:
• Entry Zone: $0.23 – $0.24
• Take Profit Targets:
o 🥇 $0.27 – $0.28
o 🥈 $0.37 – $0.44
• Stop Loss: Just below $0.215
Dogeusdt bullish iH&S/cup&handle pattern in daily tfForming a bullish pattern and a close above 0.206 in daily time frame may activate the pattern.
Targets are 0.225, 0.255 and 0.29
Invalidation below 0.1886

DOGE/USDT -1H "Dogecoin Fakeout? 🚨 Liquidity sweep followed by a bearish break – Smart money eyes the FVG for re-entry. Targeting the demand zone below. Patience is profit. 💰📉"

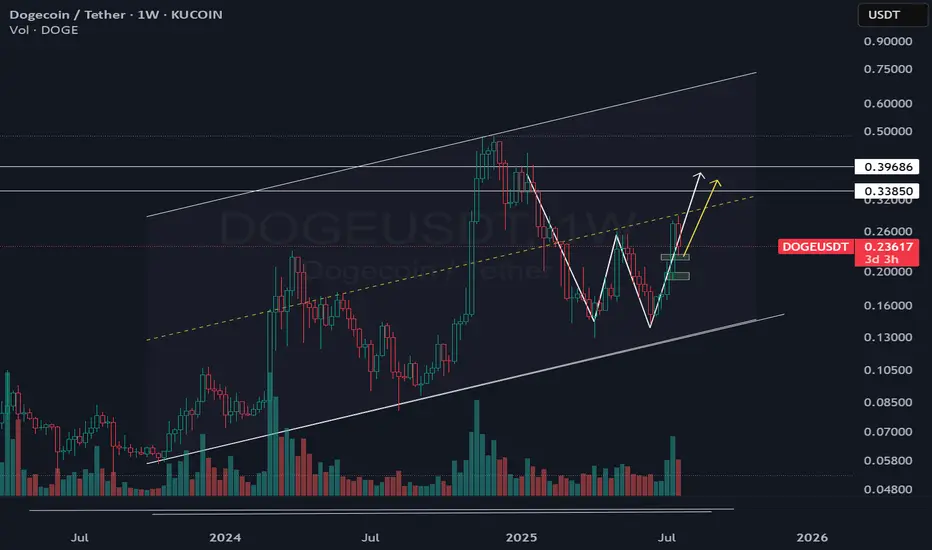
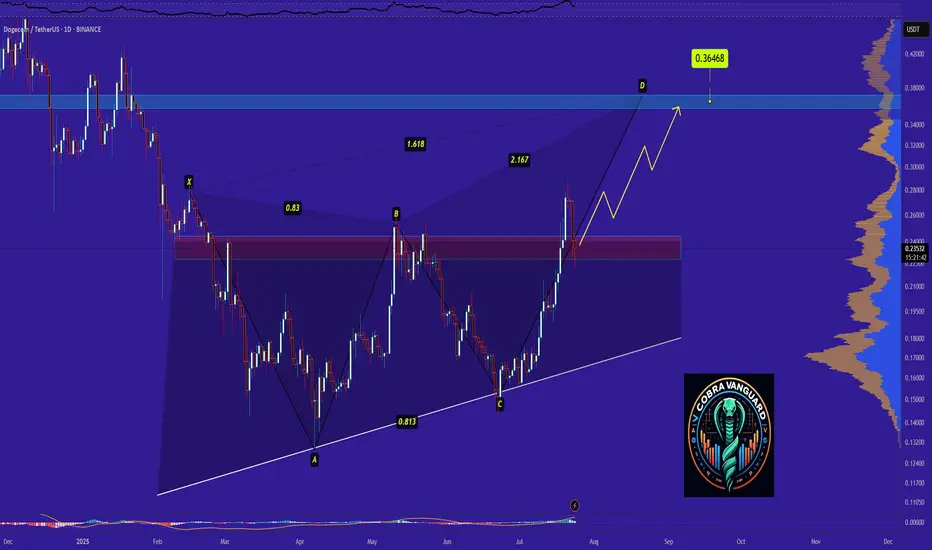
Dogecoin Ready for PUMP or what ?Dogecoin has completed and broken the ascending triangle in the daily timeframe, The price is currently supported well, which can increase the price. I expect the price to rise to around 0.36 .
Stay Awesome , CobraVanguard

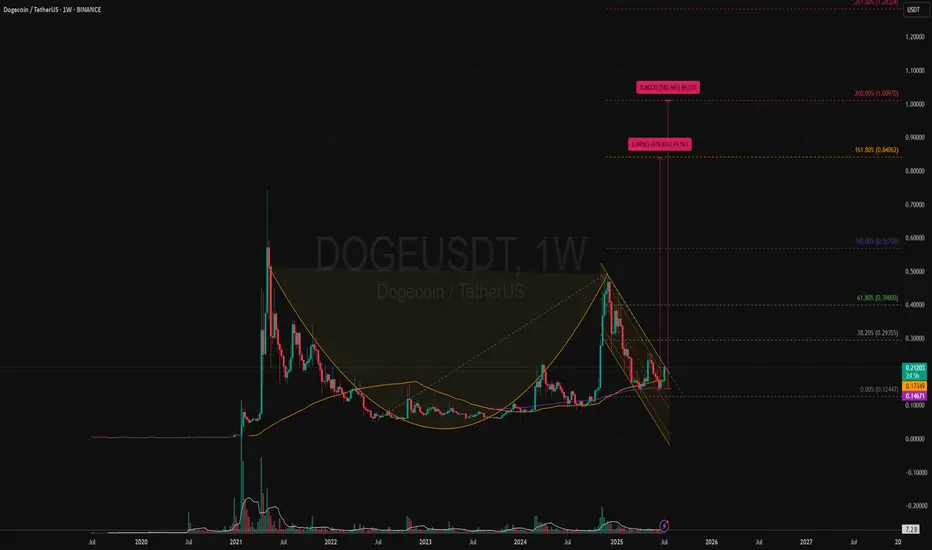
DOGEUSDT | Bullish Cup & Handle Revisiting Target +500% (1 USD)?Price Action and Chart Pattern Analysis:
DOGE cup bottom happened around $0.05 with the rim around $0.48. That gives a depth of roughly $0.42. If the breakout occurs near the rim, the measured move target would be $0.90 zone.
This aligns with several analyst projections suggesting DOGE could reach $0.90 to $1.00 if the breakout confirms.
Another way to project this cup & handle is the fibonacci-based target. These levels suggest that if DOGE breaks above the handle and sustains momentum, $0.85–$1.00 is a realistic zone for profit-taking at 161.8% and 200% extension as 1-2-3 wave pattern.
Reliability of the Cup and Handle Pattern for DOGE
The cup and handle is a classic bullish continuation pattern, but when applied to Dogecoin, its reliability depends on several dynamic factors:
Strengths of the Pattern in DOGE’s Context
Historical Accuracy: DOGE has previously respected technical patterns like rounded bottoms or (THE CUP) and breakout channels (THE HANDLE), especially during alt coin rallies.
Current Setup: a well-formed cup and handle on DOGE’s weekly chart, with price rebounding from $0.14 and testing resistance at $0.2 zone which also the key resistance SMA50W and the downtrend channel (the handle)
WATCH OUT: still a possible throw-under pattern or a final bear trap liquidity below previous low!
Key Action: If breakout confirmed with volume > Follow BUY | if not, wait for retraced SMA20 or breakout support.
Always trade with affordable risk and respect your stop...
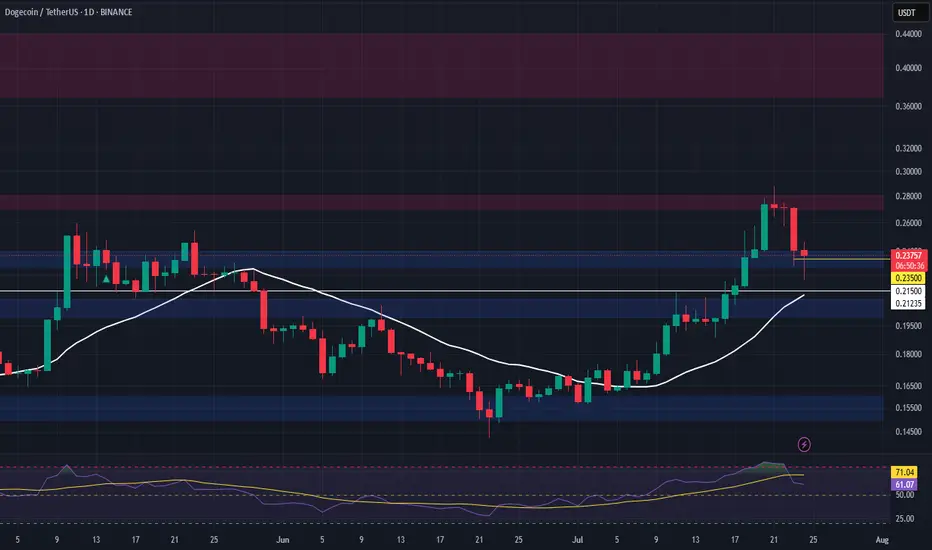
accumulation phase means bullish sentiment We are seeing a bullish scenario in an accumulation phase, we should be seeing doge test the 200 ema before bouncing back or test the 20 ema before bouncing back. we see a change in character which as short lived after a day's breakout. After a 7 day's rally after breaking out of the 200 ema, we see a pull, I THINK WE SHOULD BE SEEING MORE OF THAT UNTIL BUYERS ARE CONVINCED THE MARKET IS NOT JUST FOLLOWING THE SUMMER RALLY TREND

Trading plan for DOGELast week, BINANCE:DOGEUSDT rode the market wave with solid gains. Now we're in a correction phase, sitting right at the weekly pivot point. Here's the breakdown:
Upside potential: Needs to cleanly break and hold above $0.257 to target new local highs
Current reality: While below the weekly pivot, odds favor more downside toward $0.20
Trade the reality until the market proves otherwise. Watch those levels and let price lead the way.

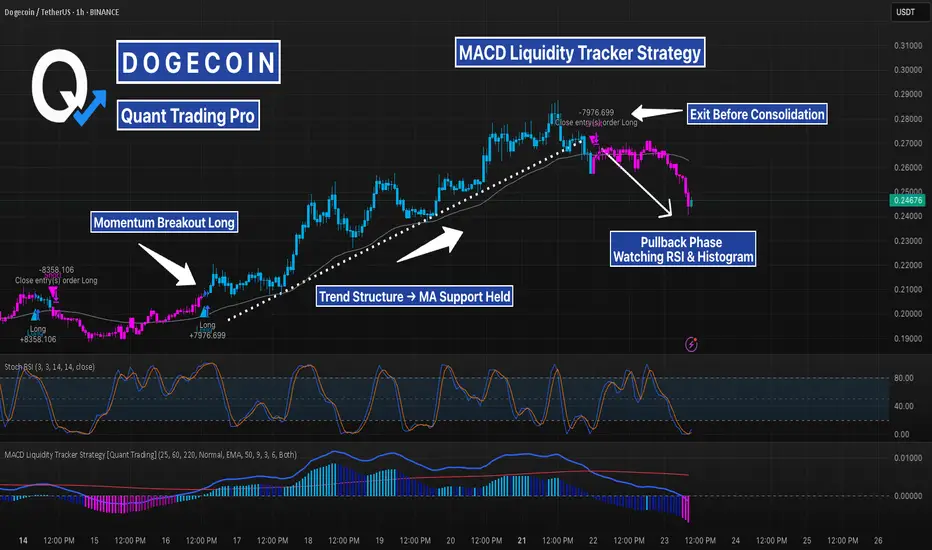
DOGE Strategy — Momentum Entry, MA Trend Hold, Pullback PhaseThis chart showcases how the MACD Liquidity Tracker Strategy performed on DOGE over the past several days. The strategy entered during a clear momentum breakout and trended cleanly above its MA filter for nearly 48 hours.
Let’s break it down:
🔹 First Signal: Early compression breakout long, but price stayed flat. This entry was managed with a tight close before the second impulse began.
🔹 Second Long: Clean breakout on rising momentum — confirmed by MACD histogram expansion and strong Stoch RSI crossover.
🔹 Trend Structure: MA support held multiple times during this move, reinforcing the uptrend. Dotted trendline shows price respecting structure cleanly.
🔹 Exit Trigger: Price began consolidating and histogram showed waning momentum. The strategy correctly exited before the full reversal began.
🔹 Current Action: Pullback in progress. MACD histogram flipping red, Stoch RSI resetting. This may just be a correction… or the trend might be breaking.
📊 This setup is a textbook use of trend filters, confluence, and exit logic — and a good reminder that the strategy isn’t just about entry… it’s about managing exits with discipline.
Whether this develops into a higher low continuation or rolls into full reversal, momentum confirmation is key before the next entry.
#DOGE #TradingStrategy #AlgoTrading #MACDStrategy #QuantTrading #CryptoTechnicalAnalysis #PriceAction #TrendFollowing #Backtesting #CryptoCharts
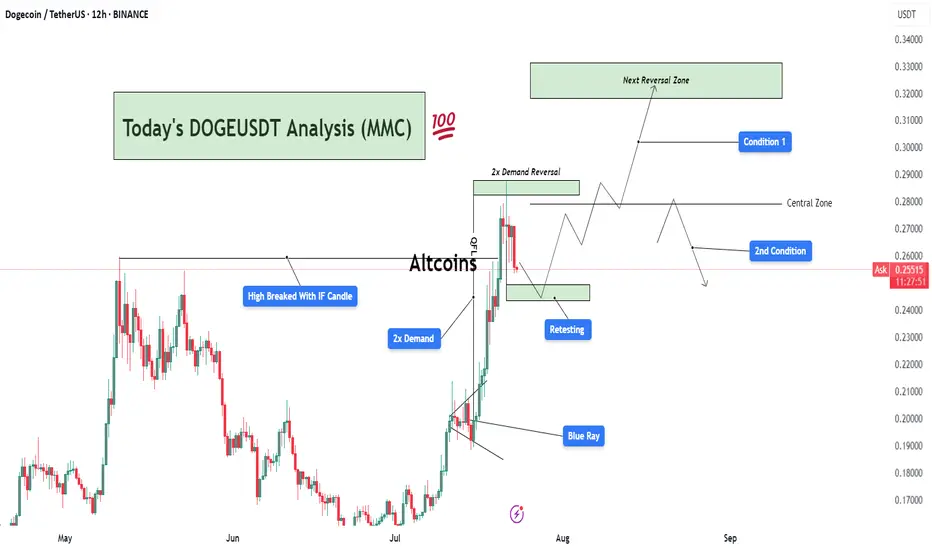
DOGEUSDT Analysis : Demand Zone Retest Before New Highs Target📊 Overview:
Today's DOGEUSDT analysis (12H chart) under the Mirror Market Concept (MMC) framework reveals a potential bullish continuation or corrective phase based on two major conditions. The market structure is transitioning after a strong impulsive move, triggered by a 2x Demand Zone breakout, and is now in the retesting phase.
🔍 Key Technical Breakdown:
High Broken with IF Candle:
A significant previous swing high was broken decisively by an Initiation Flow (IF) candle, indicating institutional activity or aggressive buying pressure.
This confirms a shift in market structure toward a bullish trend.
2x Demand Zone:
This zone has served as a strong base for price accumulation and an impulsive breakout.
The market responded well with a sharp rally post this demand, validating it as a critical support.
Blue Ray Zone (Support Zone):
The bullish breakout was partially driven by this inner trendline zone (referred to as Blue Ray), where price respected the rising support channel before breakout.
This shows smart money liquidity engineering prior to the breakout.
Retesting Zone:
Currently, the price is retracing toward a previously broken demand zone.
If this zone holds, it could provide an optimal entry for continuation.
📈 Two Scenarios (Conditions):
✅ Condition 1: Bullish Breakout to Next Reversal Zone
If the retest holds and price prints bullish confirmation (e.g., engulfing or pin bar), we can expect price to move up toward the next key reversal zone between $0.3100–$0.3300.
This zone is marked as a potential supply/reversal zone, where large sell-offs may occur.
This path follows the continuation structure under MMC, aligning with trend-following buyers.
⚠️ Condition 2: Failure to Hold Demand → Deeper Pullback
If the current demand zone fails to hold and price re-enters below the central zone (~$0.2700), we could expect a deeper correction.
Price may then revisit lower demand regions, potentially toward $0.2200 or lower, depending on rejection strength.
📌 Important Notes:
The central zone acts as a pivot level, defining whether bulls or bears gain short-term control.
Monitor the reaction from retesting area closely — candle confirmation is key before any trade execution.
This chart follows Mirror Market Concepts (MMC), combining smart money behavior, demand/supply reversal logic, and psychological market zones.
💬 Final Thoughts:
DOGEUSDT is currently in a critical phase. The market has shown strength, but now it's about confirmation. Patience is key — wait for a clean break or rejection around the retesting zone to determine the next direction. The analysis favors bullish continuation, but being flexible with both scenarios gives traders an edge.
$DOGE Daily [Descending Triangle Breakout] Structure: Descending Triangle into Breakout
Duration: ~9 months (October 2024 – July 2025)
🟩 Breakout Level:
→ $0.24
🟩 Fib-Based Targets:
→ $0.28 (0.5 fib)
→ $0.32 (0.382 fib)
→ $0.38 (0.236 fib)
→ $0.48 (full move completion)
🟥 Invalidation: Close below $0.22 would invalidate the breakout and re-enter previous consolidation zone
Strong volume expansion. Breakout clean. Momentum trending upward post-retest with no immediate overhead resistance until $0.32
Textbook pattern resolution with major upside room — meme king waking up again.
#DOGE #Altseason #MemeCoin #DOGECOIN
