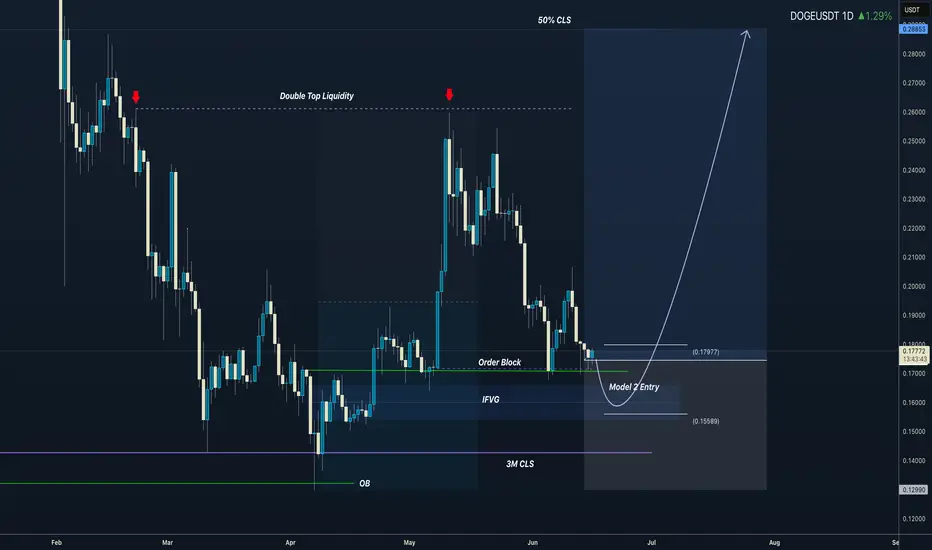
3M CLS I KL - OB I Model 2 I Targe 50% CLSHey, Market Warriors, here is another outlook on this instrument
If you’ve been following me, you already know every setup you see is built around a CLS Footprint, a Key Level, Liquidity and a specific execution model.
If you haven't followed me yet, start now.
My trading system is completely
DOGE: A Reversal In Development?Im monitoring for something like this on DOGE with the plan to DCA as it takes SSL and comes into the range low and demand.
Looking a little weak here with signs on majors of weakness, i can see this going into the SSL and lower demand areas marked.
Still seeing this as a large range development a

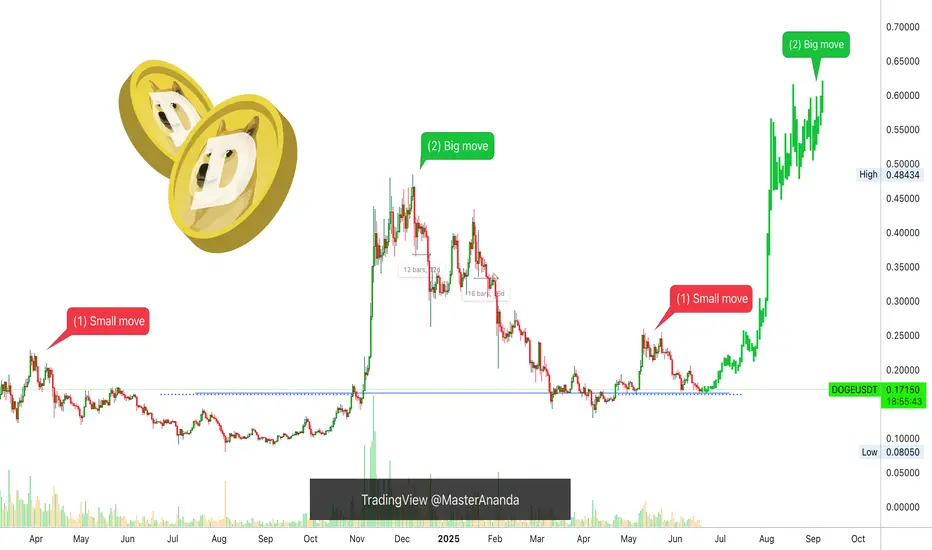
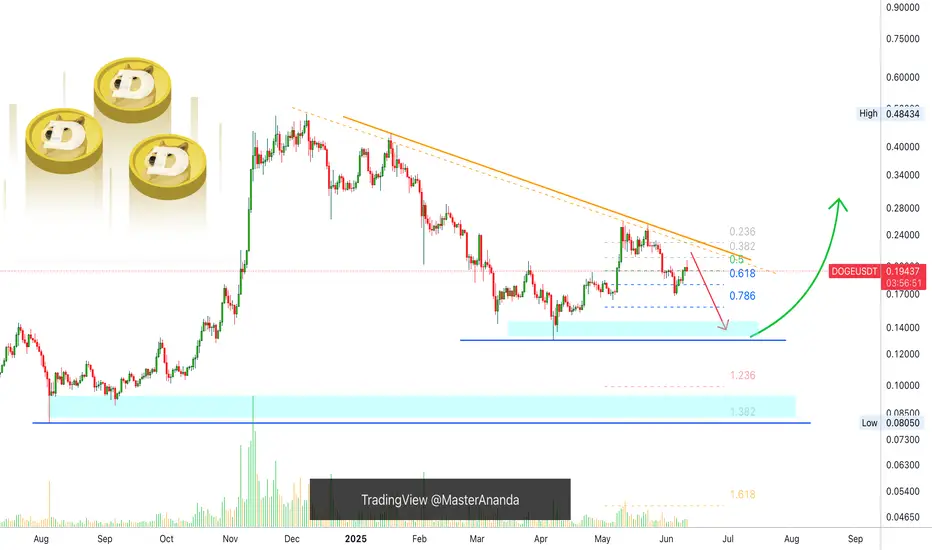
Dogecoin: Small Move, Big Move, What Will You Do?All gains have been removed, most of them. Dogecoin hit yesterday the same level from 6-May. This level was the base that propelled prices to 0.26000. From this high point 11-May, we witnessed a correction lasting more than a month. Total drop amounts to 36.9% (-37%).
Size and duration
» From 6
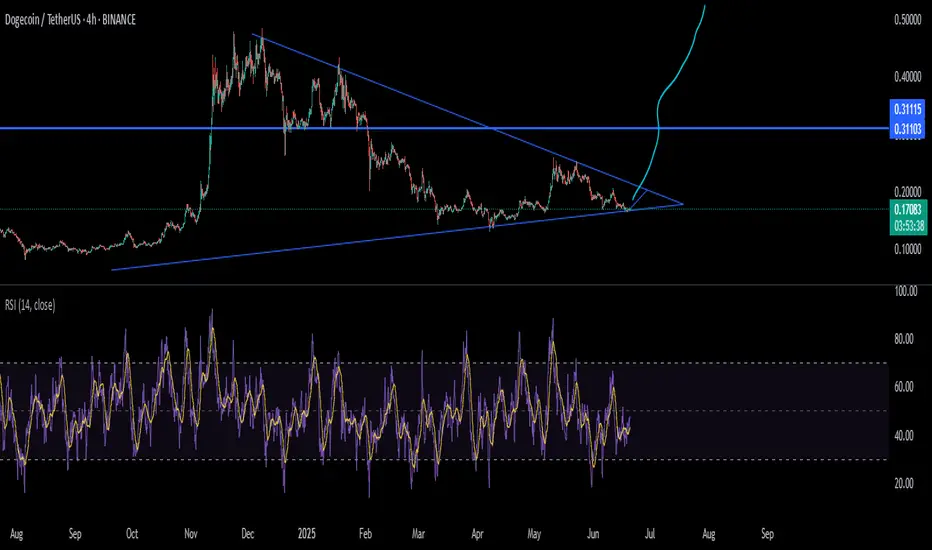
Doge will dodge buyers ?Pattern Observed:
The chart shows a rising wedge that broke to the downside, a bearish continuation pattern.
Price attempted a retest to the wedge's base (marked in red zone), which aligns with lower highs — a strong sign of bearish rejection.
Key Zones:
Red Zone (Supply Zone / Resistance): Around
Everything Looks Fine Until You're Liquidated Ever felt like the market is calm and steady, then boom — everything crashes?
Everything seems fine … until one liquidation candle slaps you awake.
This analysis explores how the illusion of safety can destroy your capital — and how to use TradingView tools to stay ahead.
Hello✌
Spend 3 minut
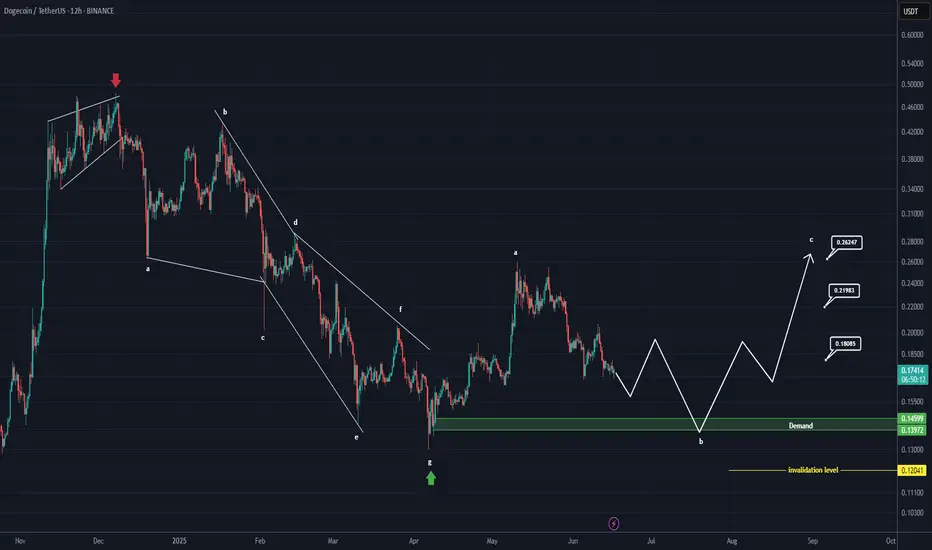
DOGE/USDT trade planThe chart shows a completed WXY correction followed by a triangle (ABCDE), marking the end of the larger correction at Wave 2.
Currently, Wave 3 is underway, with potential to enter the explosive sub-wave 3 of 3 soon. it will be the runner don't forget this coin
32RR trade setup
Entry Zone (Buy Are
Dogecoin Bearish But...Yes, Dogecoin is bearish now but this is only a short-term situation, it is the end of a long-term correction. Notice the chart, Dogecoin has been producing lower highs long-term, since December 2024.
Recently, there was a major low in April and then a recovery and after this recovery we have local
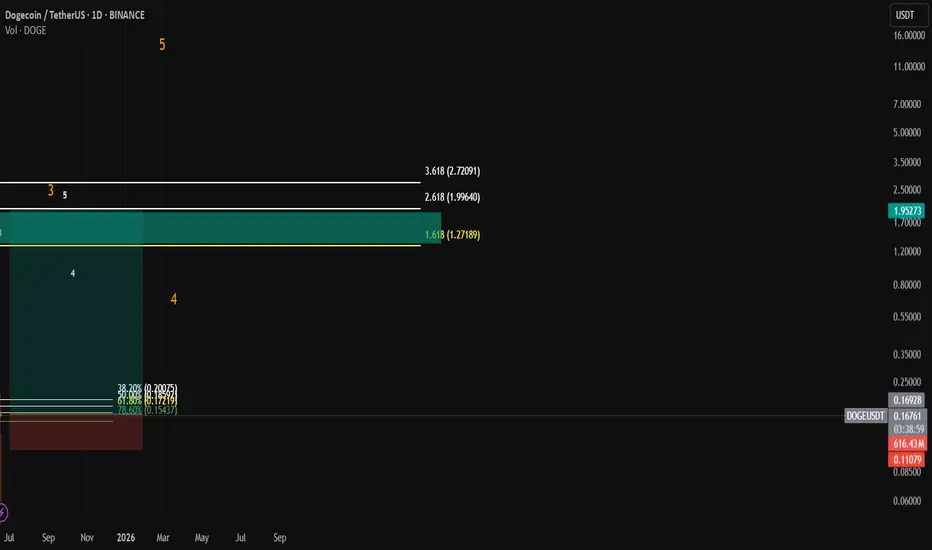
Dogecoin Weekly, Bullish Update —1,2,3,4,5 SequenceJust to make sure we have a little bit of everything, here we have Dogecoin sandwiched in-between EMA34 and MA200.
» XRP is trading above these two levels.
» ADA is trading below.
» ETH is trading above.
» BTC is mixed.
Seeing DOGE in-between can reveal a few things.
No drama, MA200 will hold.
MA

DOGE ANALYSIS (12H)Based on the current available data, it appears that Dogecoin has entered a bullish phase after completing the diametric pattern marked on the chart. We are currently in wave B of this bullish phase.
Wave B may complete within the green zone, which is a key support area.
The targets for wave C hav
See all ideas
Summarizing what the indicators are suggesting.
Oscillators
Neutral
SellBuy
Strong sellStrong buy
Strong sellSellNeutralBuyStrong buy
Oscillators
Neutral
SellBuy
Strong sellStrong buy
Strong sellSellNeutralBuyStrong buy
Summary
Neutral
SellBuy
Strong sellStrong buy
Strong sellSellNeutralBuyStrong buy
Summary
Neutral
SellBuy
Strong sellStrong buy
Strong sellSellNeutralBuyStrong buy
Summary
Neutral
SellBuy
Strong sellStrong buy
Strong sellSellNeutralBuyStrong buy
Moving Averages
Neutral
SellBuy
Strong sellStrong buy
Strong sellSellNeutralBuyStrong buy
Moving Averages
Neutral
SellBuy
Strong sellStrong buy
Strong sellSellNeutralBuyStrong buy
Displays a symbol's price movements over previous years to identify recurring trends.