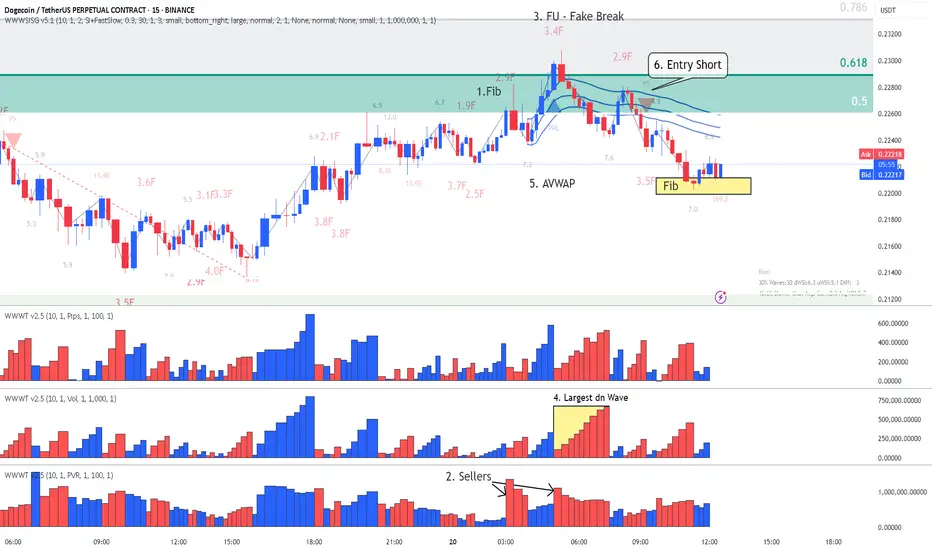
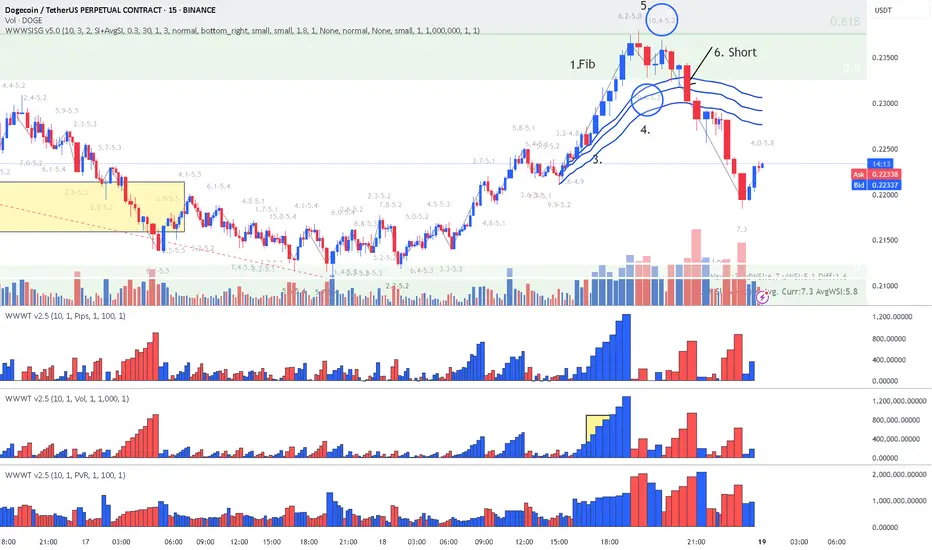
DOGE - Entered Short using Lesson 15 MethodologyThis is how I read the chart using Lesson 15 Methodology:
1. Fib Location (sellers might enter)
2. Sellers started to be visible on PVR when price entered Fib 50-61.8 area and on the break of 61.8
3. FU - Fast Up wave - Fast SI of 3.4F and that's our Fake break of Fib
4. After the false break we have the highest down volume wave, that's another indication of sellers
5. Placed AVWAP at the beginning of the fast wave and wait for the price to cross downwards, then pullback and respect AVWAP as resistance.
6. Entry Short of PS (Plutus Short) signal
I have already moved my order to Break-Even because are entering another Fib location.
I hope this helps. Enjoy!
DOGEUSDT.P trade ideas
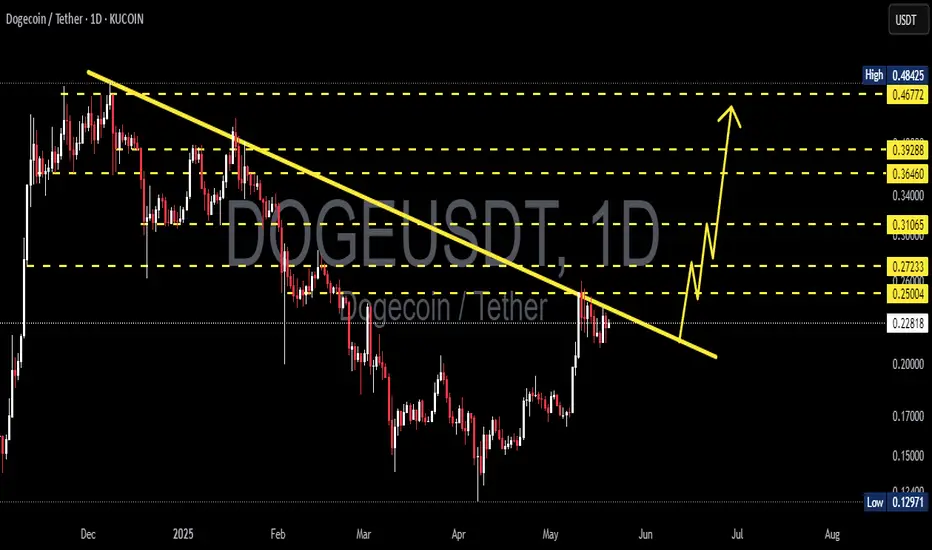
DOGEUSDT 1D Analysis DOGE ~ 1D Analysis
#DOGE Buy after successfully breaking this resistance line with a short term target of at least 10%+ from here.
Doge updateHi traders today I wanna ask you a question?what makes you force a market to sell while market is trying to breakout n promising but hence just to see small pull back n findout that someone draw n arrow going down 100% after _50% drop what's that,what makes people's not following the right trend n few of us constantly following them n winning always ask yourselfs that question after that findout the trend before predictions ,either it's down trend,uptrend or range market,then make sureyou follow the trend n don't mess up with because of temporary pull backs find it n follow it don't overthink maintain the trend n it's pull backs,am a buyer here and am not going to sell anything cz of small pull backs not even a single day,I wish you all the best open your eyes
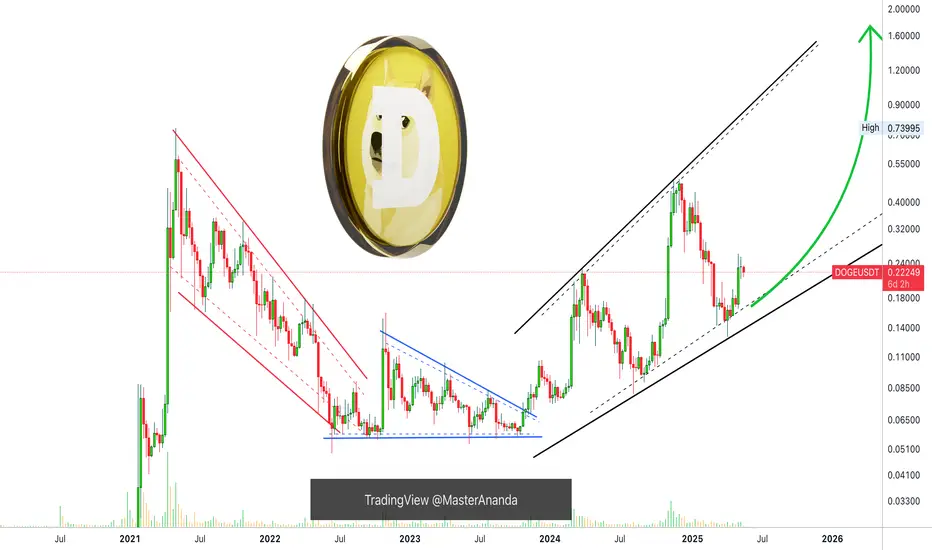
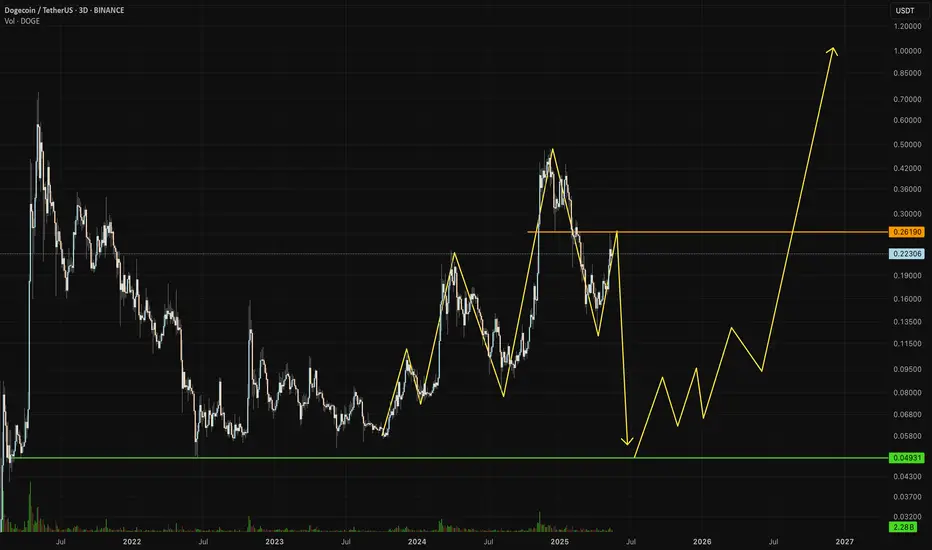
Dogecoin: 10 Years Long Uptrend?Dogecoin bottomed June 2022 but bullish action, the uptrend, actually started in October 2023. Notice the chart with the clear rising channel. Who is to say that such a channel will not continue for ten years or more?
Market dynamics were very difference just two years ago, let alone 5 years ago or 10 years ago when only Bitcoin was around.
The Cryptocurrency market is growing and changing, evolving, and this evolution will definitely be reflected on the chart. The chart is the price. Price dynamics will forever change for the better.
Popular wisdom. As a market becomes older, it becomes more stable but it continues with its general long-term trend; growth.
We are a growing market and growth cannot be stopped. You either have growth or decay. We are growing and will continue to grow long-term. 100% certain because Cryptocurrency is not just a new form of finance, a new money, Cryptocurrency is the technology of the new generation, the future. Instead of paper, digital, your screen.
Since Cryptocurrency is a reflection of us human beings and we are now on an accelerated path toward growth, the market will follow; We are going up!
Bet LONG, buy spot and hold or do anything that is necessary to get your hands on some Crypto. The stock market is old and for this reason it now only pays around 7% (after fees and taxes). Crypto is young and for this reason it pays 300% (in the cloud, the Internet, global —better for taxes).
The future is freedom of expression, freedom of finance and freedom of choice. With Cryptocurrency, you can choose the type of money you can use and own.
Namaste.
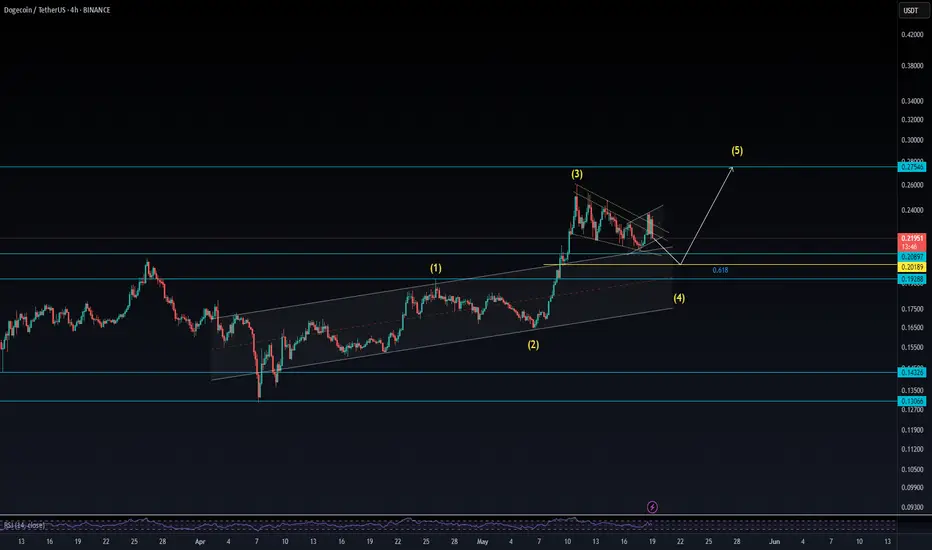
Doge / USDTPrice appears to be correcting within Wave 4, and there's a possibility of a pullback toward the 61.8% Fibonacci retracement level. I'm watching the 0.202 area for any signs of support or a bullish reaction, as it could mark the end of Wave 4 and the beginning of Wave 5.
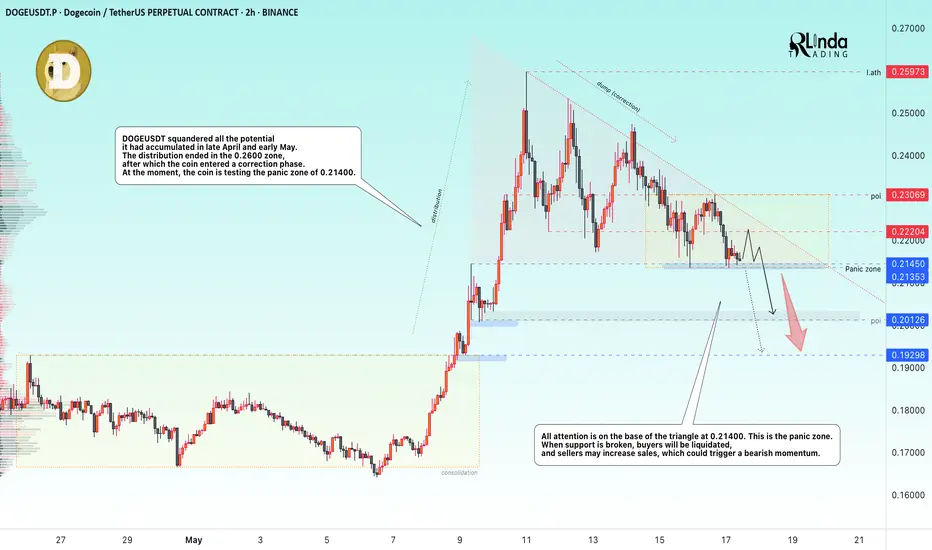
DOGE → Retest of the panic zone. One step away from a downtrendBINANCE:DOGEUSDT.P is facing selling pressure. After distribution (pump), the price enters a correction phase (dump) and storms the panic zone, a breakout of which could intensify an uncontrolled decline.
DOGEUSDT squandered all the potential accumulated in late April and early May. The distribution ended in the 0.2600 zone, after which the coin entered a correction phase. At the moment, the coin is testing the panic zone of 0.21400
All attention is on the base of the triangle at 0.21400. This is the panic zone. When the support breaks, buyers will be liquidated, and sellers may increase sales, which could trigger a bearish momentum.
Resistance levels: 0.222, 0.2307
Support levels: 0.2145, 0.2135
The main idea is a continuation of the decline. The trigger is a breakdown of support at 0.2135 and consolidation of the price below this zone, only in this case will the price continue to fall.
!!! The structure will be broken if the price reverses and consolidates above 0.222 and confirms the bullish sentiment with price consolidation above 0.23, in which case we will again consider growth.
Best regards, R. Linda!
How to read Speed Index and Identify Potential Reversals!In this chart we removed all Plutus signals and we are reading just Speed Index and weighted Averaged Speed Index. The purpose is to identify a potential reversal at a significant location such as Fib.
There are two numbers visible on every price wave swing, the first one is the wave's Speed Index and the second one is the weighted average Speed Index of the 30 waves back.
What do we need to identify for a potential reversal? The answer is Abnormal Speed Index compared to the weighted average Speed Index, which means that something is cooking.
Reading the chart:
- Look at highest volume up wave hitting the Fib area, Speed Index at 6.2 while the average at 5.0 , higher than the average but not too abnormal.
- The next down wave is where it gives you an Abnormal Speed Index of 10.4 with an average of 5.2. This is what we call their first Push Down, now definitely something is cooking.
- The next up wave has a Speed Index 10.4 (Abnormal) with an average of 5.2 and that's we call a Hard to Move Up Wave (HTMU).(by coincidence these two waves have the Speed Index and average Speed Index)
- Finally to make sure that all these were sellers we need price to break these waves.
To Summarize this is how we approach this Short trade (annotations are in sync with chart).
1. Fib Location (potential sellers might enter)
2. The highest volume up wave to get to Fib
3. Placed AVWAP at the beginning of this up wave, because we will go short if price goes below AVWAP with the appropriate Speed Index justification.
4. First Push Down wave with SI 10.4 with AvgSI at 5.2
5. HTMU (Hard to Move Up) wave with SI 10.4 with AvgSI at 5.2
6. Our entry Short breaking the structure of the previous waves and cross AVWAP downwards.
I hope this helps all you Weis Wave Speed Index owners. Enjoy!!!
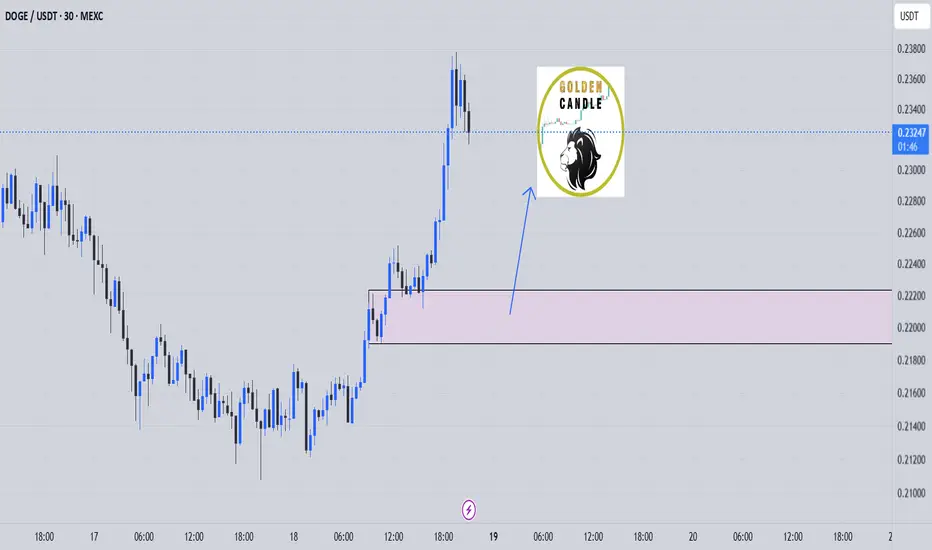
doge buylimit midterm"🌟 Welcome to Golden Candle! 🌟
We're a team of 📈 passionate traders 📉 who love sharing our 🔍 technical analysis insights 🔎 with the TradingView community. 🌎
Our goal is to provide 💡 valuable perspectives 💡 on market trends and patterns, but 🚫 please note that our analyses are not intended as buy or sell recommendations. 🚫
Instead, they reflect our own 💭 personal attitudes and thoughts. 💭
Follow along and 📚 learn 📚 from our analyses! 📊💡"
DOGEUSDT - Worth to Take Some RisksBINANCE:DOGEUSDT — Buyer Stepping in After the Sweep?
BINANCE:DOGEUSDT just pulled a textbook move I’ve seen play out hundreds of times — swept a key low, triggered stops, then snapped back up. That’s never accidental.
I’ve been watching this carefully, and I believe we just entered an area with a real buyer behind it.
🔵 Blue Box: Hidden Demand Zone
Price made a new local low, then quickly reversed, printing a bullish engulfing candle on high volume — but here’s what matters more:
On the drop, CDV didn’t follow. That’s a subtle but powerful divergence that shows aggressive selling wasn't truly present — just a liquidity sweep.
Now price is hovering above that zone. This blue box is where I believe the real position was built. If we come back down and test it with weak selling and small-bodied candles, I’m looking for an entry.
🔁 Game Plan
If price pulls back into the blue box and shows buyer defense on the 1m/5m, I’ll enter long. Simple.
If we break lower again but reclaim the box with force and retest it cleanly, I’ll also long that reclaim.
No long if the zone breaks cleanly and volume confirms the breakdown — I’ll reassess for shorts only if it retests from below.
I will not insist on my long idea.
If this level gives way and doesn’t reclaim with conviction, I’ll step aside.
But if it reclaims and gives me confirmation, I’ll take it.
📊 Order Flow & Volume
This entire sweep was followed by a volume spike into the low and a delta absorption pattern — price moved down, but aggressive buyers were filling in. That’s never retail.
Now we’re seeing low effort in pushes downward. That’s when traps get set. Don’t be surprised if we see a sharp move upward in the next sessions.
🧠 Final Word
Most traders will only see a “double bottom” if this plays out. They won’t realize the liquidity grab has already happened.
If you ignore this level, you might regret it.
This is how the big moves start — quietly, after the sweep, before the crowd even notices.
And these are the setups that have built my high win rate.
📌I keep my charts clean and simple because I believe clarity leads to better decisions.
📌My approach is built on years of experience and a solid track record. I don’t claim to know it all but I’m confident in my ability to spot high-probability setups.
📌If you would like to learn how to use the heatmap, cumulative volume delta and volume footprint techniques that I use below to determine very accurate demand regions, you can send me a private message. I help anyone who wants it completely free of charge.
🔑I have a long list of my proven technique below:
🎯 ZENUSDT.P: Patience & Profitability | %230 Reaction from the Sniper Entry
🐶 DOGEUSDT.P: Next Move
🎨 RENDERUSDT.P: Opportunity of the Month
💎 ETHUSDT.P: Where to Retrace
🟢 BNBUSDT.P: Potential Surge
📊 BTC Dominance: Reaction Zone
🌊 WAVESUSDT.P: Demand Zone Potential
🟣 UNIUSDT.P: Long-Term Trade
🔵 XRPUSDT.P: Entry Zones
🔗 LINKUSDT.P: Follow The River
📈 BTCUSDT.P: Two Key Demand Zones
🟩 POLUSDT: Bullish Momentum
🌟 PENDLEUSDT.P: Where Opportunity Meets Precision
🔥 BTCUSDT.P: Liquidation of Highly Leveraged Longs
🌊 SOLUSDT.P: SOL's Dip - Your Opportunity
🐸 1000PEPEUSDT.P: Prime Bounce Zone Unlocked
🚀 ETHUSDT.P: Set to Explode - Don't Miss This Game Changer
🤖 IQUSDT: Smart Plan
⚡️ PONDUSDT: A Trade Not Taken Is Better Than a Losing One
💼 STMXUSDT: 2 Buying Areas
🐢 TURBOUSDT: Buy Zones and Buyer Presence
🌍 ICPUSDT.P: Massive Upside Potential | Check the Trade Update For Seeing Results
🟠 IDEXUSDT: Spot Buy Area | %26 Profit if You Trade with MSB
📌 USUALUSDT: Buyers Are Active + %70 Profit in Total
🌟 FORTHUSDT: Sniper Entry +%26 Reaction
🐳 QKCUSDT: Sniper Entry +%57 Reaction
📊 BTC.D: Retest of Key Area Highly Likely
📊 XNOUSDT %80 Reaction with a Simple Blue Box!
📊 BELUSDT Amazing %120 Reaction!
📊 Simple Red Box, Extraordinary Results
I stopped adding to the list because it's kinda tiring to add 5-10 charts in every move but you can check my profile and see that it goes on..
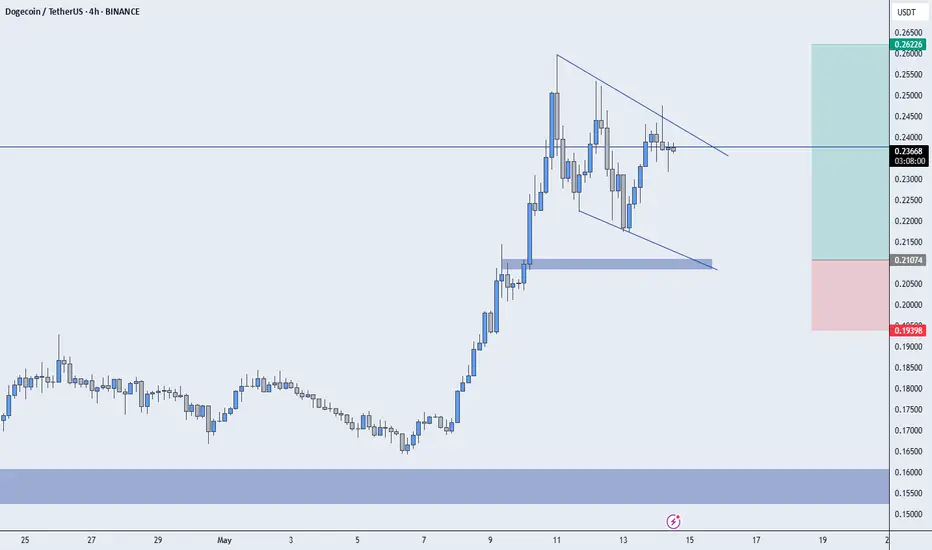
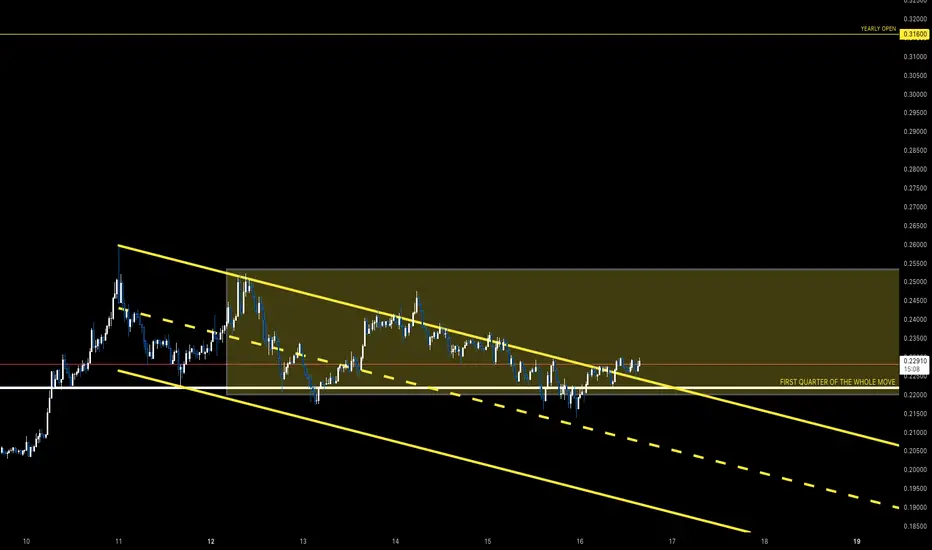
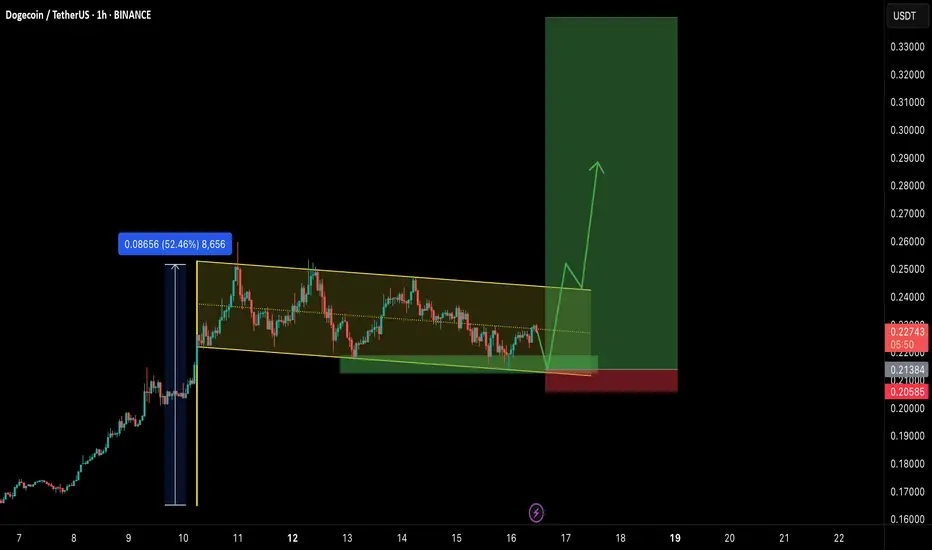
DOGE/USDT: BULLISH FLAG FORMATION!!🚀 DOGE Bull Flag Formation – 60% Potential Incoming?! 👀🔥
Hey Traders! If you're all about high-conviction plays and real alpha, smash that 👍 and tap Follow for more setups that actually deliver! 💹💯
Dogecoin is setting up beautifully inside a falling channel – a classic bull flag pattern after a strong 52% rally last week. 📉📈
Price is now consolidating near the lower support of the flag structure, with a bounce zone clearly visible. If this support holds, we could see a strong impulsive breakout in the coming sessions.
🔹 Potential Play:
Entry Zone: Current levels to slight dips ($0.213–$0.218)
Targets: $0.26 / $0.29 / $0.31+
Invalidation: Daily close below $0.205
💥 Breakout confirmation with volume could trigger a fresh leg up. Keep this on your radar — it’s gearing up for a move!
📊 Let me know your thoughts in the comments — bullish or bearish?
DOGE going homeDOGE to revisit 0.049 - 0.050 zone in the coming flush crash then riding the bullrun wave
$DOGE JUST broke out from a bullish flag patternIf you pay attention to the chart pattern, you will see that CRYPTOCAP:DOGE just broke out from a bullish flag pattern right around the $0.224 price.
CRYPTOCAP:DOGE will easily hit $0.26 if CRYPTOCAP:BTC continues in it's current bullish trend.
What do you think about CRYPTOCAP:DOGE , please let me know in the comments.
Best Regards,
Tunde Damian

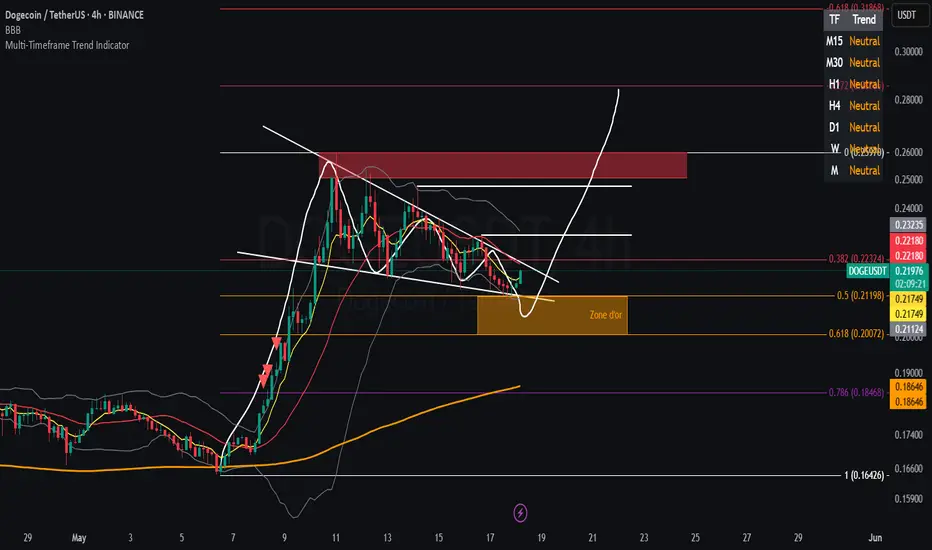
"DOGE/USD: Towards a Rebound in the Golden Zone?"DOGE/USD – H4 Vision
The short-term (ST) flow remains clearly bearish, while the long-term (LT) trend remains neutral.
I am currently observing an impulse/correction structure, with the price potentially heading towards the Fibonacci Golden Zone. This zone could offer a rebound opportunity to consider a bullish continuation, provided a valid technical signal appears.
A wedge appears to be forming, which could reinforce the idea of an upcoming technical reversal.
🎯 For further confirmation, I am also monitoring a potential EMA 7 / SMA 20 crossover on this timeframe, which would increase the likelihood of a bullish move.
🛡️ Stop-loss to be adjusted according to your own risk management.
📌 Analysis for educational purposes only – this is not investment advice.
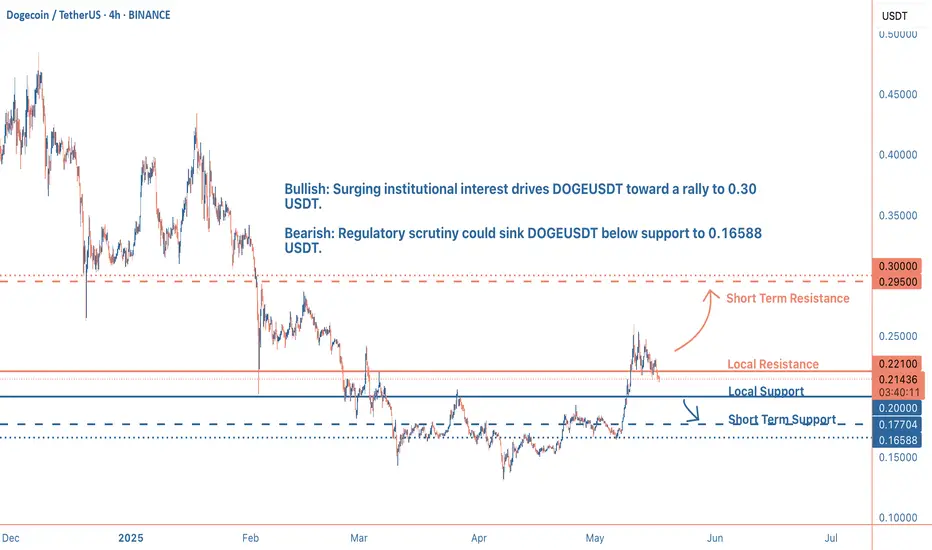
DOGE at a Crossroads: Breakout or Breakdown?This consolidation suggests the price is at a critical juncture, with potential for either a breakout or a breakdown. The recent price action hints at a possible shift in momentum, as the price tests a key resistance zone. Traders should pay close attention to how DOGE behaves around these levels, as it could dictate the next significant move. Market sentiment appears mixed, with some analysts pointing to bullish signals and others warning of bearish continuation, especially if broader market conditions (like Bitcoin’s performance) turn sour.
From a technical perspective, the Relative Strength Index (RSI) is currently in the oversold zone, which often signals a potential bottom and a reversal opportunity. However, the Moving Average Convergence Divergence (MACD) is displaying a bearish pattern, though its signal accuracy is low at 25%, making it less reliable for decision-making. The moving averages are nearing a potential crossover, which could indicate a trend change if confirmed. Key levels to watch include the resistance zone at 0.221 – 0.295 USDT and the support at 0.2000 USDT. A decisive breakout above the resistance could spark a rally toward 0.30 USDT, while a drop below the support might lead to a deeper correction, targeting 0.16588 – 0.17704 USDT.
Two primary scenarios emerge for DOGE’s near-term price action. Bullish Scenario: If the price breaks and closes above the descending channel resistance (around 0.221 – 0.295 USDT), it could form a "W" pattern, boosting the odds of a bullish move toward 0.30 USDT. This would likely be supported by a Change of Character (CHoCH) from the support zone and a break of the resistive trendline. Bearish Scenario: If the price fails to hold above the resistance and breaks below 0.2000 USDT, bearish momentum could take over, driving the price down to 0.16588 – 0.17704 USDT. This downside risk increases if Bitcoin resumes its decline, as DOGE often follows BTC’s lead. Consolidation is also possible before any major move, so patience and confirmation are key.
Practical Tips: Watch the 0.221 – 0.295 USDT resistance and 0.2000 USDT support closely for breakout or breakdown signals. Use the RSI and moving average crossover as early indicators, but be cautious with the MACD due to its low accuracy. External factors, like news or Bitcoin’s trend, could heavily influence DOGE, so stay updated. This analysis is at a pivotal moment, trade with discipline and defined risk.
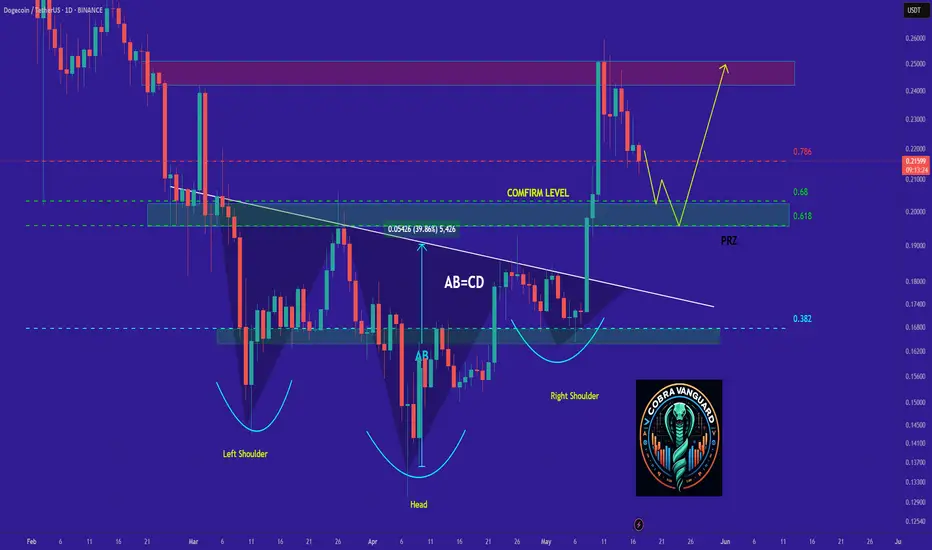
DOGE Ready for PUMP or what ?What I see now is that the price could correct to the PRZ and then pump again, and currently, there is no specific bullish pattern in the chart. which could cause the price to drop below 20 cents.
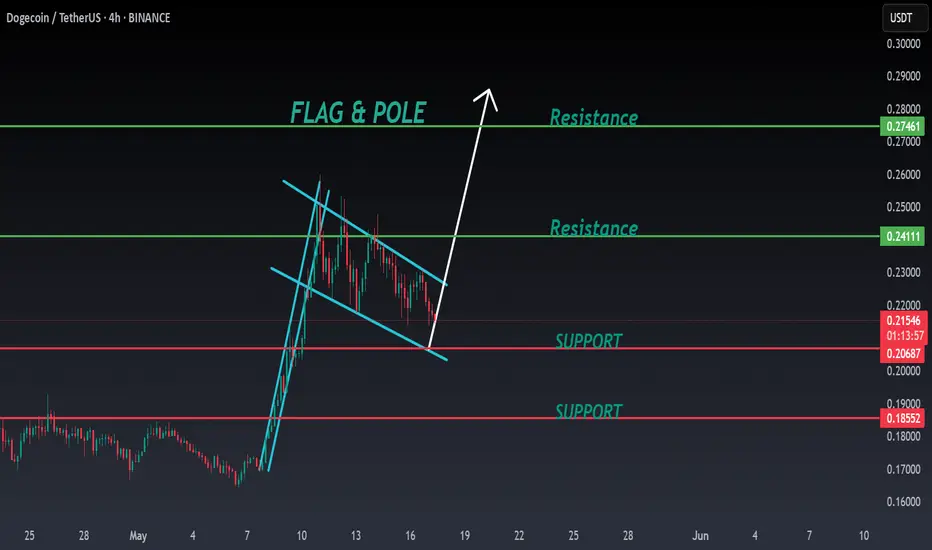
Dogecoin🌸#DOGE Analysis : Bullish Trend 🚀🚀
🚀As we can see that there is a formation of Flag & Pole Pattern in #DOGE in 4 hr time frame. Right now #DOGE is trading above it's crucial support zone and we can see a bounce back from its support zone 💪
🔖 Current Price: $0.2150
⏳ Target Price: $0.2420
⁉️ What to do?
- We can trade according to the #DOGE chart and make some profits. Keep your eyes on chart price action, observe trading volume. Always observe market sentiments and update yourself everyday.🔰🔰
#DOGE #Cryptocurrency #Breakout #TechnicalAnalysis #DYOR
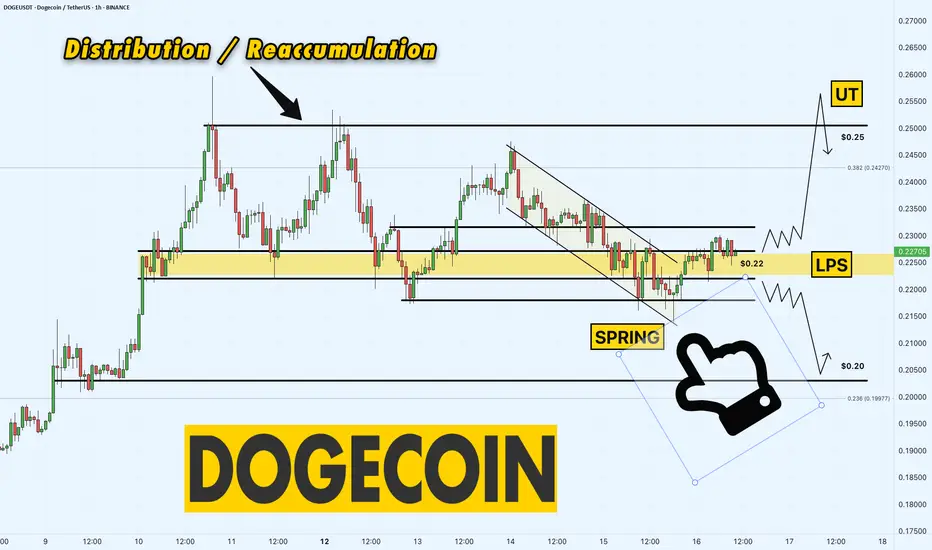
DOGE/USDT 1-Hour Chart – Distribution or Reaccumulation?Dogecoin is at a critical juncture on the 1-hour chart!
We’re seeing signs of a Distribution/Reaccumulation phase, with the price action teasing a potential move. After a possible Spring shakeout at $0.215, DOGE has climbed into the Last Point of Support (LPS) range between $0.22 and $0.23. This could be a launching pad for a bullish move!
I’m watching for a push toward $0.25, where we might see a UT (Upthrust) structure form — a solid target for this setup. However, if the price fails to hold, a breakdown below $0.22 could send us toward the $0.20 level, a key support to watch. The $0.22-$0.23 zone is critical right now — will bulls take control, or will bears strike back? Let’s find out!
Key Levels to Watch:
Support: $0.22 (LPS range), $0.20 (breakdown target)
Resistance: $0.23 (upper LPS range)
Target: $0.25 (potential UT structure)
What’s your call, traders? Are we heading for $0.25, or will $0.20 come into play ? Drop your thoughts below!
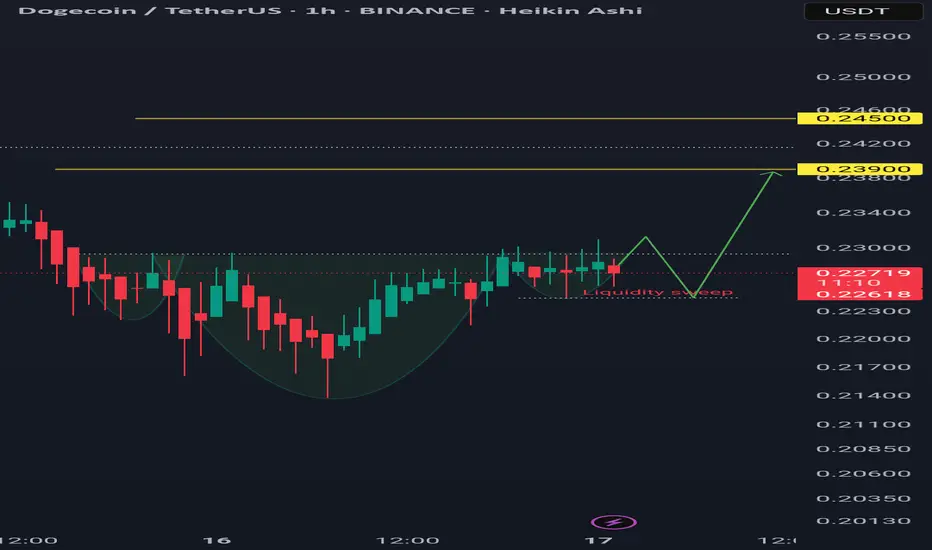
Dogeusdt forming a small Bullish iH&S pattern in 1hr tfA bullish inverse Head and Shoulders (iH&S) pattern is forming. A close above 0.2294 on the 1-hour timeframe may activate the pattern.
Consider an entry between 0.2248 and 0.2294, assuming a breakout occurs without breaking the previous swing low.
The targets are 0.239 and 0.245.
Assuming the breakout happens, the price may revisit the liquidity sweep area afterward due to tight consolidation, potentially fueling further upward movement.
Therefore, it is advisable to wait for confirmation and a bounce at the liquidity sweep area before entering.
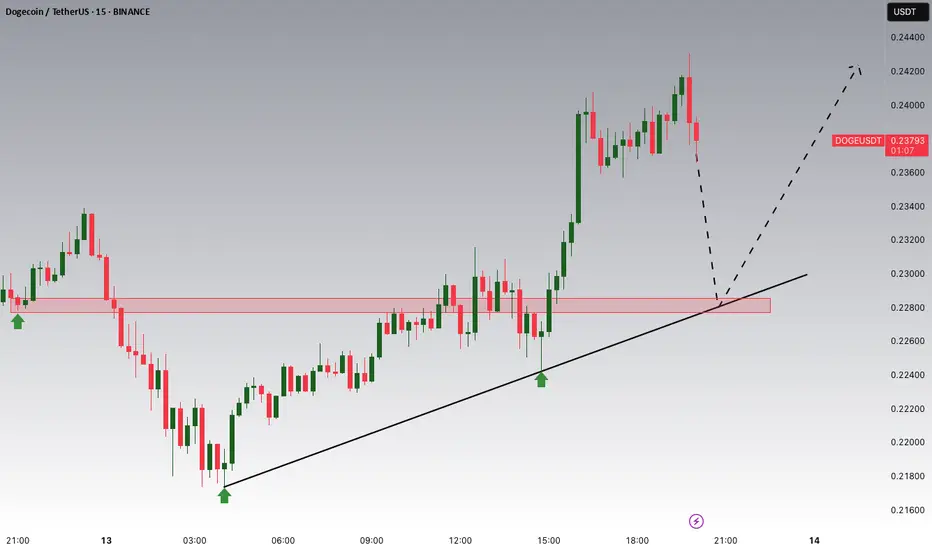
DOGE/USDT: Key Buy Opportunity at 0.22800 Support Zone!Hey Traders, in today's trading session we are monitoring DOGE/USDT for a buying opportunity around 0.22800 zone, DOGE/USDT is trading in an uptrend and currently is in a correction phase in which it is approaching the trend at 0.22800 support and resistance area.
Trade safe, Joe.
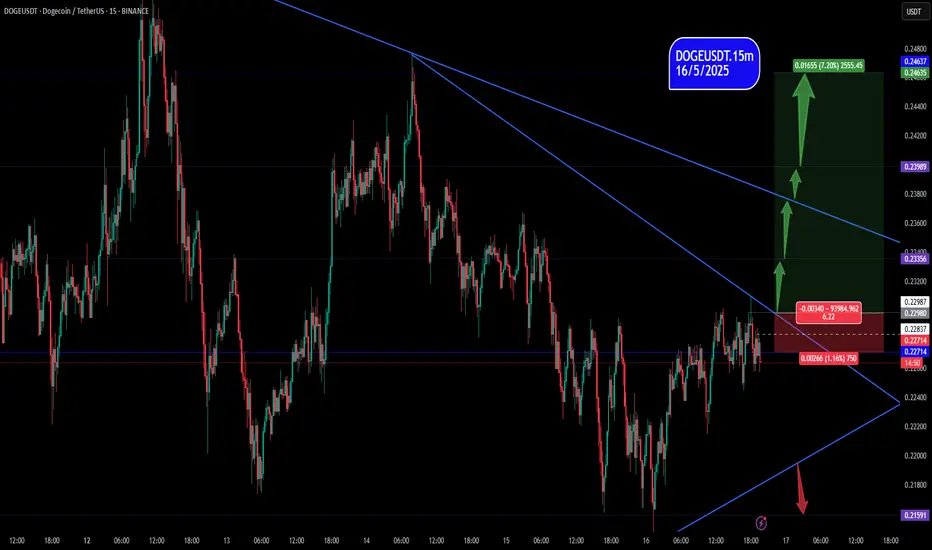
dogeusdt.15mAnalysis of the dogeusdt pair on the 15-hour time frame. The analysis is based on trend analysis, support and resistance. What we are waiting for is the achievement of bullish conditions.
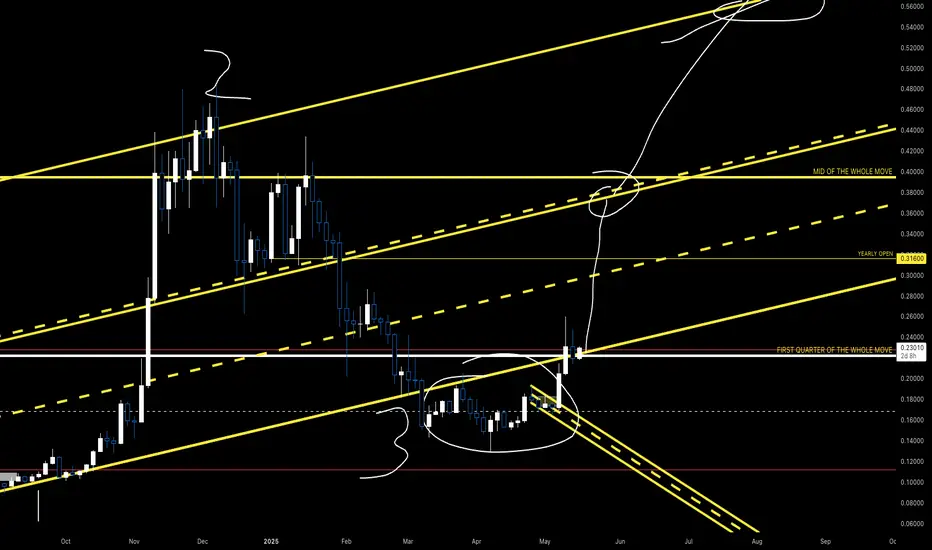
DOGEParallel channel defines uptrend.
1 (bottom) and 3 (pullback to support) never move.
2 is variable and can be adjusted vertically depending on extension.
The circled region after 3 (where DOGE has traded since February) can be thought of as a deviation of support or deviation of the lower bound of the channel, the bankers creating an opportunity for themselves to steal as much as possible at discounted prices.
Once back inside the channel, I believe the accumulation will be done.
Inevitably, we will run the other side of the this channel.