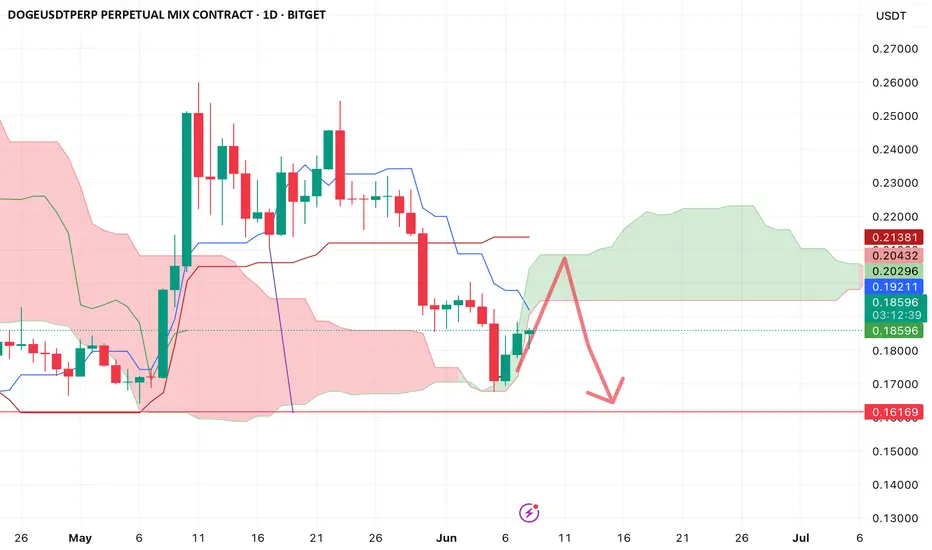
Doge Rocket End to End Cloud MoveThe idea basis is simple.
1) Full M pattern target did not fully hit, look for resistance that can send it lower to complete it.
2) Found the Daily Cloud End to End Move where we go to the very top and reject straight back down to fill out the M
We also have an inverse h&S showing 0.207 target
Good Luck
DOGEUSDT.PS trade ideas
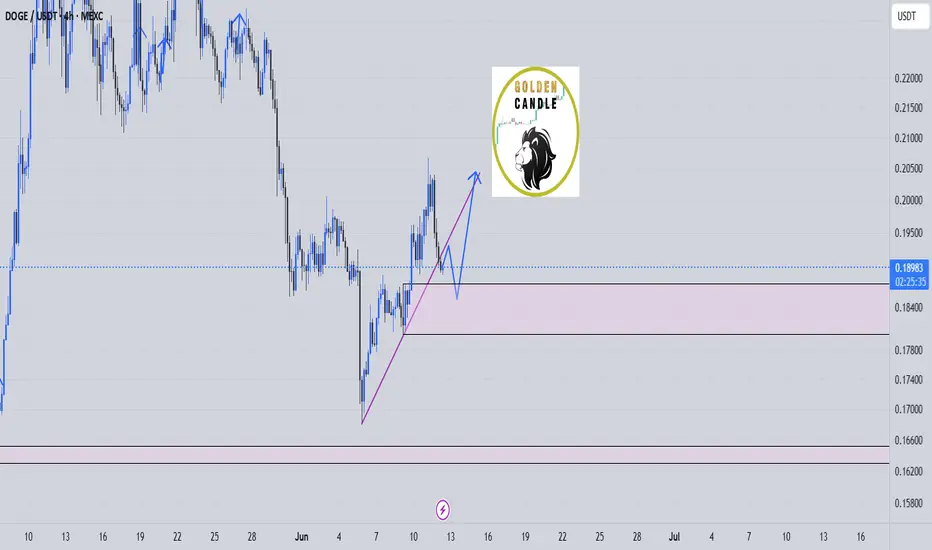
doge buy long term "🌟 Welcome to Golden Candle! 🌟
We're a team of 📈 passionate traders 📉 who love sharing our 🔍 technical analysis insights 🔎 with the TradingView community. 🌎
Our goal is to provide 💡 valuable perspectives 💡 on market trends and patterns, but 🚫 please note that our analyses are not intended as buy or sell recommendations. 🚫
Instead, they reflect our own 💭 personal attitudes and thoughts. 💭
Follow along and 📚 learn 📚 from our analyses! 📊💡"
DOGECOIN. USDTDogecoin is a meme coin that top investors are looking at.
So it works very technically.
Don't rush into fake failures or you'll get liquidated.

Doge bearish in 1hr time frameThe pattern is not yet complete, but if it makes a new bounce and retests again, it will attract bearish traders, increasing the likelihood of a breakdown. A close below 0.1865 on the 1-hour timeframe will confirm the pattern. This level also serves as the invalidation point for long entries and the final take-profit (TP) from the previous bearish pattern.
Targets are 0.174 and 0.167.
Doge Double Trouble $0.22 or $0.17 NextTwofer Doge . 10-15% move either way likely based on how bitcoin does.
Breakout
0.224
Breakdown
0.172
Decided to throw this chart together based on my original idea of the end to end cloud touch that is working out well.

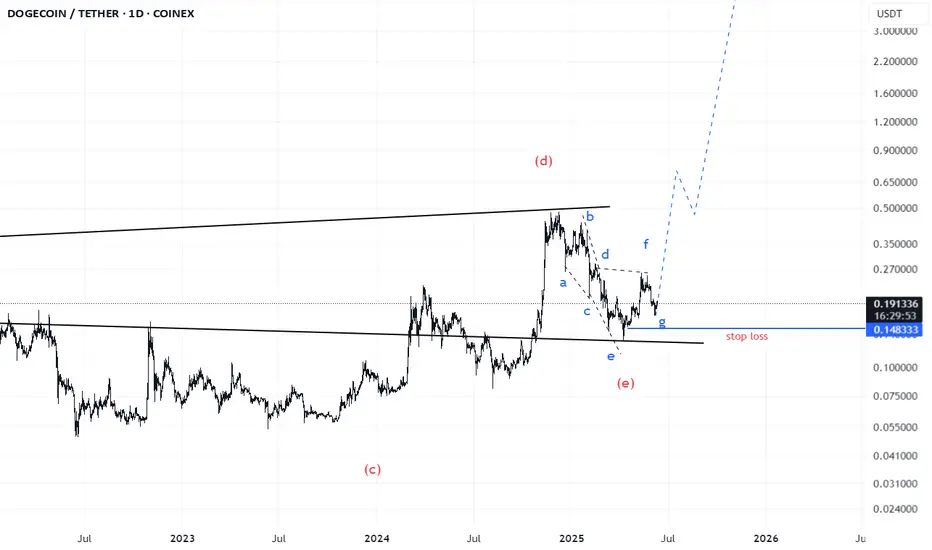
Doge(based on NEowave)like ETH wave E is ending and soon it will start a huge bullish wave.
wave E look likes a bow-tie diametrical and wave g is at the end which is the last chance to buy.
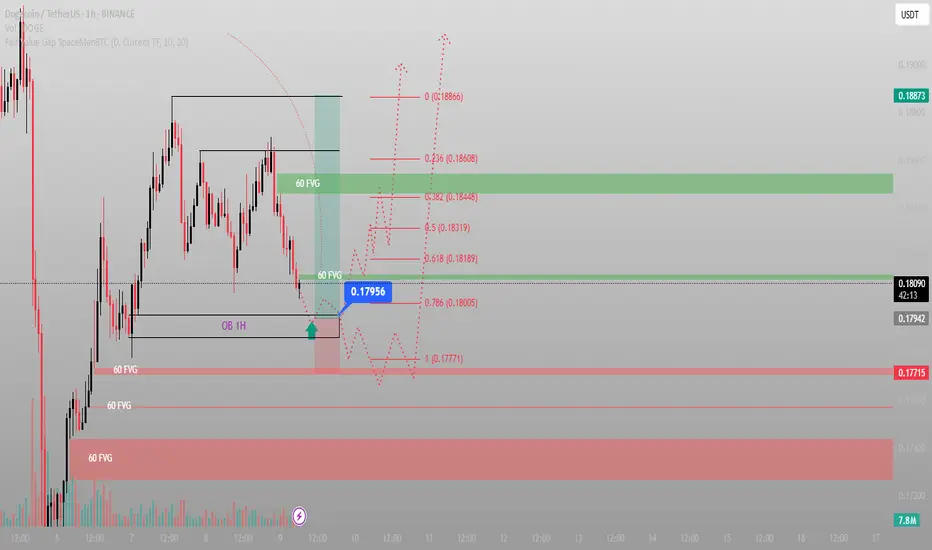
I positioned here — while others waited for confirmation.This was a textbook setup. Clean structure, high-probability narrative, and the kind of zone that doesn’t ask for your belief — it commands it.
Breakdown:
Price delivered a sharp move into a 1H OB confluence with an untouched 60min FVG sitting just below. That OB wasn’t noise — it was a true origin point, the last down candle before a major rally.
As price retraced, it swept short-term liquidity and tapped into that OB with precision. I watched volume spike on the drop — not retail fear, but Smart Money engineering the entry.
The 0.1795 zone wasn’t random. It was deliberate. A key equilibrium between displacement and rebalancing. And if this holds, the next logical draw is above 0.1860 — into the unmitigated FVG and resting buy-side liquidity.
Expectation:
From this 1H OB / FVG stack, I’m looking for:
Entry: ~0.1795
SL: Just under the 1.0 fib — under 0.1777
TP1: Mid FVG at 0.1831 (0.5)
TP2: Full inefficiency fill at 0.1887
I’m not forcing anything. If the market wants lower, there’s another FVG just below to absorb it — but structure still favors premium re-pricing.
Final note:
I don’t chase breakouts. I trap Smart Money setups, wait in silence — and strike when the chart gives me the story.
“The market doesn’t move by chance. It moves by design. And I design my trades the same way.”
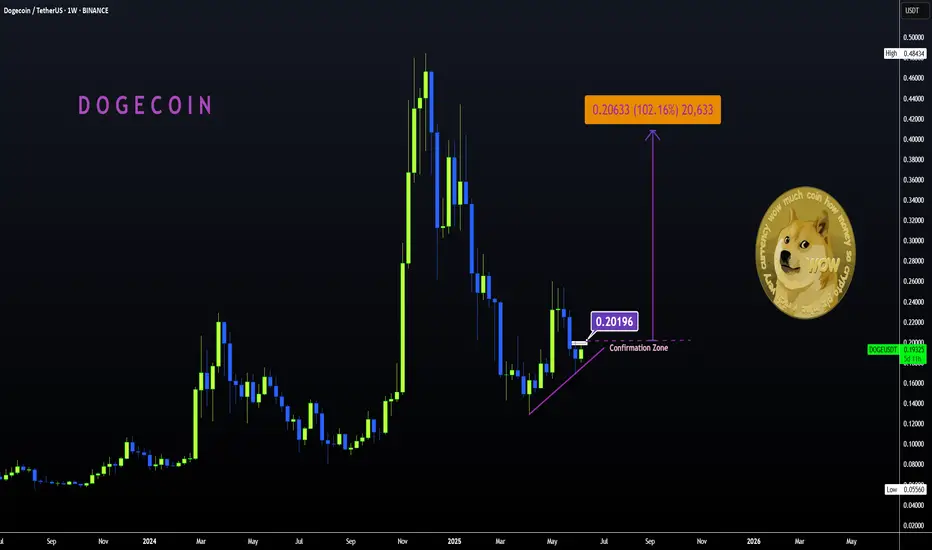
DOGE | BULLISH Pattern | +100%DOGE is seemingly ready for more upside as we start to see a pattern resembling an inverse head and shoulders pattern:
✅Usually, the Inverse H&S plays out something like this:
📢But the pattern is not quite confirmed just yet. We'd need to see a close ABOVE the current resistance zone to validate the pattern:
If we can see that, it's likely that there can be BIG gains on DOGE. It will especially help if ETH makes more increases, showing that the general alt market is heading in the right direction.
____________________
BINANCE:DOGEUSDT
ORDER analysisWe recommend placing your buy orders in the support area, as the price is currently testing a major support zone.
Major Support Area: $0.18182-$0.18000
#DOGE/USDT#DOGE
The price is moving within a descending channel on the 1-hour frame and is expected to break and continue upward.
We have a trend to stabilize above the 100 moving average once again.
We have a downtrend on the RSI indicator, which supports the upward move by breaking it upward.
We have a support area at the lower limit of the channel at 0.1800, acting as strong support from which the price can rebound.
Entry price: 0.1838
First target: 0.1886
Second target: 0.1928
Third target: 0.1972

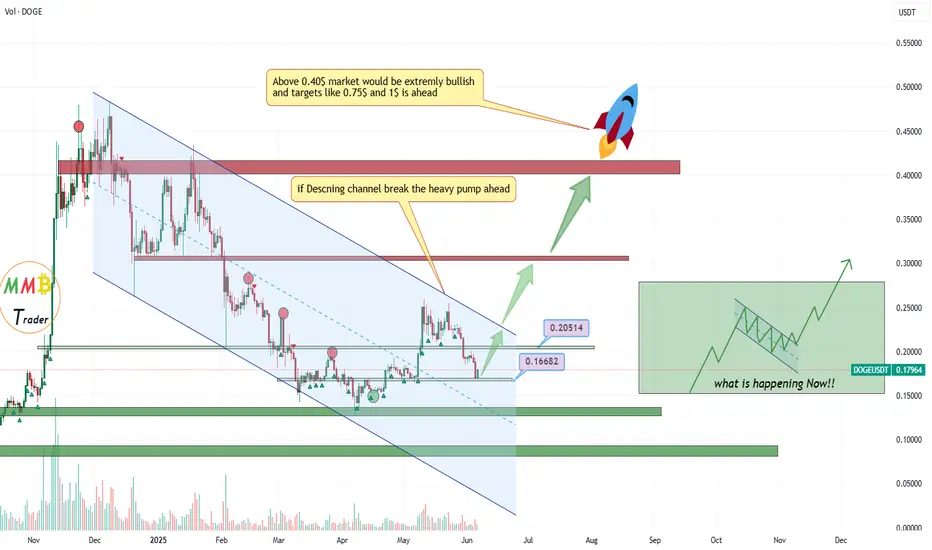
DOGEUSDT major daily support ahead wait for pumpAs we can see price is near major daily support of 0.17$ and also previous time price was not able to break this channel resistance zone and started to see correction again and again but soon the channel upper side will break and price will manage to pump above 0.3$ and even 0.5$.
DISCLAIMER: ((trade based on your own decision))
<<press like👍 if you enjoy💚
Short trade
📕 Trade Journal Entry — DOGEUSDT (Sellside Trade)
🗓 Date: Sunday, 8th June 2025
⏰ Time: 5:00 AM (NY Time)
📍 Session: London Session AM
📈 Timeframe: (Not specified – assumed short-term trade)
🔹 Trade Details:
Entry Price: 0.18198
Take Profit: 0.17864 (+1.84%)
Stop Loss: 0.18306 (−0.59%)
Risk-Reward Ratio: 3.09
🔹 Technical Context:
Trade was taken on signs of rejection at a previous resistance level after a rally.
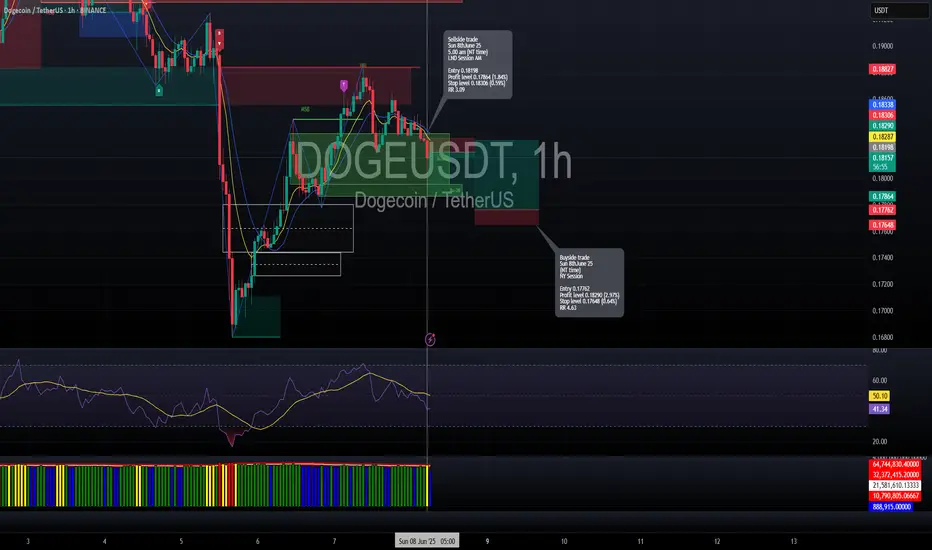
Long trade
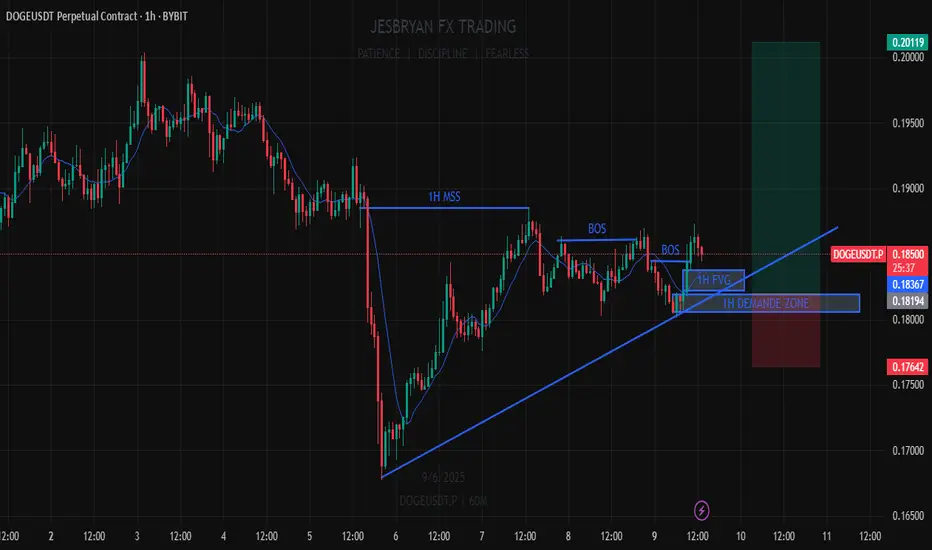
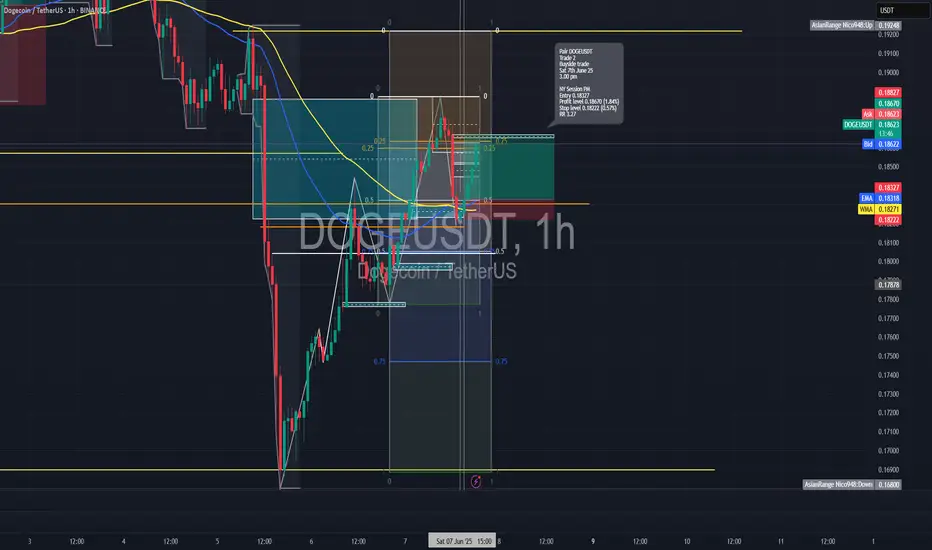
📘 Trade Journal Entry — DOGEUSDT (Buyside Trade 2)
🗓 Date: Saturday, 7th June 2025
⏰ Time: 3:00 PM
📍 Session: New York PM
📈 Timeframe: 1-Hour
📊 Market Structure Tool: Bullish Break of Structure + Fair Value Gap Retest
🧠 Confirmation Tool: Rejection from Demand + Volume Support
🔹 Trade Details:
Entry Price: 0.18327
Take Profit: 0.18670 (+1.84%)
Stop Loss: 0.18222 (−0.57%)
Risk-Reward Ratio: 3.27
🔹 Technical Breakdown:
Market Structure:
On the 1-hour chart, price broke a key lower high, shifting the structure bullish.
Entry was taken after a clean retracement into a fair value gap (FVG) within the new bullish leg.
Entry Confirmation:
Price exhibited a clear bullish reaction at the FVG zone,
Momentum & RSI:
RSI stayed above 50, showing strong bullish momentum.
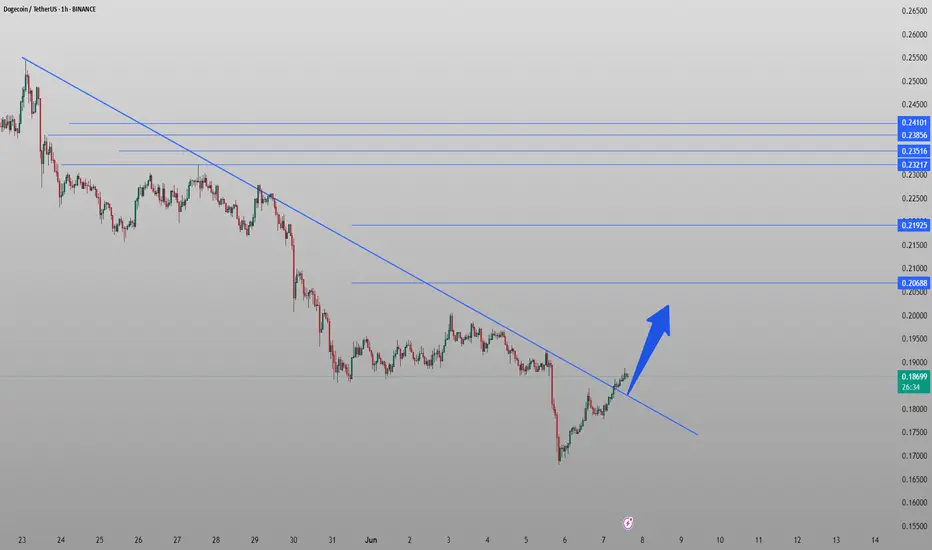
DOGE - BULLISHON THE WAY TO HIT THE TARGETS.
DOGE COIN has just passed the trend line. in a couple of weeks it will reach to the 0.24. DYOR.
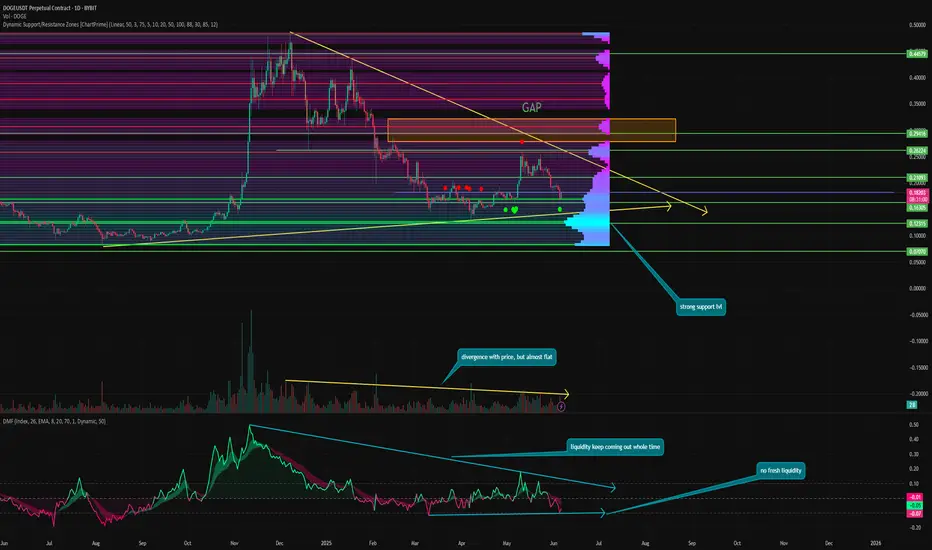
Is the DOGE era over?⚡️ Hello everyone! For a long time, DOGE remained one of the main symbols of the crypto industry and a leader among meme coins.
But lately, the token has been looking frankly gloomy, and even Elon Musk can hardly pump it up. Is the DOGE era really over? Let's figure it out!
📊 Technical Analysis:
DOGE continues to be in correction and has now formed a flag on the daily chart and may soon break through one of the sides. It will likely choose a direction for movement in the near future, but which one is most likely?
There is a small GAP above the current price at 0.28 - 0.323. And as we know, 99% of GAPs close sooner or later. At the same time, the token is now trading at last year's local top levels, which is one of the key supports in this cycle.
⚙️ Metrics and indicators:
Volume - throughout the correction, sales volumes continued to weaken, forming a divergence. However, it is barely noticeable and practically flat, which means that sales volumes in the token remain high.
DMF - liquidity is in harmony with the price, and capital outflow from DOGE has been ongoing throughout this period. There is virtually no inflow of fresh liquidity. Without it, the asset will not be able to return to growth.
DSRZ - strong support level at approximately 0.134 - 0.119. This means that even current levels are considered overvalued and real demand will start significantly lower.
🌐 Fundamentals:
DOGE was a symbol, one of the first memecoins. But this is a memecoin super cycle, as it was dubbed in X. And now there are so many new and relevant memes, including in the top 100, that it is simply impossible to count them all.
In addition, DOGE was primarily associated with Elon Musk. But even his antics have become commonplace, and he rarely manages to pump the token price high. Moreover, last year, the mascot depicted on the DOGE token itself died, and now it is only a tribute to his memory.
📌 Conclusion:
During the recent rebound, when memecoins were giving hundreds of percent returns, DOGE looked frankly weak. The volumes were negligible. And the ongoing liquidity outflow, which has been going on for more than six months, only confirms the loss of interest among holders.
At the moment, the asset is slowly dying, and in order to really start attracting interest, it needs to drop significantly lower to become the subject of speculation again.
And I think this level is even lower than 0.11. Then it will become really attractive. Although it is difficult to assess whether DOGE is overvalued or undervalued, because it is a meme coin. But at levels below 0.119, I personally start to consider it for spot purchases.
DOGE Short Setup in Play—Targeting $0.13258 and $0.08840The broader price structure of DOGEUSDT continues to reflect a clear downtrend, with price consistently printing lower highs and lower lows. This trend is well-respected, as shown by the descending blue trendline, which has acted as dynamic resistance since early 2025.
In late April to early May, DOGE saw a sharp rally, briefly breaking above the trendline. However, this move turned out to be a false breakout against the trend, highlighted on the chart with a label and visual marker. The breakout failed to sustain above resistance and quickly reversed, trapping bullish traders and reaffirming the bearish dominance. This type of price action often signals a bull trap, and in this case, the reversal was swift and aggressive.
The price has since declined and is currently trading around the $0.18258 region, hovering just below the local resistance and just above the initial support levels.
Key Levels Observed on the Chart
• Stop-Loss / Resistance Zone:
The red resistance area around $0.20930–$0.22643 marks a critical stop-loss zone for any short positions. This is the top boundary where the false breakout failed and where sellers previously regained control.
• Entry / Decision Zone:
Price is currently within a small neutral box (shown in light blue), indicating a potential short entry zone as price consolidates below resistance.
• Key Support Level 1 / Take Profit 1:
$0.13258 – This level has been labeled as the first major support and serves as the initial take-profit zone for short setups. Historically, this zone has held price during strong down moves, and it aligns well with past structure.
• Key Support Level 2 / Take Profit 2:
$0.08840 – The second support level is marked as a deeper profit target for continuation of the downtrend. This level is closer to multi-month lows and reflects potential bearish extension.
• Final Support Base:
$0.05000 – This level is the lowest green horizontal line on the chart, showing long-term structural support. If macro conditions worsen, this remains a plausible downside target.
Detrended Price Oscillator (DPO) Indicator
The DPO reading remains below zero at approximately –0.04, reinforcing the bearish momentum. The indicator does not show any bullish divergence, suggesting that there’s currently no sign of an upward reversal forming. The gradual downward slope of the DPO supports the probability of a continuation move to the downside.
Trade Setup (Short Bias)
• Entry Zone: $0.18258 – $0.18546 (current price range just under resistance)
• Stop-Loss: $0.20930 (above key resistance where breakout failed)
• Take Profit 1: $0.13258
• Take Profit 2: $0.08840
• Extended Bearish Target: $0.05000
Conclusion
DOGEUSDT continues to respect its long-term bearish structure, and the recent false breakout further validates the dominance of sellers. The failed attempt to reverse the trend above $0.20930 provides a well-defined stop for short setups, while the clean stair-step structure of support levels offers logical take-profit zones.
Unless DOGE manages to close above the $0.20930–$0.22643 resistance band with strong follow-through, the current bias remains bearish. Traders can monitor for short opportunities while protecting capital above the invalidation zone.

DOGE - Critical support - Going Up. Going up if support holds. Higher low. Next resistance 25c. Enter new long. 18.5c. Tight stop loss.

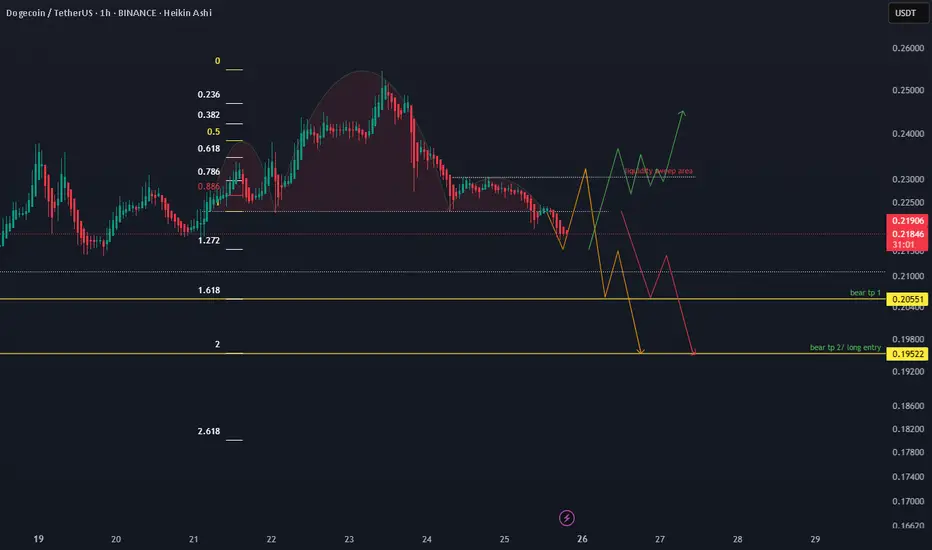
Doge possible bounce area in 1hr tfDoge has formed a bearish pattern on the 1-hour timeframe, with potential targets at 0.206 and 0.196.
I wouldn’t take a short entry here. Instead, I’ll wait for a bounce. Shorting now would be a counter-trade.
I’ve drawn a possible bounce zone, with a good entry point around the shorters’ TP2 at 0.196.
Another scenario involves a liquidity sweep before dropping to TP2, which would indicate a stronger bearish move.
The last possibility is a break above the liquidity sweep area, followed by consolidation and either a new high or a bullish structure formation. In that case, we could consider buying in that zone.
Dogecoin coin Wave Analysis – 5 June 2025
- Dogecoin broke key round support level 0.2000
- Likely to fall to support level 0.1600
Dogecoin cryptocurrency is under bearish pressure after the earlier breakout of the key round support level 0.2000 (former strong resistance from March) coinciding with the support trendline of the daily up channel from March.
The price briefly corrected up to test the broken price level 0.2000 (acting as the resistance after it was broken) – after which it continued to fall in the active impulse wave 3.
Dogecoin cryptocurrency can be expected to fall to the next support level 0.1600, former low of wave (iv) from the start of May.

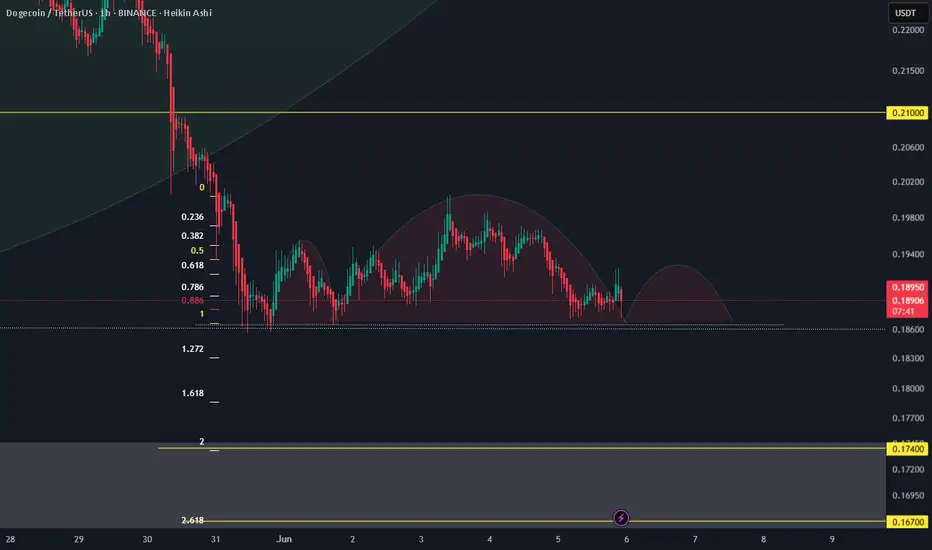
Where Most See Resistance, Smart Money Sees OpportunityDOGE is currently hovering around the 0.382–0.5 Fibonacci retracement zone after a reactive bounce from 0.618 (0.16784) — a critical discount level. Most traders panic at these levels, but experienced participants know this is the zone where price builds intention.
Here's the breakdown of the structure:
Price tapped into the 0.618 Fibonacci level (0.16784) and began showing signs of recovery — a typical Smart Money accumulation zone.
The next target is 0.17042, aligning with the 0.236 retracement level, followed by 0.17151, where previous supply might get mitigated.
Potential retracements are possible, but as long as price holds above 0.16670 (0.786), the bullish structure remains intact.
Execution strategy:
Entry (Accumulation Zone): Between 0.16784 and 0.16864
Invalidation: Break below 0.16600 would weaken the bullish case
Upside targets:
• TP1 → 0.17042
• TP2 → 0.17151
• Extension possibility beyond 0.17204
This move appears to be a classic premium-delivery setup — a structural reset, not a collapse. Smart Money steps in quietly when retail panic takes over. If you're trading DOGE like a pro, focus on levels, not emotions.
Let me know if you'd like this converted into a tweet format or turned into a technical newsletter paragraph.

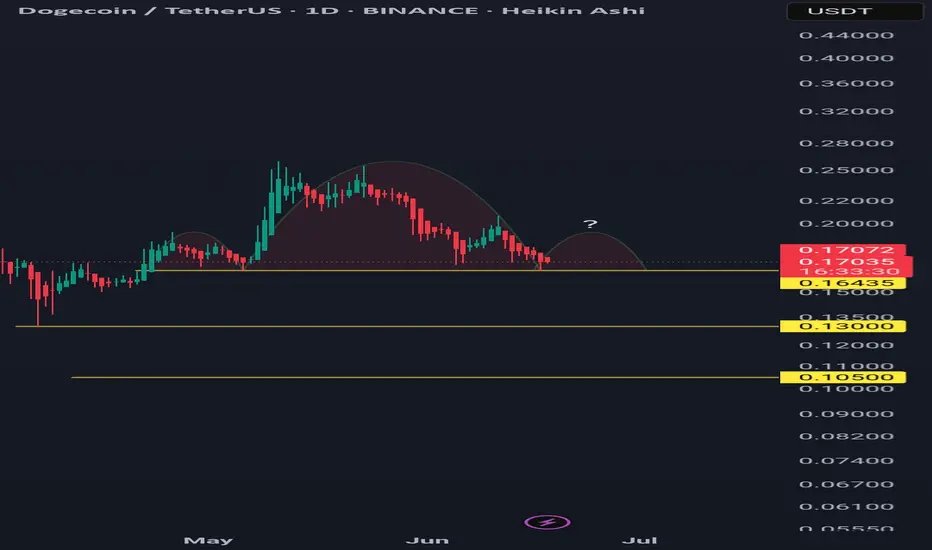
Dogeusdt, daily time frame starting to look bearishStarting to form a bearish pattern in daily time frame, still not complete/confirm.
Trading below 100 daily ma.
Long trade
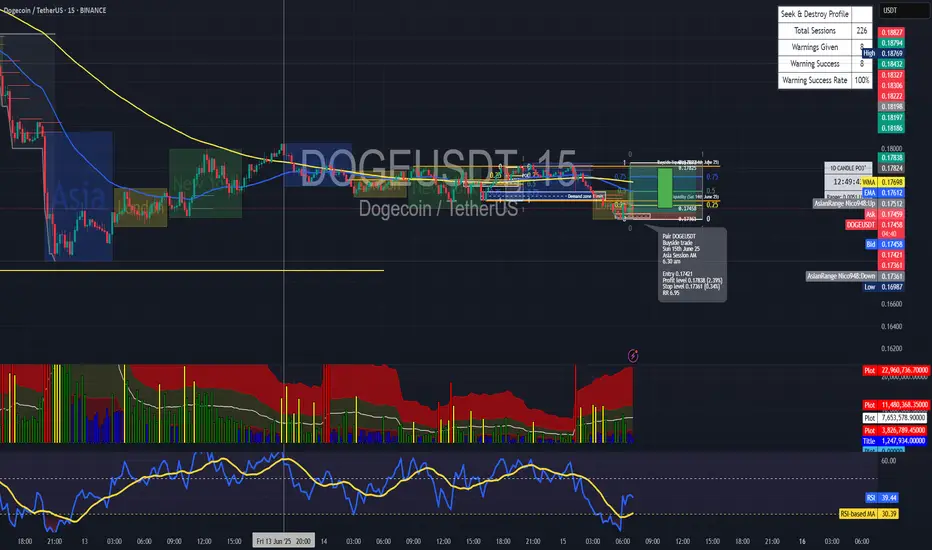
🟢 DOGEUSDT – Buyside Trade
Date: Sunday, 15th June 2025
Session: Asia Session AM
Time: 6:30 AM
Entry Timeframe: 15min TF
Trade Parameters
Entry: 0.17421
Take Profit: 0.17838 (+2.39%)
Stop Loss: 0.17361 (−0.34%)
Risk-Reward Ratio (RR): 6.95
🧠 Trade Reasoning (Buyside)
DOGEUSDT printed a bullish market structure shift during the early Asia session after a sweep of short-term liquidity beneath the 0.17360 level.
doge coin targetsBased on the blocks formed and the trend of Dogecoin. The trend of Dogecoin in the coming days and possible targets are shown in the image. Follow me to be informed of new analyses.
