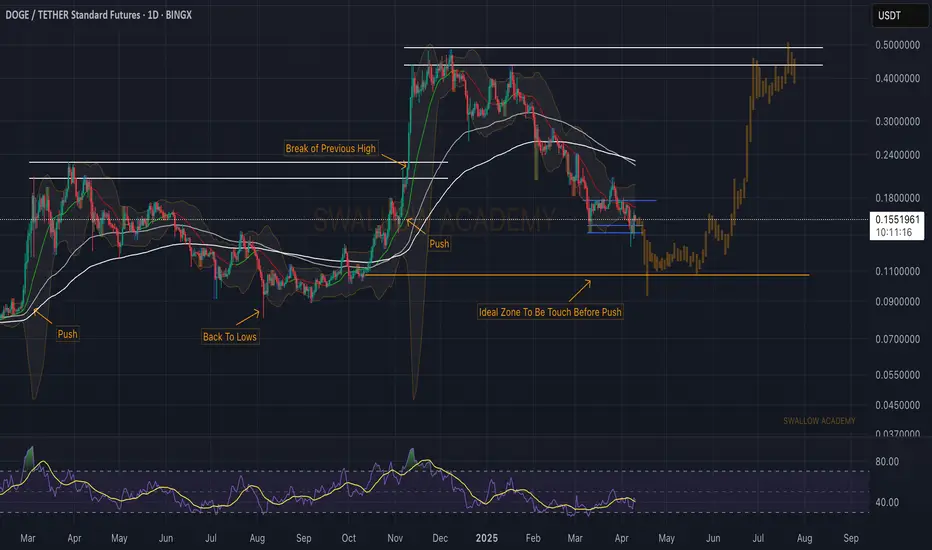
Dogecoin (DOGE): Looking For 1 More Wave of SellGetting back to one of our TAs, we are still pretty far from our desired zone for Dogecoin, where we are looking for a further dip to happen before seeing a proper upward movement.
Now we see there is a selling pressure and we see a good chance of our lower zone being reached, so there might be an opportunity to short until that zone!
Swallow Academy
DOGEUSDT.PS trade ideas
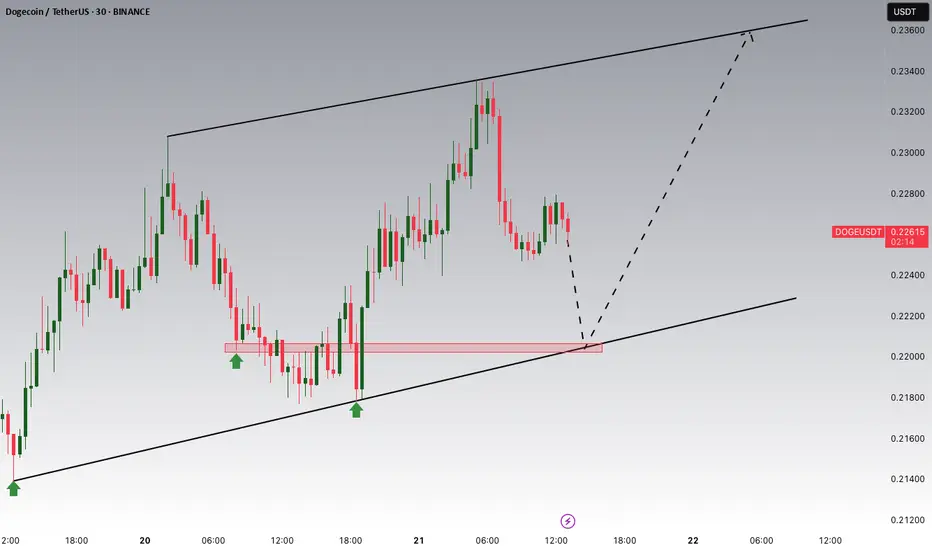
DOGE/USDT Potential UpsidesHey Traders, in today's trading session we are monitoring DOGE/USDT for a buying opportunity around 0.22000 zone, DOGE/USDT is trading in an ascending channel and currently is in a correction phase in which it is approaching the ascending channel support.
Trade safe, Joe.
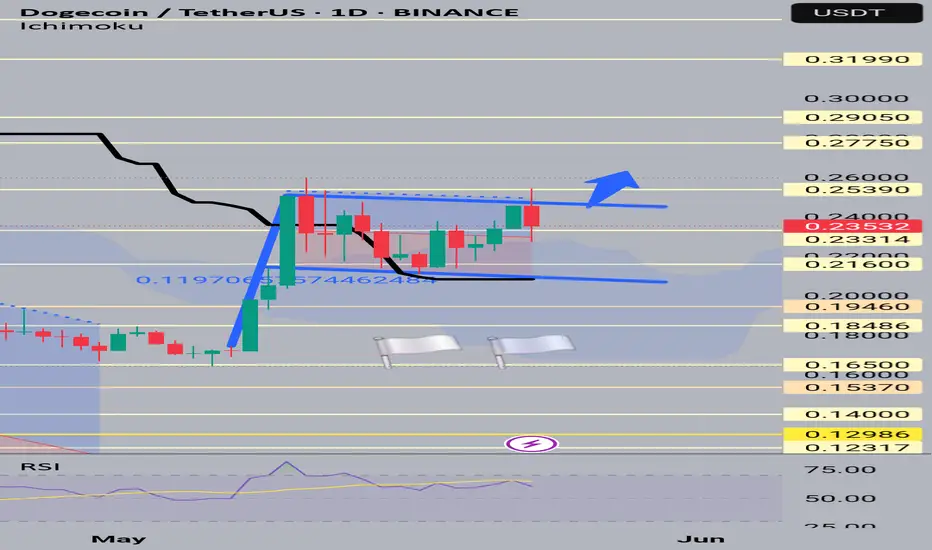
Doge usdtHi Snipers. On the one-day timeframe, we are witnessing the formation of a flag pattern, which is a bullish pattern. Usually, after a strong price rise, the price suffers in a horizontal channel and continues to rise after breaking the channel ceiling. I am learning and practicing and this is not a buy or sell recommendation.
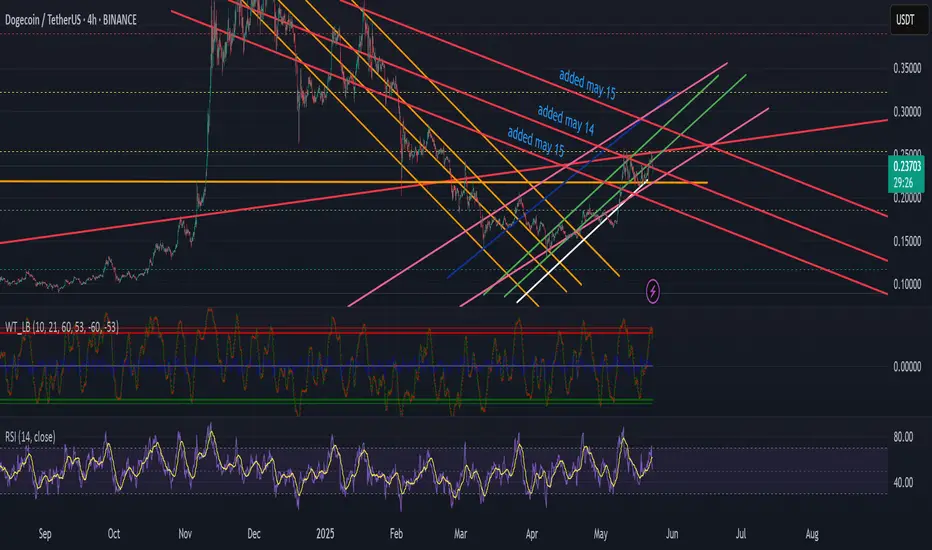
Doge consolidationi have updated this chart a lil, still mostly play videogames, so i dont fully watch all the time. have a good chance for some down pressure again, but should be hitting the growth wall end of 2025 ish 2026 will be a good lil spike but it wont be till 2030 that markets are going to fully re-enter hyper bull seaon, 2026 will be a recovery growth. just my perdiction and of course long runs do favor green, but there are those who chnace and play the ups and downs constatly. so with that thank you for your time, i have started adding tags for time frames and better flow uinderstanding of big money moves.
BTCIf BTC falls below 106,000, most altcoins will see at least a 10% drop
First BTC support range between 102,000 and 106,000
Great buy ranges
1 - 102,000 to 104,000
2 - 96,000 to 97,000
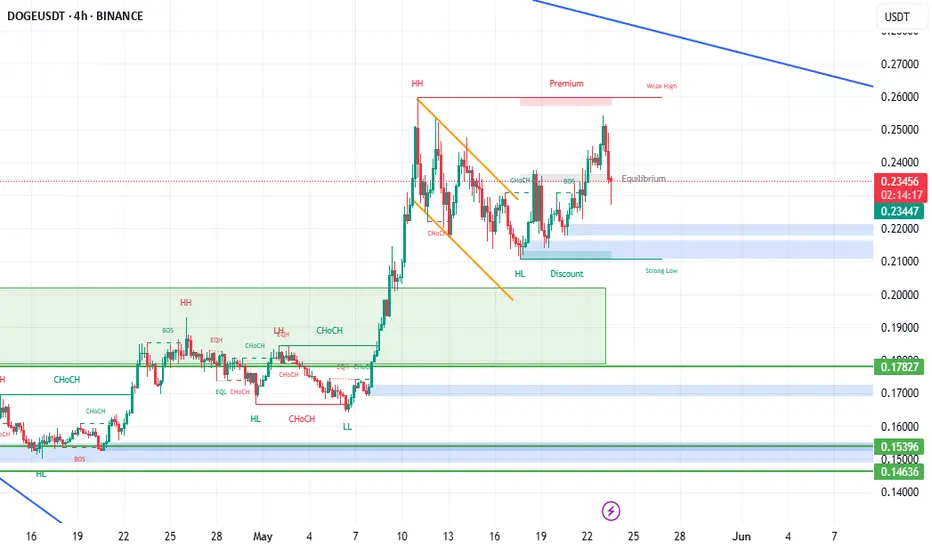
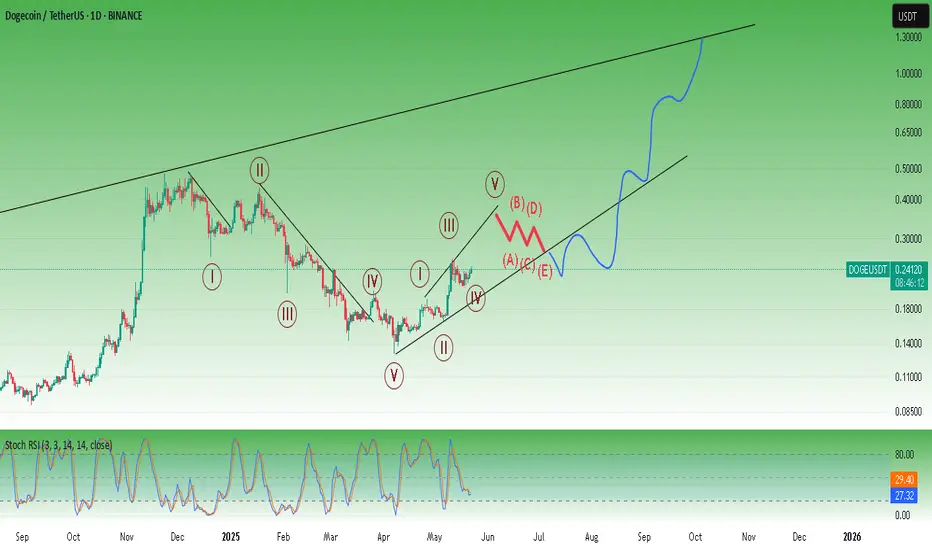
DOGE Analysis (4H)It appears that Dogecoin's correction has started from the point where we placed the red arrow on the chart. This correction seems to be a flat pattern, with the first two parts forming a diametric and a triangle.
If the price reaches the green zone | which is a key area | we can start looking for buy/long positions.
Targets : 0.23092 _ 0.25283 _ 0.29426 _ 0.32217
A daily candle closing below the invalidation level will invalidate this analysis.
For risk management, please don't forget stop loss and capital management
Comment if you have any questions
Thank You

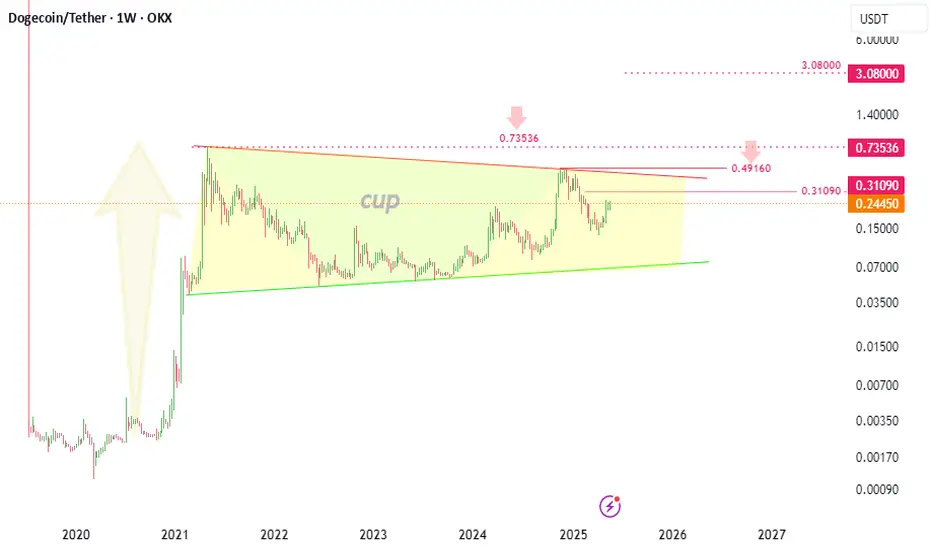
#DOGEUSDT ( wow )A collection of explosive patterns....
Only the breaking of the top of the yellow pattern (the same edge of the blue "cup")
could make it to the moon and
raise the "flag" above the moon
So be careful and wait and watch
#DOGEUSDT ( wow )A collection of explosive patterns....
Only the breaking of the top of the yellow pattern (the same edge of the blue "cup")
could make it to the moon and
raise the "flag" above the moon
So be careful and wait and watch

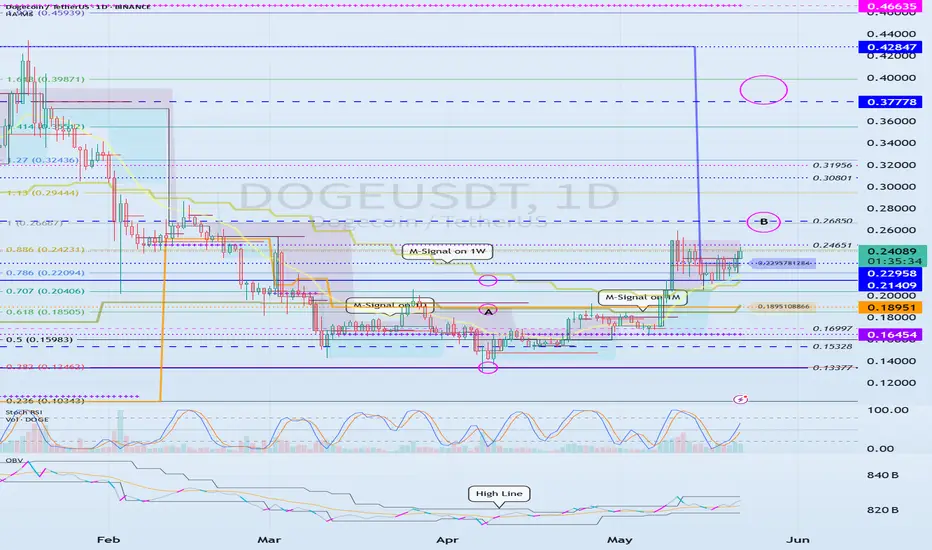
Next Breakout Trading Zone: 0.26850
Hello, traders.
If you "Follow", you can always get new information quickly.
Have a nice day today.
-------------------------------------
(DOGEUSDT 1D chart)
It is expected that a breakout trade will be possible when the B zone breaks upward.
Conditions for a breakout trade:
1. OBV must show an upward trend. If possible, it is good to see an upward breakout of the High Line.
2. It should show that the StochRSI indicator maintains the K > D status. If possible, it is good if K does not enter the overbought zone.
If it rises above 0.24651, you should check if the OBV and StochRSI indicators meet the breakout trading conditions.
If it fails to rise, you should check if it is supported around 0.21409-0.22958.
If the price maintains above the M-Signal indicator on the 1M chart, it is likely to continue the upward trend.
-
Thank you for reading to the end.
I wish you successful trading.
--------------------------------------------------
- This is an explanation of the big picture.
(3-year bull market, 1-year bear market pattern)
(3-year bull market, 1-year bear market pattern)
I will explain more details when the bear market starts.
------------------------------------------------------
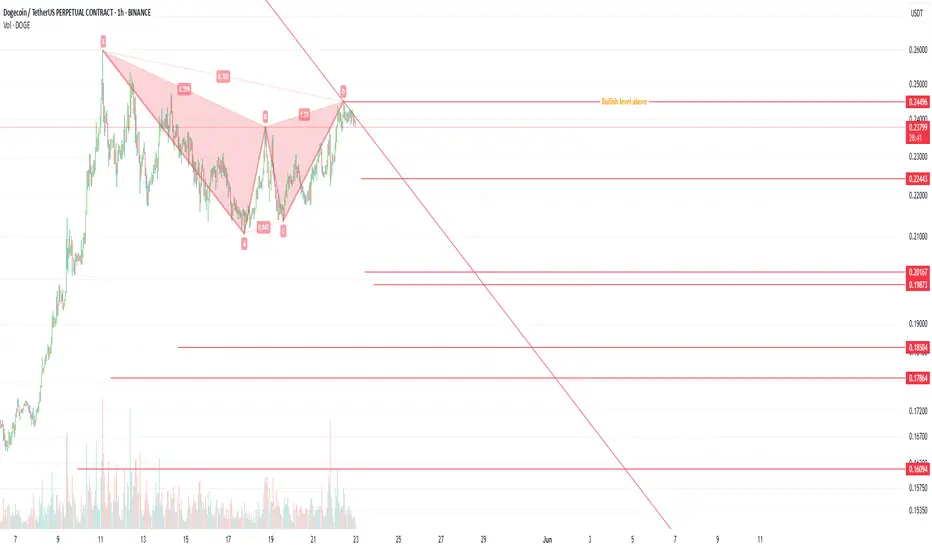
Doge chartDoge chart.
Price to hit any of the levels down and bounce back.
Dump will be canceled if price is going above the dump tip.
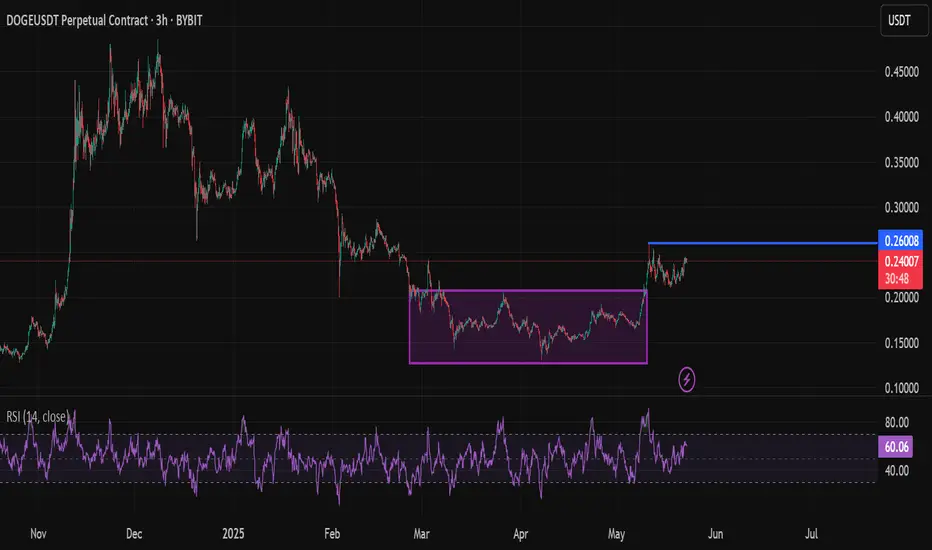
0.26 is a critical level for $DogeAfter spending about two months in the accumulation box Doge is trying to go on a journey of its own. $0.26 is a critical level. If CRYPTOCAP:DOGE manages to break it we might see the usual oscillations boom in the coming weeks.
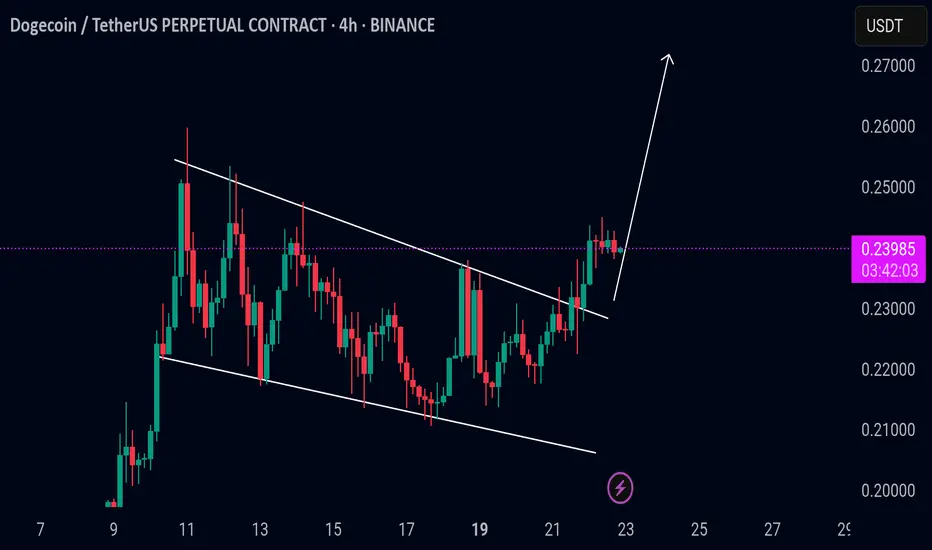
DOGE/USDT breakout alertDOGE/USDT breakout alert
DOGE has broken out of the bull flag pattern and is currently showing bullish momentum. The bull flag is a continuation pattern, and this breakout suggests the potential for further upward movement if the breakout holds with strong volume.
However, if the price falls back into the flag channel, it could be a fakeout, so it's important to monitor closely.
Key levels to watch:
* Breakout confirmation zone
* Flag support area
* Volume strength for confirmation
Keep an eye on DOGE — a confirmed move above the flag could trigger the next leg up.
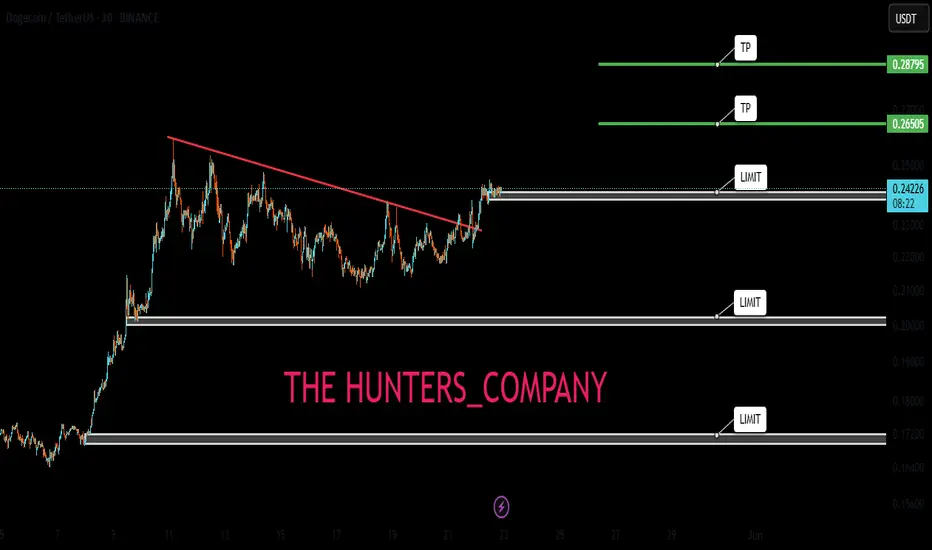
DOGECOIN (FREE SIGNAL)Hello friends
Given the good growth we had, the price has corrected and now is a good time to buy step by step and with capital management...
We have specified the purchase steps for you and the target is also specified...
*Trade safely with us*
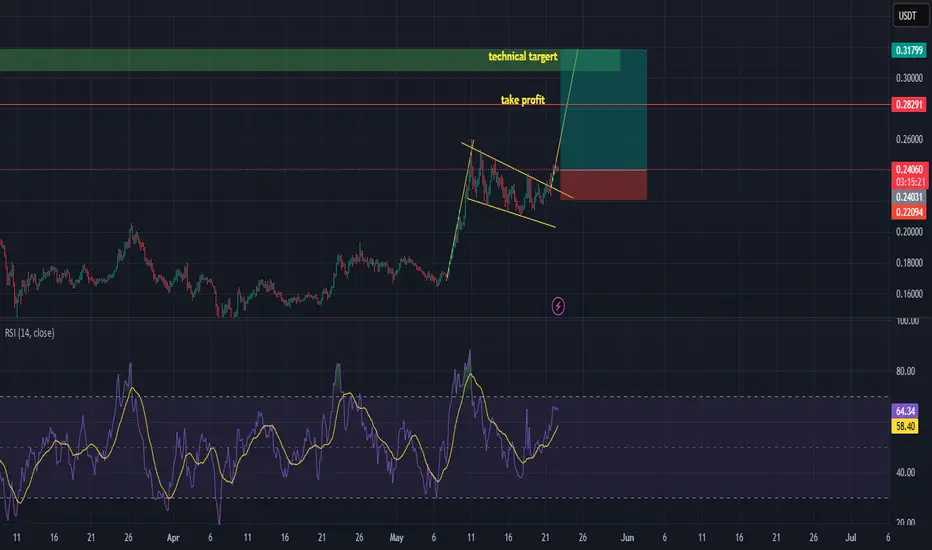
DOGEUSDT bull flag pattern playing outhi traders,
DOGEUSDT formed a bull flag and had a successful breakout.
The long position can still be taken.
30% upside potential in the next few days.
Risk-reward ratio: 4,01
Take profit and technical target for the bull flag formation are shown on the chart.
Good luck
DOGE LONG TERMMy scenario is like this.
* The purpose of my graphic drawings is purely educational.
* What i write here is not an investment advice. Please do your own research before investing in any asset.
* Never take my personal opinions as investment advice, you may lose your money.
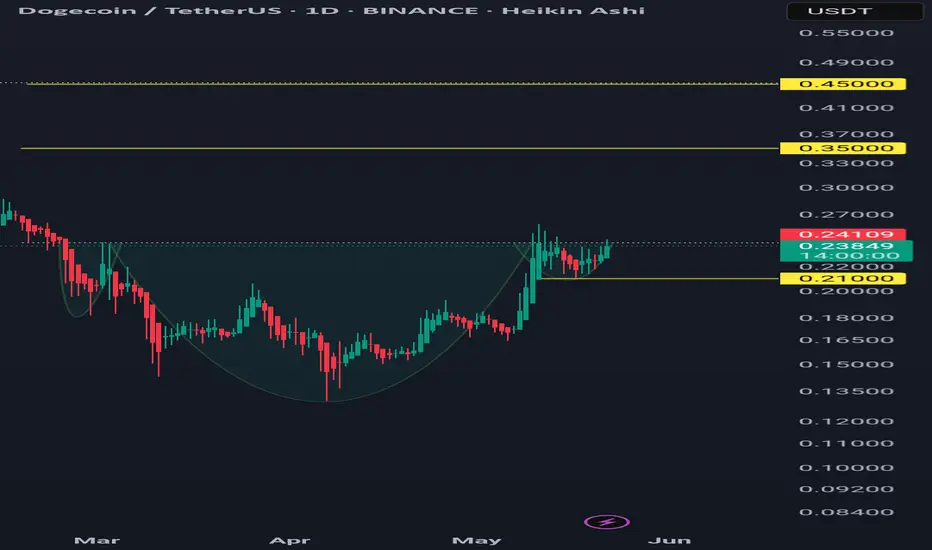
DOGEUSDT daily tf Bullish iH&S patternIf closes above 0.245 in Daily TF it may activate the pattern.
Targets are 0.35 and 0.45
Invalidation a close below 0.21 (below low of right shoulder).
DOGE Ready for PUMP or what ?I might be wrong , but it might come true From a technical perspective!!!
Give me some energy !!
✨We spend hours finding potential opportunities and writing useful ideas, we would be happy if you support us.
Best regards CobraVanguard.💚
_ _ _ _ __ _ _ _ _ _ _ _ _ _ _ _ _ _ _ _ _ _ _ _ _ _ _ _ _ _ _ _
✅Thank you, and for more ideas, hit ❤️Like❤️ and 🌟Follow🌟!
⚠️Things can change...
The markets are always changing and even with all these signals, the market changes tend to be strong and fast!!

DOGECOIN Eyes Major Breakout – Trend Channel in Controlhello guys!
doge seems potential now!
DOGECOIN has successfully broken out of a long-standing bearish trendline and is now respecting a well defined ascending channel structure.
After a clean retest of both the midline and the demand block around 0.1950–0.2150, the price is showing renewed bullish pressure. As long as price holds above this key support zone, we can expect further continuation to the upside.
what I see:
✅ Breakout of descending trendline confirmed
✅ Strong structure support from the demand block (0.1950–0.2150)
✅ Clean reaction from channel midline
✅ Momentum currently favors continuation of the bullish trend
🎯 Bullish Targets:
TP1: 0.2530 (recent swing high)
TP2: 0.2750 (channel upper boundary)
TP3: 0.3035 (major horizontal resistance zone)
🛑 Stop-loss idea: Below 0.1950 (invalidates bullish structure)

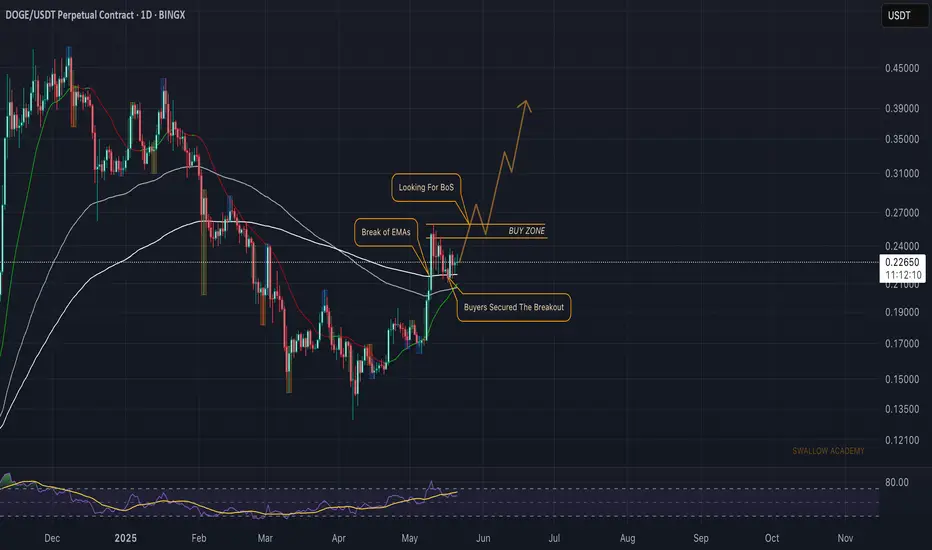
Dogecoin (DOGE): Breakout From EMAs + Successful Re-Test | BOS?Dogecoin had recently broken the lines of EMAss (100 & 200), where, after a successful retest, buyers took over the area and now are heading towards the Break of Structure Area.
Once we get the BOS, we will be looking for a long position near this area, so we wait for now...
Swallow Academy
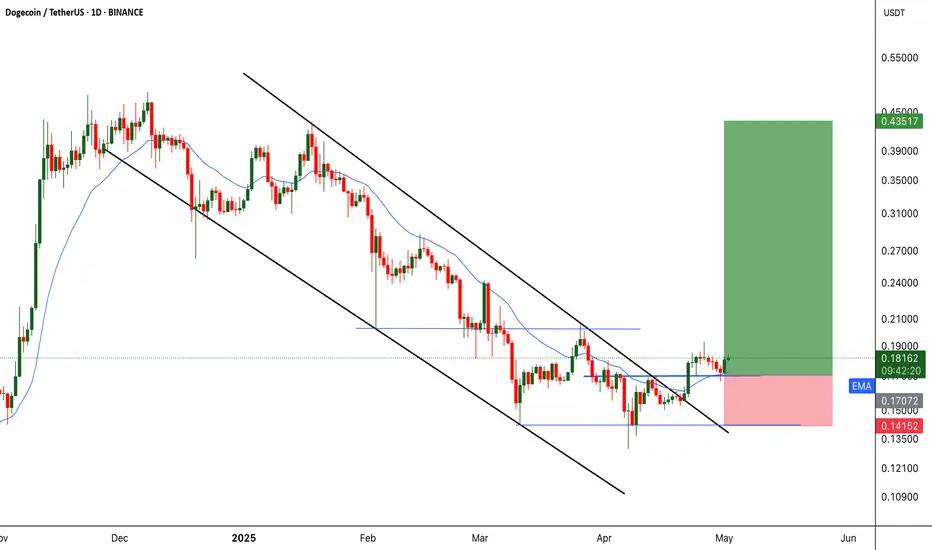
DOGE Awakens: Breakout from Descending Channel!!BINANCE:DOGEUSDT has finally broken free from its long-term descending channel, signaling a potential trend reversal after months of consolidation. What makes this move significant is the current retest of the previous local breakout level. A classic bullish setup that often leads to strong upward continuation if the retest holds.
The price action is also showing early signs of strength, forming a series of higher highs, which further confirms the bullish structure. This technical development, combined with CRYPTOCAP:DOGE ’s passionate fanbase and historical tendency to pump hard when momentum kicks in, could make this a high-potential setup.
As always, proper risk management is key. While the chart looks promising, it’s crucial to place a stop loss to protect against invalidation. If the support holds, CRYPTOCAP:DOGE could be preparing for a big move — possibly one of those signature rallies that only CRYPTOCAP:DOGE knows how to deliver.
BINANCE:DOGEUSDT Currently trading at $0.181
Buy level : Above $0.17
Stop loss : Below $0.141
Target : $0.435
Max leverage 3x
Always keep stop loss
Follow Our Tradingview Account for More Technical Analysis Updates, | Like, Share and Comment Your thoughts
Doge/Usdt Long Turbo mode onA major breakout in Doge/USDT is expected to start soon. The cup and handle formation is about to be completed. The bull mode is about to be activated, everyone should take their positions. We are starting.

"DOGE - Time to buy again!" (Update)So if you pay attention to the doge chart you can see that the price has formed a Ascending FLAG or wedge which means it is expected to price move as equal as the measured price movement.( AB=CD )
NOTE: wait for break of the FLAG .
Give me some energy !!
✨We spend hours finding potential opportunities and writing useful ideas, we would be happy if you support us.
Best regards CobraVanguard.💚
_ _ _ _ __ _ _ _ _ _ _ _ _ _ _ _ _ _ _ _ _ _ _ _ _ _ _ _ _ _ _ _
✅Thank you, and for more ideas, hit ❤️Like❤️ and 🌟Follow🌟!
⚠️Things can change...
The markets are always changing and even with all these signals, the market changes tend to be strong and fast!!

Phemex Analysis #82: Pro Tips for Trading Dogecoin (DOGE)Dogecoin (DOGE), once known primarily as a playful meme token, has proven it can produce substantial market movements, drawing significant attention from traders and investors. Notably, in October 2024, DOGE made headlines with a stunning 500% rally, soaring from $0.11 to a peak of $0.48. Yet, as swiftly as it surged, Dogecoin experienced a sharp reversal, dropping nearly 70% to its current price around $0.15.
Recently, technical indicators have hinted at potential opportunities. On March 11, DOGE's price dipped below the level seen on February 28, yet the Relative Strength Index (RSI) remained steady, creating a bullish divergence—often signaling a potential reversal. But before traders jump in, let’s carefully examine a few possible scenarios using key support and resistance levels as a roadmap.
Possible Scenarios
1. Bullish Reversal
The RSI divergence observed on the daily chart suggests decreasing selling momentum, hinting at a possible bullish reversal. If DOGE manages to break decisively above nearby resistance levels, renewed buying interest could emerge, pushing the price higher.
Pro Tips:
Entry Strategy: Look for a confirmed breakout above the key resistance zones of $0.261 and $0.286, ideally accompanied by increased trading volume.
Risk Management: To mitigate risk, set stop-loss orders below the recent support level of $0.21, ensuring you’re protected if the anticipated reversal fails.
2. Consolidation Phase
Following substantial price moves, DOGE may enter a period of sideways trading as the market consolidates gains or losses. During this phase, the price could oscillate within a defined range, offering opportunities for both traders and long-term investors to accumulate strategically.
Pro Tips:
Identify Key Levels: Closely monitor the key support at $0.21 and resistance around $0.261 to effectively execute range-based trading strategies.
Utilize Grid Bots: Due to lower volatility during consolidation, deploying grid trading bots can help systematically capture profits from minor price fluctuations.
3. Continued Downtrend
Despite recent positive signals, Dogecoin remains susceptible to broader market conditions. If DOGE breaks below the critical support at $0.21, bearish sentiment could intensify, resulting in further price declines toward lower support levels.
Pro Tips:
Short Positions: Advanced traders may consider short-selling DOGE below key support levels, profiting from continued downward pressure while maintaining a clearly defined exit strategy.
Long-Term Accumulation: For investors with a longer-term perspective, significant price dips near lower supports—such as $0.164, $0.15, or even $0.13—could represent attractive opportunities to accumulate DOGE at discounted valuations.
Conclusion
Dogecoin’s volatility continues to present unique trading opportunities alongside considerable risks. Traders must carefully analyze technical indicators like RSI divergences and closely monitor market sentiment and broader crypto trends. By understanding the scenarios outlined above, employing disciplined risk management, and remaining patient during market fluctuations, traders can confidently navigate DOGE’s price movements, positioning themselves strategically for potential rewards.
Pro Tips:
Armed Your Trading Arsenal with advanced tools like multiple watchlists, basket orders, and real-time strategy adjustments at Phemex. Our USDT-based scaled orders give you precise control over your risk, while iceberg orders provide stealthy execution.
Disclaimer: This is NOT financial or investment advice. Please conduct your own research (DYOR). Phemex is not responsible, directly or indirectly, for any damage or loss incurred or claimed to be caused by or in association with the use of or reliance on any content, goods, or services mentioned in this article.
