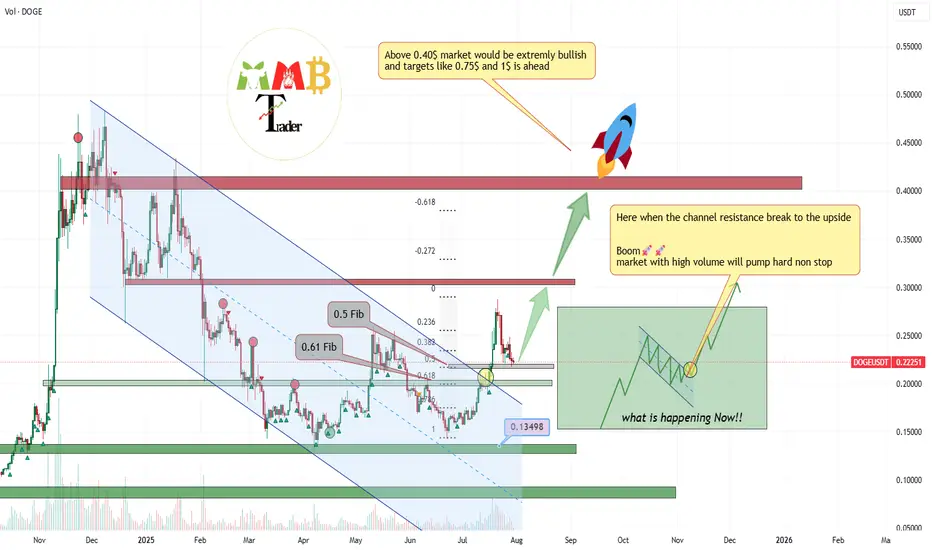
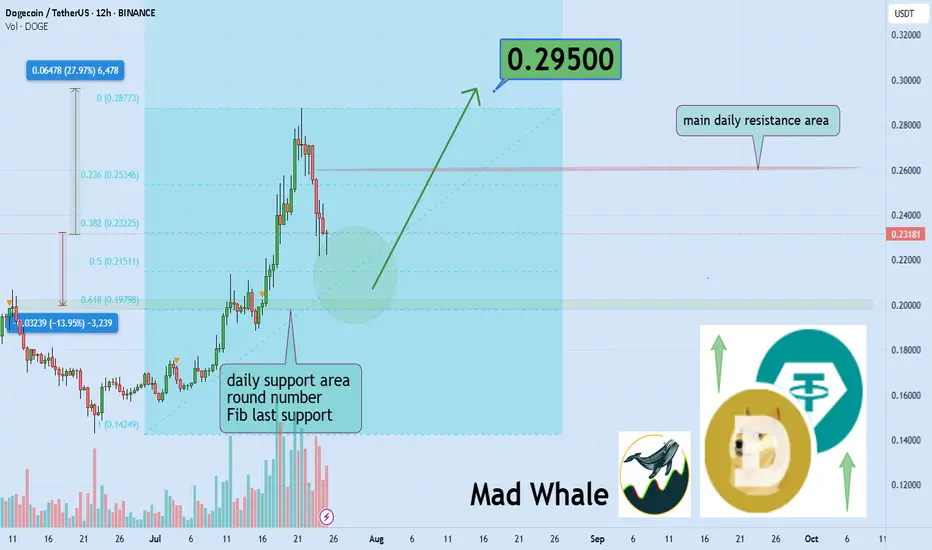
DOGEUSDT is testing 0.5 Fibonacci support (more gain)As we can see the breakout of red trendline also completed and volume increases after that and now market is testing major Fib levels like 0.5 & 0.61 soon we can expect more pump and gain here like the green arrows.
so many stop loss also hit on this fast correction to the downside and price is rea
Related pairs
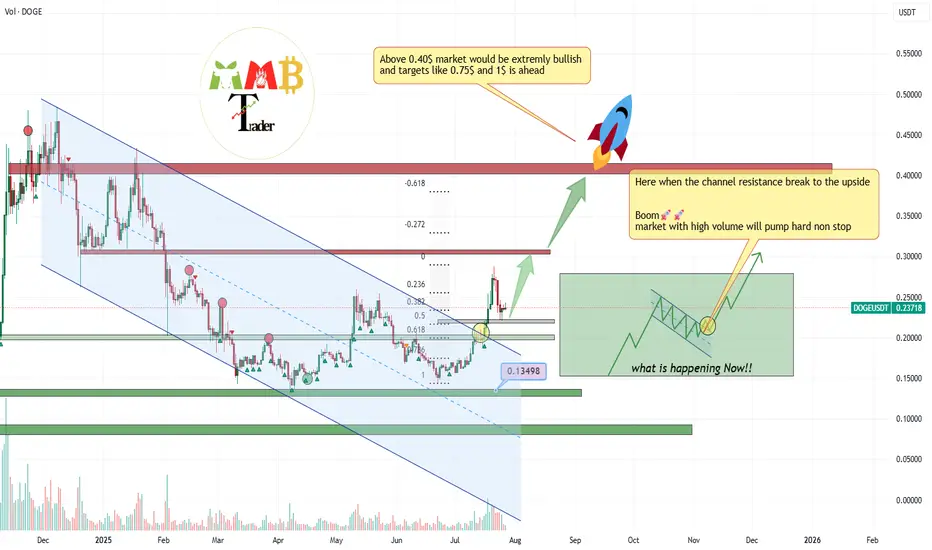
Those daily +20% to +30% candles soon will appear!!Those Fibonacci levels which are last supports for healthy & #Bullish market are all touching i mean the 0.218$(0.5 #Fibonacci) & 0.202(0.61 #Fibonacci) and i think these supports are strong enough to stop the correction and soon again it will pump and even can break daily high near 0.42$ and hit ta
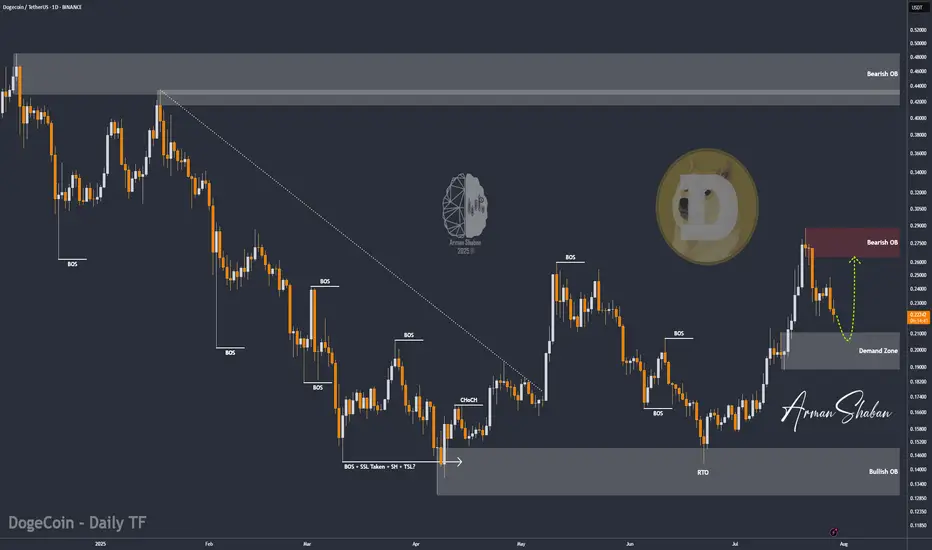
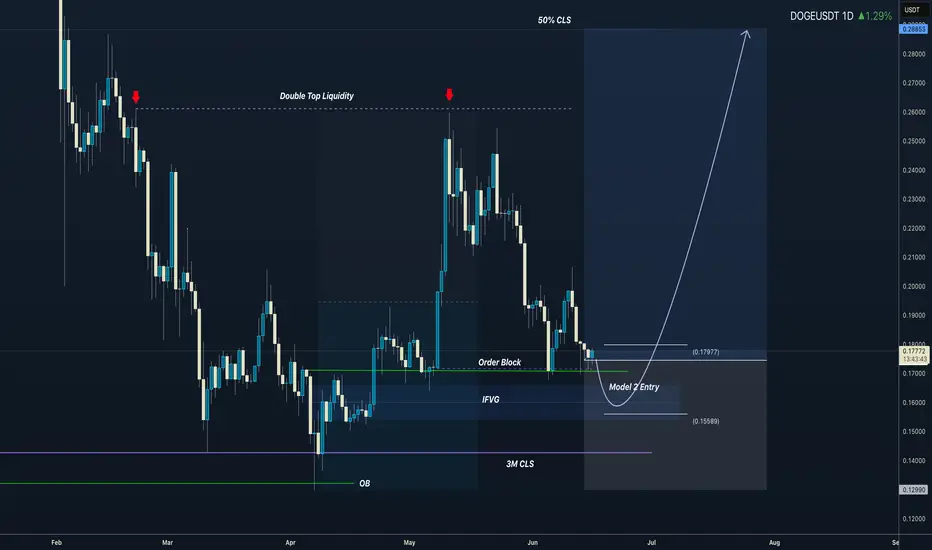
DOGE/USDT | Eyes Bounce from Key Support – Next Targets Ahead!By analyzing the Dogecoin chart on the daily timeframe, we can see that after reaching the $0.29 area, the price entered a correction and is now trading around $0.22. If DOGE dips into the key support zone between $0.19–$0.21, we could expect a strong bullish reaction. The next potential targets are
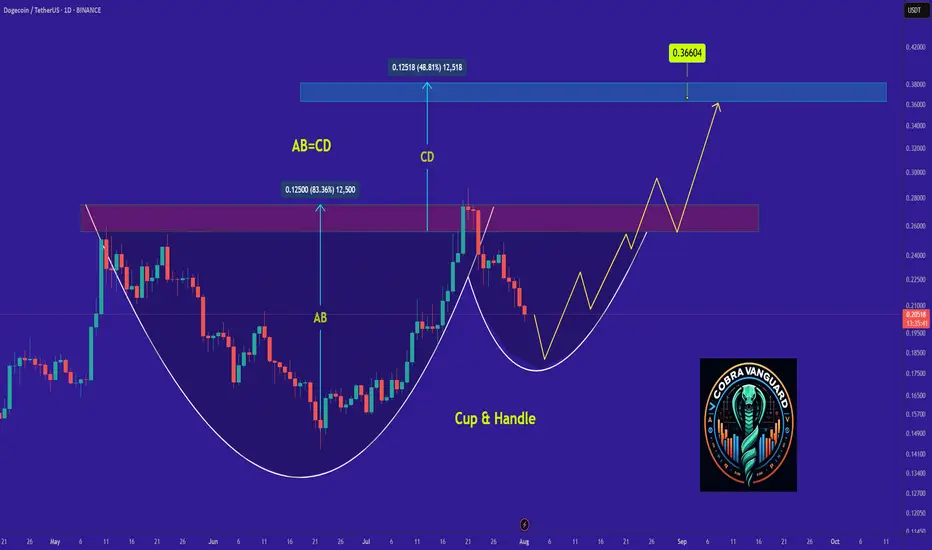
Why DOGE Remains Bullish and Its Next Potential Move !It appears that the price is forming a cup and handle pattern, and if this occurs, it could push the price above $0.30.
Best regards CobraVanguard.💚
The Pullback Panic? Your Whole Plan Dies?!!!!!One red candle is all it takes to destroy your entire plan.
Why do we panic so fast? Why do we exit too early before a rally?
And worse: why do we FOMO back in at the worst possible time?
Hello✌️
Spend 3 minutes ⏰ reading this educational material.
🎯 Analytical Insight on Dogecoin:
BINANCE:D
3M CLS I KL - OB I Model 2 I Targe 50% CLSHey, Market Warriors, here is another outlook on this instrument
If you’ve been following me, you already know every setup you see is built around a CLS Footprint, a Key Level, Liquidity and a specific execution model.
If you haven't followed me yet, start now.
My trading system is completely
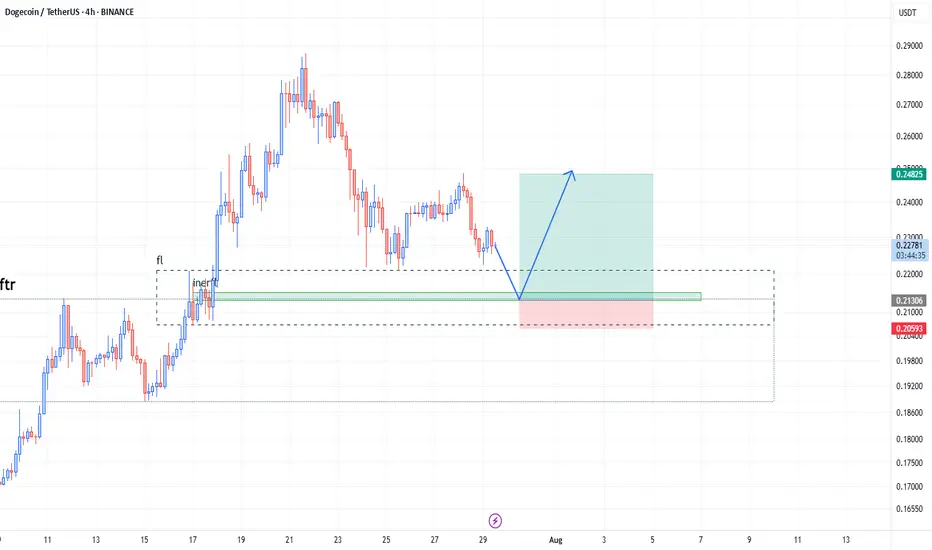
Lingrid | DOGEUSDT Pullback and Continuation OpportunityBINANCE:DOGEUSDT is currently testing the intersection of its upward channel support and a critical horizontal zone near 0.21378, after a steep corrective decline from the 0.28628 resistance area. The recent price action formed a rounded pullback, suggesting potential accumulation near trendline co

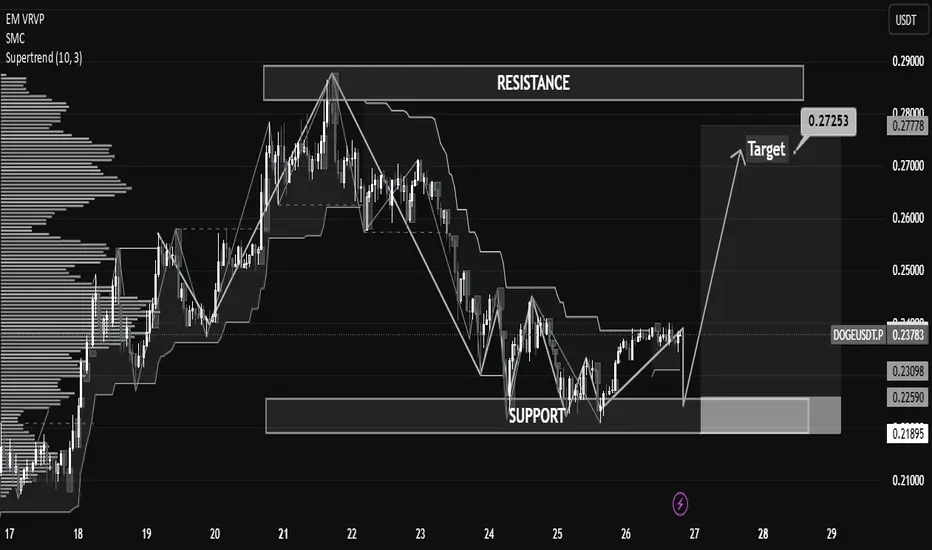
DOGE/USDT Technical Analysis – Breakout AnticipationDOGE/USDT Technical Analysis – Breakout Anticipation
As of the current market structure, DOGE/USDT is showing signs of a potential bullish reversal from the demand zone (support), aiming toward the projected target at 0.27253 USDT.
🔍 Chart Structure & Price Action
Support Zone (0.21873 – 0.22568):
dogeusdtMy opinion is based on the Arti M strategy. Share your thoughts with me. Is your opinion right or wrong?
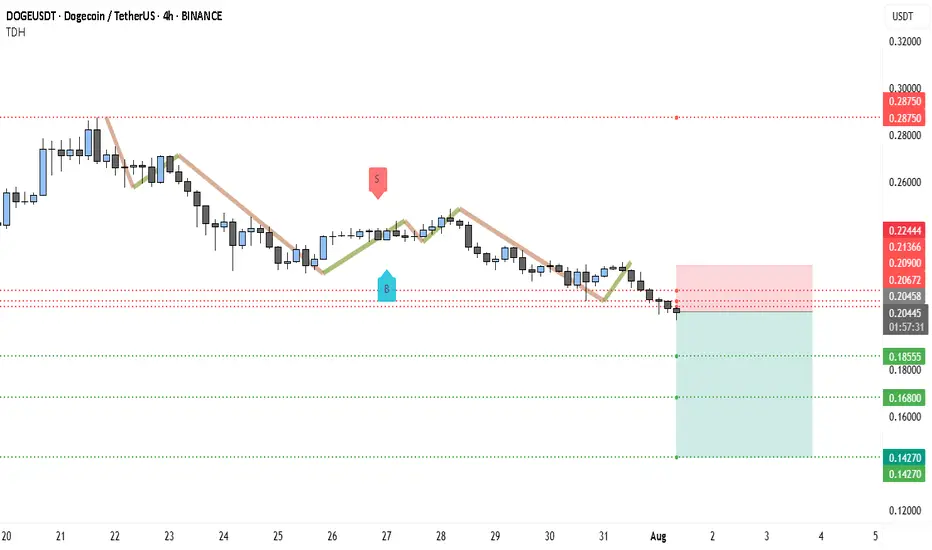
Bears Target $0.14 DOGE — Is the Trend Your Friend?DOGEUSDT has been in a clear downtrend since late July, printing consistent lower highs and lower lows. The current market structure shows sellers firmly in control, with every bullish bounce quickly fading. The recent rejection near $0.2244 and the inability to sustain above the $0.21 zone highligh
See all ideas
Summarizing what the indicators are suggesting.
Oscillators
Neutral
SellBuy
Strong sellStrong buy
Strong sellSellNeutralBuyStrong buy
Oscillators
Neutral
SellBuy
Strong sellStrong buy
Strong sellSellNeutralBuyStrong buy
Summary
Neutral
SellBuy
Strong sellStrong buy
Strong sellSellNeutralBuyStrong buy
Summary
Neutral
SellBuy
Strong sellStrong buy
Strong sellSellNeutralBuyStrong buy
Summary
Neutral
SellBuy
Strong sellStrong buy
Strong sellSellNeutralBuyStrong buy
Moving Averages
Neutral
SellBuy
Strong sellStrong buy
Strong sellSellNeutralBuyStrong buy
Moving Averages
Neutral
SellBuy
Strong sellStrong buy
Strong sellSellNeutralBuyStrong buy
Displays a symbol's price movements over previous years to identify recurring trends.
Frequently Asked Questions
The current price of Dogecoin / USDT (DOGE) is 0.19000 USDT — it has fallen −5.71% in the past 24 hours. Try placing this info into the context by checking out what coins are also gaining and losing at the moment and seeing DOGE price chart.
Dogecoin / USDT price has fallen by −17.72% over the last week, its month performance shows a 15.27% increase, and as for the last year, Dogecoin / USDT has increased by 66.14%. See more dynamics on DOGE price chart.
Keep track of coins' changes with our Crypto Coins Heatmap.
Keep track of coins' changes with our Crypto Coins Heatmap.
Dogecoin / USDT (DOGE) reached its highest price on May 8, 2021 — it amounted to 0.76367 USDT. Find more insights on the DOGE price chart.
See the list of crypto gainers and choose what best fits your strategy.
See the list of crypto gainers and choose what best fits your strategy.
Dogecoin / USDT (DOGE) reached the lowest price of 0.00043 USDT on Jan 11, 2020. View more Dogecoin / USDT dynamics on the price chart.
See the list of crypto losers to find unexpected opportunities.
See the list of crypto losers to find unexpected opportunities.
The safest choice when buying DOGE is to go to a well-known crypto exchange. Some of the popular names are Binance, Coinbase, Kraken. But you'll have to find a reliable broker and create an account first. You can trade DOGE right from TradingView charts — just choose a broker and connect to your account.
Crypto markets are famous for their volatility, so one should study all the available stats before adding crypto assets to their portfolio. Very often it's technical analysis that comes in handy. We prepared technical ratings for Dogecoin / USDT (DOGE): today its technical analysis shows the strong sell signal, and according to the 1 week rating DOGE shows the sell signal. And you'd better dig deeper and study 1 month rating too — it's buy. Find inspiration in Dogecoin / USDT trading ideas and keep track of what's moving crypto markets with our crypto news feed.
Dogecoin / USDT (DOGE) is just as reliable as any other crypto asset — this corner of the world market is highly volatile. Today, for instance, Dogecoin / USDT is estimated as 7.84% volatile. The only thing it means is that you must prepare and examine all available information before making a decision. And if you're not sure about Dogecoin / USDT, you can find more inspiration in our curated watchlists.
You can discuss Dogecoin / USDT (DOGE) with other users in our public chats, Minds or in the comments to Ideas.