DOGEUSDT Above Key SupportHi there,
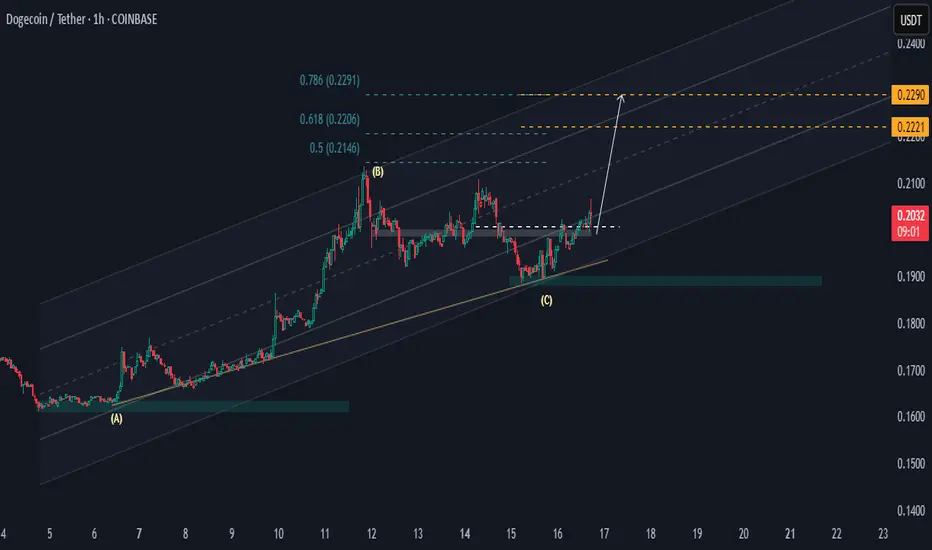
DOGE/USDT looks bullish at H1 with two potential price targets for a bias of 0.2290.
The price made a higher low at the 0.1900 area zone and pushed above the key level of 0.1990, and it is hovering above this level. Now, as long as the 0.1900 sustains the 0.1963 low, then the price will rally to previous highs.
Happy Trading,
K.
DOGEUSDT trade ideas
#DOGE Update #1 – July 21, 2025#DOGE Update #1 – July 21, 2025
Dogecoin has made healthy retracements after both of its last impulsive moves, maintaining a technically sound structure. I took a profit yesterday but didn’t share it due to higher risk.
Now, I've opened the Long position visible in the chart because I believe DOGE is targeting the second leg of this impulsive move, aiming for the $0.29 zone. I’m expecting approximately 6% gain from this setup.
The trend remains bullish, and pullbacks have been met with solid support, giving this trade a high probability of continuation. That said, always be cautious with sharp volatility.

$1 in the Horizon for $DOGE!We’ve got something interesting brewing on CRYPTOCAP:DOGE right now:
Monthly trend is active
Uptrend in place for over a year (not relying on that timeline, but historically, targets hit within it)
If we can get above $0.30 and hold, the path to $1 opens up for the first time.
Other similar charts are also aligning for exponential moves, setting up to break out of multi-year consolidation patterns.
Keep a close eye on CRYPTOCAP:XLM as well — it’s shaping up with a very similar structure.
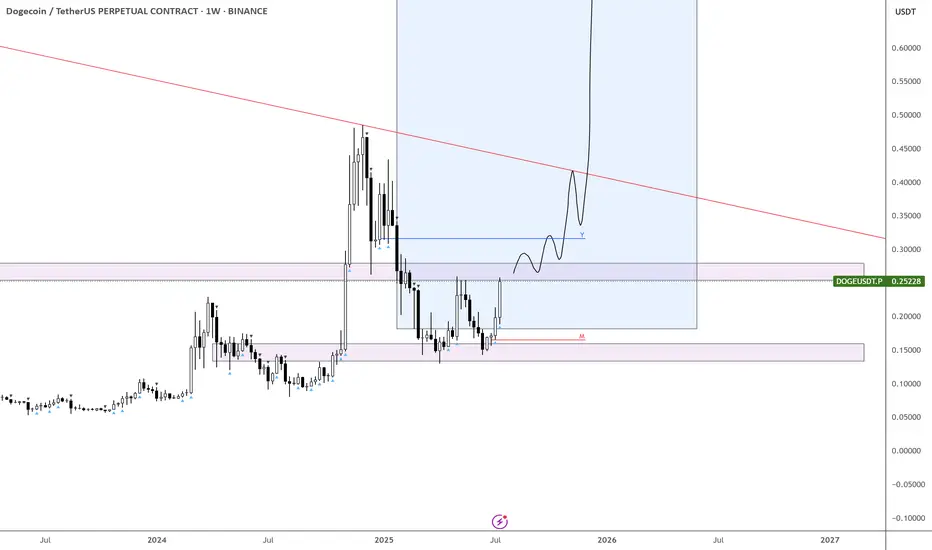
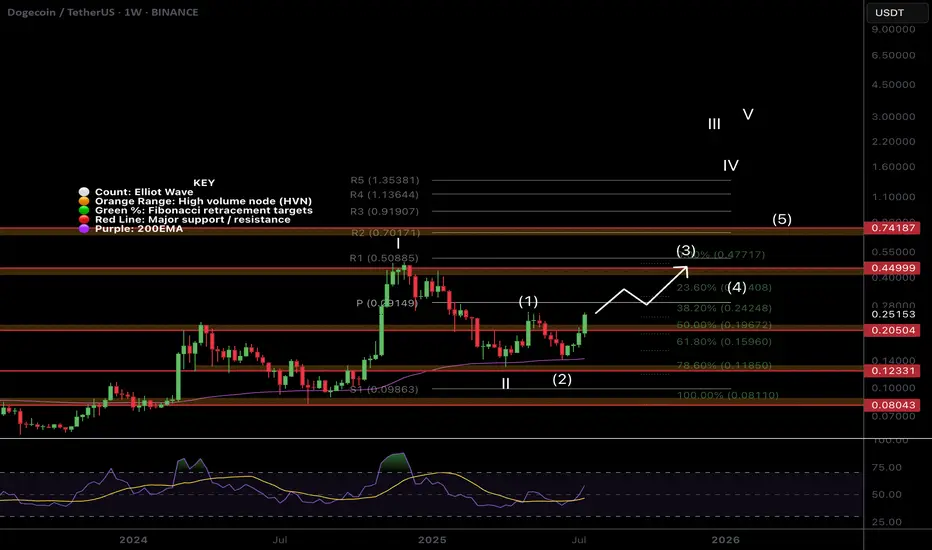
$DOGE Flipping to Bullish Structure!CRYPTOCAP:DOGE is coming to life after a second test of the weekly 200EMA as support and about to make a higher high, cementing in that higher low and flipping the macro structure bullish!
If the count is correct wave 3 of (III) should be powerful! The weekly pivot should put up a challenge as the first resistance before the High Volume Node at $0.45
Safe Trading

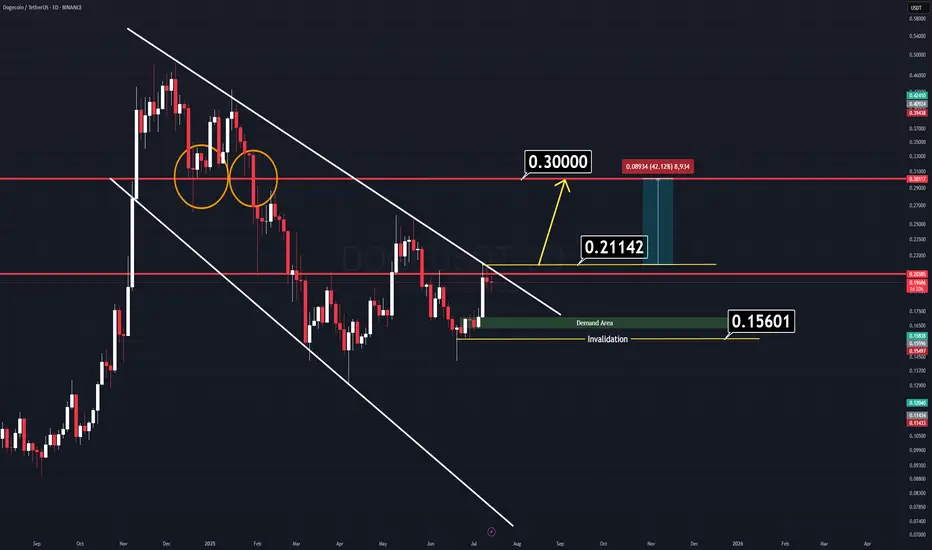
DOGE Analysis (3D)There’s a very simple and clear chart setup on Dogecoin (DOGE) right now.
We have two major horizontal key levels and a channel that is about to break down. If the price manages to close above the yellow-marked line ($0.21142), we can expect a strong rally to follow.
There’s no need for complicated indicators cluttering the screen — all relevant levels are clearly marked on the chart.
Two Logical Entry Approaches:
1️⃣ Breakout Entry: Enter on a confirmed breakout. (Waiting for a daily candle close on a memecoin might slightly reduce your profit range, but it’s the safer approach.)
2️⃣ Demand Zone Entry: Wait for the price to retrace to the green demand zone — though this scenario seems less likely for now.
A combined approach can work best: enter on breakout, use the horizontal levels as support, and set a tight stop-loss to manage risk.
Good Luck.
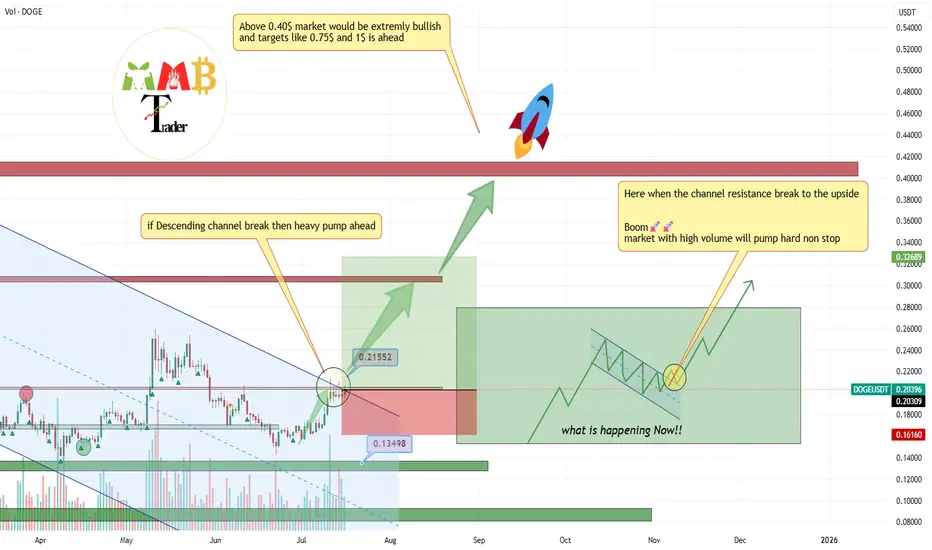
DOGEUSDT Analysis : Trendline Decision & Dual Directional Point📌 Market Context & Current Setup:
DOGEUSDT has been trading within a well-defined descending channel, respecting a strong trendline resistance, which has acted as a bearish ceiling for several sessions. The price action has been heavily influenced by supply zones formed after sharp impulsive drops, creating multiple QFL (Quick Flip Levels) — key to spotting structural bottoms and high-probability reversal zones.
Currently, the price is hovering near a critical decision point, where two key scenarios may play out:
A breakout and bullish reversal toward major resistance
A dip into a deep demand zone for final accumulation before reversal
Your plan reflects MMC (Market-Mind-Confirmation) methodology, preparing for either scenario with clear levels, logic, and psychology in place.
📐 Technical Breakdown:
🔻 1. Trendline Confirmation (Bearish Control):
The price has respected the downtrend line multiple times, confirming strong bearish momentum.
No candle body has closed decisively above it, showing sellers still have control.
However, price is now consolidating near this line, indicating a potential weakening of selling pressure — a classic sign of upcoming trend exhaustion.
🟩 2. Support Zones – Structural Layers:
📍 Minor Zone (S/R Flip – ~$0.215–0.220):
This zone is a previous support turned resistance.
It’s the first checkpoint the price needs to reclaim to confirm a breakout.
A successful flip from resistance back to support would add strong bullish confidence.
🟩 Reversal Zone (~$0.185–0.190):
Marked on your chart as a "Reversal Area" — likely derived from QFL methodology.
Price has historically bounced from this area, indicating buyers are willing to step in aggressively.
This zone aligns with smart money demand accumulation and could serve as a final liquidity sweep zone before a major reversal.
📍 Major Resistance Zone (~$0.250–0.260):
The next major objective once a trendline break is confirmed.
Also aligns with previous highs and volume nodes — a solid target for bullish trades.
🔄 Scenario-Based Strategy:
📈 Scenario 1 – Breakout Toward Major Resistance:
Price breaks above the descending trendline and reclaims the minor S/R zone.
This would confirm a bullish structure shift, validating that sellers are losing strength.
After reclaiming ~$0.215, the path toward $0.240–0.260 opens up.
Retests or flag breakouts within this range can be re-entry points for trend traders.
📉 Scenario 2 – Deeper Retest and Accumulation:
If the price fails to break out and dips further, the reversal demand area (~$0.185) becomes critical.
This is where buying pressure is expected to return, and as labeled in your chart:
👉 “If it goes down, we will double the supply”
This suggests an averaging-down or pyramiding strategy based on strong structural confidence.
This technique is valid only when the area is backed by solid confluence (trend exhaustion, demand, and past bounces).
🧠 MMC Strategy (Market – Mind – Confirmation):
Market: Bearish short-term trend, but price is approaching oversold territory near structural demand.
Mind: You’re prepared for both outcomes – breakout or dip. Emotion is out of the plan.
Confirmation: You wait for signs — break and retest of trendline, bullish engulfing candles, or wick rejections from demand.
This mental clarity helps maintain trading discipline and keeps emotional bias out of decision-making.
⚙️ Execution Plan:
Component Scenario 1 (Breakout) Scenario 2 (Deep Buy Zone)
Entry Signal Break & close above trendline + minor SR reclaim Bullish reversal candle within demand zone
Stop Loss Below trendline + S/R flip (~0.210) Below demand zone (~0.182)
Target 1 $0.235 $0.235
Target 2 $0.255–$0.260 $0.255–$0.260
Risk Level Medium Higher R:R potential
Strategy Notes Aggressive on confirmation only Add to position on wick traps
🧠 Trader Psychology Tips:
Be patient — confirmation beats prediction.
Set alerts at key levels to avoid emotional entries.
Scaling into trades based on zone reactions builds flexibility and control.
"Double the supply" approach must be paired with strict invalidation levels.
✅ Summary:
DOGE is trading within a descending wedge.
Key decision zones are marked clearly (trendline, S/R flip, reversal demand).
Breakout could lead to a quick 15–25% upside.
Reversal zone offers great R:R with accumulation opportunity.
Strategy is well-aligned with disciplined execution and trader psychology.

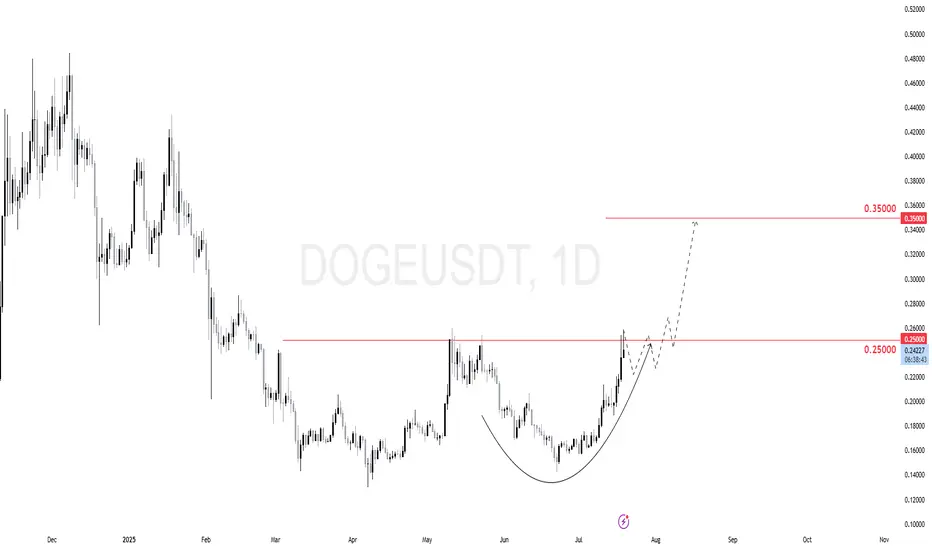
$DOGE (DOGECOIN) 1DDOGE just broke above the 0.25 key resistance.
The daily chart shows a clean cup-and-handle formation with a potential continuation setup.
Price might consolidate just above 0.25, creating a bullish base.
Then we expect a continuation move toward 0.35 as next target.
DOGEUSDT WEEKLY CHART | MY FAVORITEHELLO, DOGEUSDT
MEMECOIN my favoritoo
This is just my basic analysis. I see that DOGEUSDT Weekly looks very promising.
Why the Weekly? Because I’m aiming for the long term with DOGEUSDT — i'm Doge Holder..
Only patient people will reap the rewards of their efforts.
Remember, trading involves risk, and you are responsible for your own decisions — manage your finances wisely.

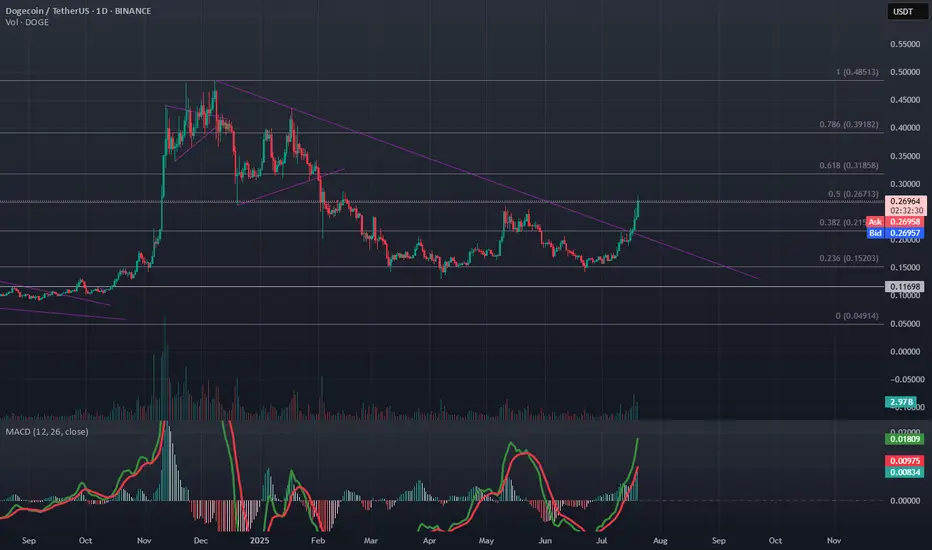
DOGE - Major W Reversal Pattern?Dogecoin (DOGE/USDT) is forming what appears to be a textbook W pattern on the daily timeframe — a bullish reversal signal that could indicate a strong upside move.
🔹 Key levels:
• Support: Around $0.12
• Resistance: Neckline at ~$0.26
• Breakout target: $0.40+
🔍 Pattern Insight:
This W pattern (double bottom) shows that sellers lost momentum, and bulls are stepping in. If we break and close above the neckline with strong volume, a rally toward $0.40 and above is on the table.
⚠️ Watch for:
• Break and retest of $0.26
• RSI confirmation
• Volume breakout
💬 Let me know in the comments — is DOGE getting ready for liftoff?
#Dogecoin #Crypto #TradingView #Altcoins #TechnicalAnalysis #DOGEUSDT #ChartPatterns

DOGE Weekly Double Bottom: Eyeing 5 Fibonacci TargetsDogecoin (DOGEUSD) is showing a bullish double bottom pattern on the weekly chart, suggesting a potential long-term reversal from previous downtrends. This classic accumulation pattern is forming near a key historical support level, adding confidence to the bullish case.
Using Fibonacci extensions from the neckline breakout, I’ve identified 5 major target zones:
Target 1: 0.35054 — conservative target confirming breakout
Target 2: 0.47606 — often hit during early momentum phases
Target 3: 0.59212 — key level for profit-taking and resistance
Target 4: 0.92785 — full measured move of the double bottom
Target 5: 1.16687 — aggressive bull target if momentum continues
The breakout is only confirmed if price holds above the neckline with strong volume. Risk management is crucial in case of a retest or false breakout.
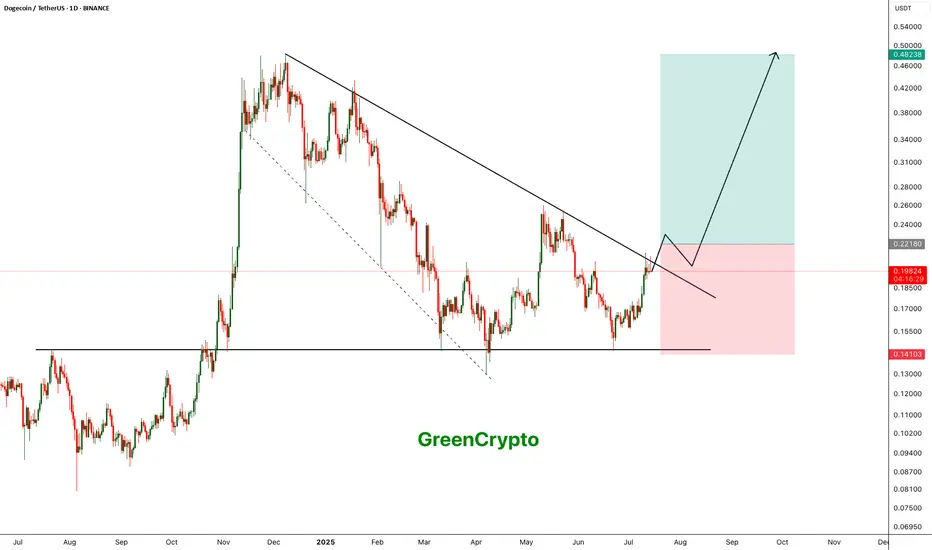
DOGE - Another Perspective- DOGE is currently trading nearing the trendline resistance and pending breakout
- A clear breakout from this resistance line is a must to continue to bullish momentum.
- we will enter the trade after confirmed breakout
Entry: 0.221
SL at: 0.14103
TP1: 0.26035
TP2: 0.33892
TP3: 0.47751
Stay tuned for more updates.
Cheers
GreenCrypto
#DOGEUSDT: Swing Move In Making! Get ReadyThe cryptocurrency market is currently experiencing a rally due to the bullish trend of the underlying assets. The price has experienced a period of accumulation, followed by a distribution process. We have established a swing target based on the potential for the price to reach the previous record high. Technical indicators support our analysis, but we acknowledge the need for strong fundamental support to achieve this level.
We wish you the best of luck in your trading endeavours and encourage you to share our insights by liking and commenting on this post.
Sincerely,
Team Setupsfx_
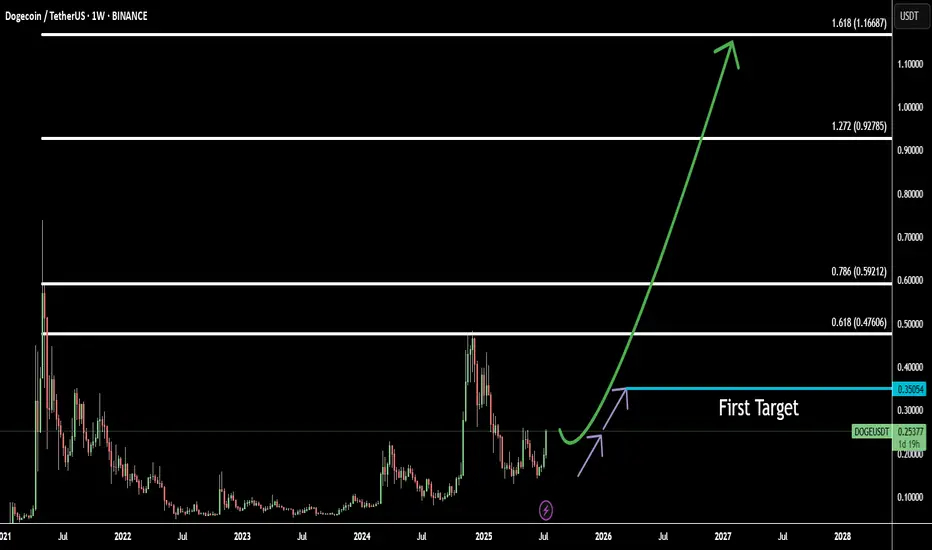
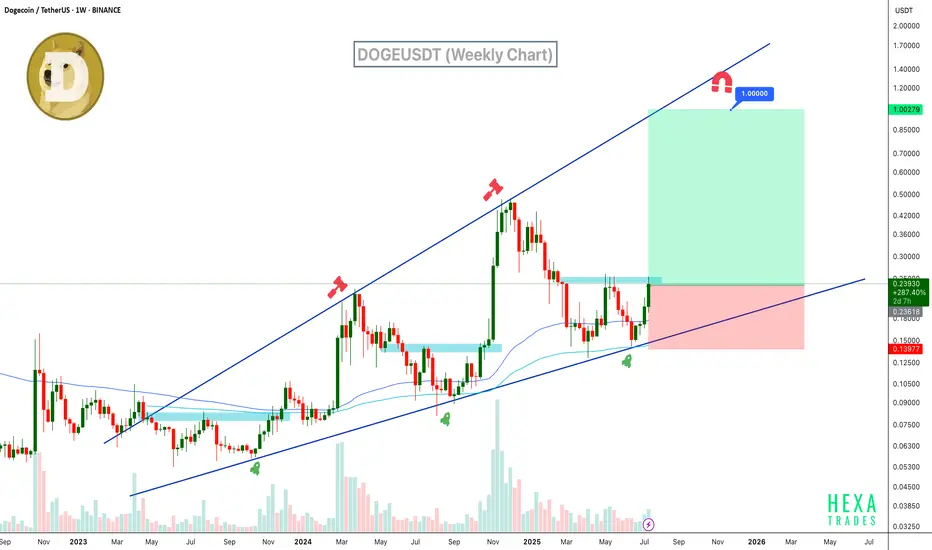
Will DOGE Hit $1? Ascending Broadening Wedge in PlayDogecoin is trading within a clear ascending broadening wedge on the weekly chart. The price has bounced strongly from wedge support and the 100 and 200 EMAs, now pushing upward with growing volume and bullish candles. If momentum sustains, DOGE could rally toward the $1 psychological target and broadening wedge resistance.
Resistance 1: $0.35
Resistance 2: $0.60
Resistance 3: $1.00
Stop Loss: $0.14
Cheers
Hexa
COINBASE:DOGEUSD BINANCE:DOGEUSDT
DO GE - Call the Ambulance!Okay DOGE thinks he is smart but he aint he will be taking hype and fall down and fall down in the place where no one can expect! Quasimodo in position!

DOGEUSDT major breakout to the upside with at least 2x cookingThis breakout would be huge and it is happening now at least +60% gain is easy target so we put Take profit 1 there with our buy Setup which is 1:3(Risk:Reward).
Hope you all enjoy and it is time for BINANCE:DOGEUSDT to #pump this time and be a leader of MEME for weeks.
DISCLAIMER: ((trade based on your own decision))
<<press like👍 if you enjoy💚
$DOGE Double Bottom TargetIf this double bottom "W" pattern on CRYPTOCAP:DOGE plays out, the target is $0.47.
Two notes:
1. The double-bottom pattern has a 60-65% success rate (no guarantees).
2. The Alt market has been very strong, with new dollars entering the market. If we close above $0.25-0.26 and retest, I think this target is likely as it returns to the high for this cycle.

Dogecoin Leads Meme Coins With 12% Rally In 24 HoursBINANCE:DOGEUSDT , the leader of meme coins, surged 12% over the last 24 hours , reaching $0.239. This rally has positively impacted other meme tokens, showcasing DOGE’s influence within the market.
Currently facing resistance at $0.245, BINANCE:DOGEUSDT has reached a 2-month high . The Parabolic SAR below the candlesticks signals that DOGE is likely to maintain its upward trend in the coming days. If this support holds, the meme coin could continue pushing towards higher price levels, attracting more buyers and momentum.
However, meme coins are volatile. If BINANCE:DOGEUSDT holders decide to cash out their profits, the price could drop back down to $0.220 . Losing this support would invalidate the bullish outlook, signaling a possible downturn for the altcoin in the short term.

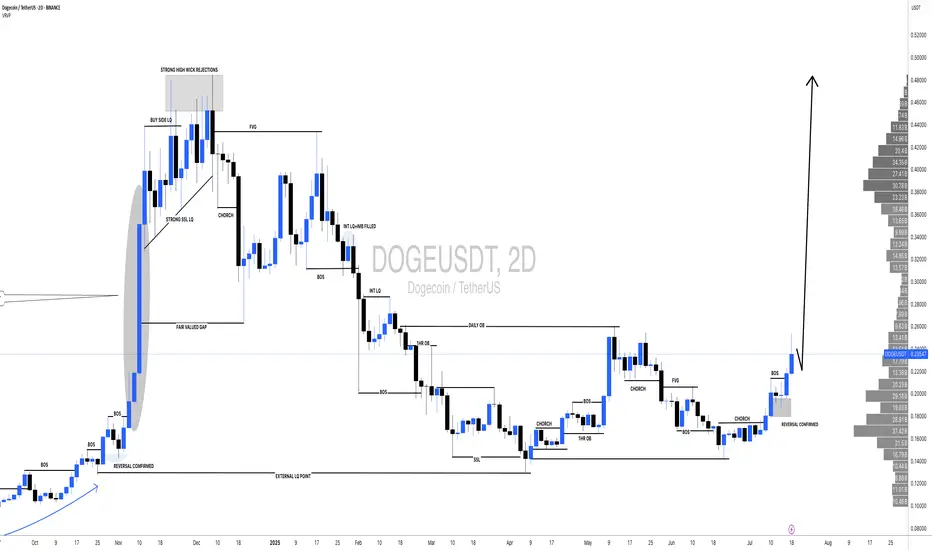
DOGE Update: Reversal Playing Out — $1+ in Sight?DOGE is playing out almost exactly as forecast back on June 14th, where I was monitoring for price to sweep the SSL and tap into range low demand within this larger HTF range.
Price did exactly that — pushing into discount, tagging the marked demand zone, and bottoming out right where I expected the reversal. I DCA’d hard at $0.165 after the initial low printed — just as planned.
Now sitting around +50% on those buys, and my plan remains to ride this out toward the ATH at $0.74 and potentially $1+.
The HTF closes forming here — across 3D, 4D, 5D, 6D candles — are showing clear strength. For me, the low is likely in, and I’m expecting new higher highs and ATHs from here. Now it’s just about letting the market do its thing, trailing stops, and taking profits into strength as alerts and targets get hit.
Zooming way out — I’m also watching DOGE’s 10-year uptrend channel. Price has once again tagged the lower bound of that channel, and historically, this has led to moves back to the channel highs.
🧠 Layer on a fib projection from the previous ATH to the bear market low, and we get:
1.272 Fib → ~$1.54
1.618 Fib → ~$3.92
Both of which align perfectly with the upper bounds of that long-term trend channel — giving us a key HTF reversal zone to monitor in the future.
In summary:
- Reversal from demand ✅
- DCA filled ✅
- HLs printing ✅
- Targets = ATH and beyond
- Watching HTF fibs + channel highs for eventual cycle top formation
DOGE is doing what DOGE does — don’t overcomplicate it.
1D:
3D:
1W:
1M:

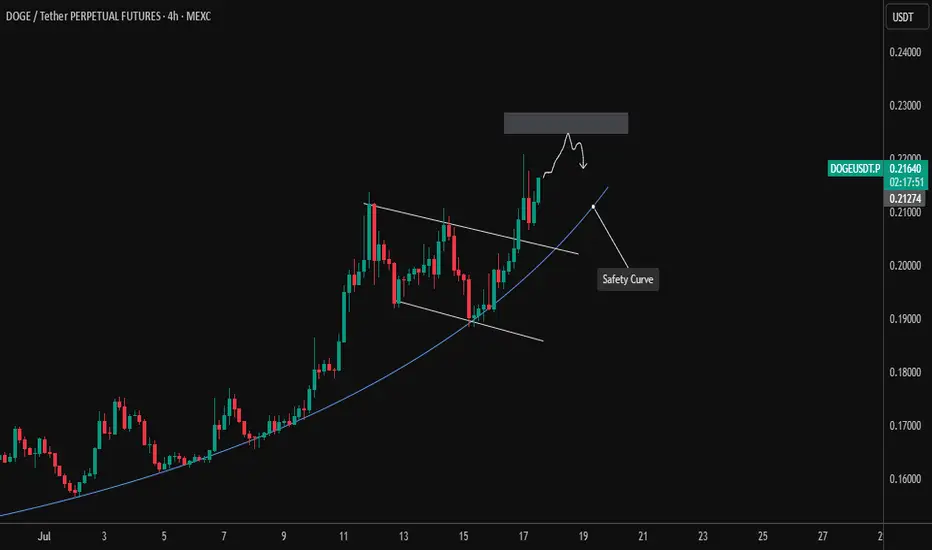
DOGE/USDT – 4H Chart Analysis (July 17, 2025)Dogecoin has been riding a strong uptrend, maintaining its momentum along a parabolic safety curve, which has been respected multiple times.
📈 Recently, DOGE broke out of a descending channel and is now approaching a resistance zone around $0.225–$0.230. This area previously acted as a supply zone, and price action suggests a short-term rejection could be forming.
🟦 Key Observations:
Parabolic trendline acting as a "safety curve" support.
Price approaching a supply zone with signs of slowing momentum.
Potential short-term double top or lower high forming.
📌 Scenarios to Watch:
Pullback from resistance → Retest of the safety curve (~$0.21) = potential long setup.
Break and hold above $0.230 = bullish continuation, targeting new local highs.
⚠️ Risk Management: Enter on confirmation; don't chase green candles near supply. A breakdown of the safety curve may lead to deeper correction.
#Dogecoin #DOGEUSDT #Crypto #TechnicalAnalysis #Altcoins #MEXC
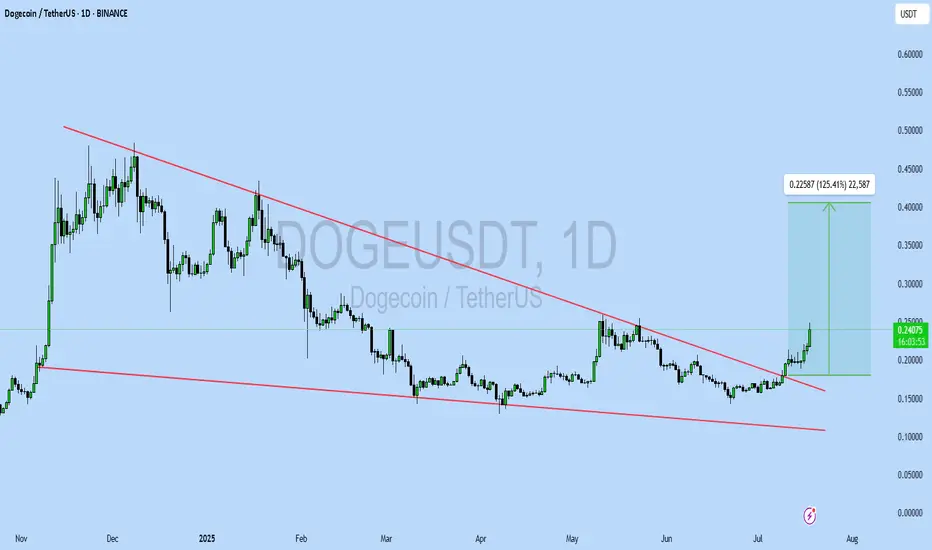
DOGEUSDT UPDATE
Pattern: Falling Wedge Breakout
Current Price: \$0.24086
Target Price: \$0.4667
Target % Gain: 125.41%
Technical Analysis: DOGE has broken out of a falling wedge pattern on the 1D chart with strong bullish momentum and a +10.35% daily candle. The breakout is confirmed with increasing volume, suggesting continuation toward the target zone.
Time Frame: 1D
Risk Management Tip: Always use proper risk management.
$DOGE to the moon?CRYPTOCAP:DOGE | 1D
Currently retesting the 0.25 resistance. If we break through, a push to 0.27 is likely.
Expect a minor pullback to the 0.23–0.22 region before a potential full move toward 0.30 region
