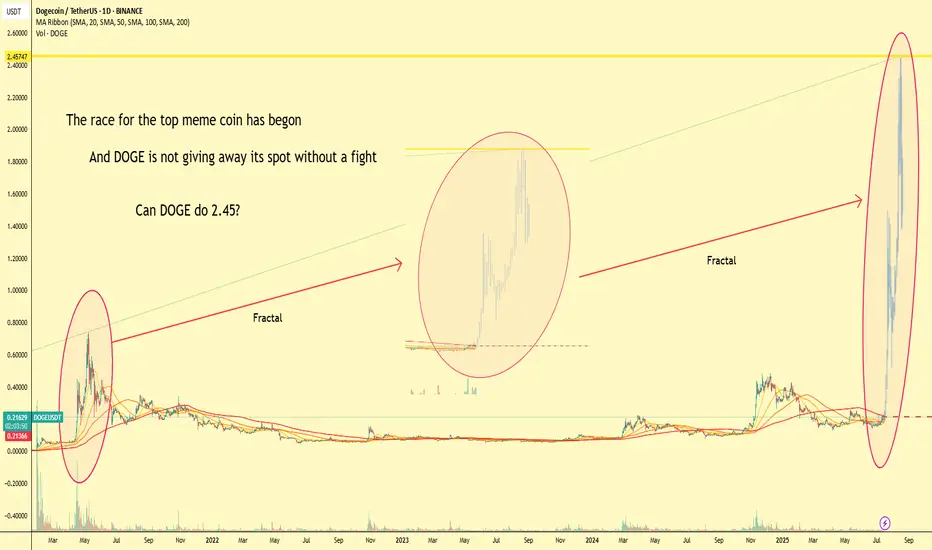
The Meme Coin Race Has Begun, DOGE fighting for top spot!📈 The Meme Coin Race Has Begun
🔥 The battle for the throne is heating up...
🐶 DOGE, the original meme coin, isn’t giving up its crown without a fight.
Fractals from the past seem to echo in today's chart – history doesn’t repeat, but it rhymes.
⚔️ With new challengers lining up in the meme arena, one question remains:
Can DOGE reach $2.45 and reclaim the top spot?
🚀 Volume is rising. Patterns are aligning.
The king is awake.
👑 The OG vs the New School. Who will win the meme war?
Comment your prediction 👇
#DOGE #MemeSeason #CryptoFractals #Altseason #DOGEUSDT #CryptoTrading #TradingView #FractalAnalysis #CryptoWar #MemeCoins
DOGEUSDT trade ideas
DOGESH DOGE again!DOGESH looks an Indian name I like it hahahhahaa, but yes have power to fly up without farts help
DOGE Short SetupTight SL, 1:3 Risk-Reward.
We might go higher, but current key levels and price actions tells me to go short setup.

yesascending nicely through the top of the range. Critical resistance at 24 cents. Next is 32 cents.
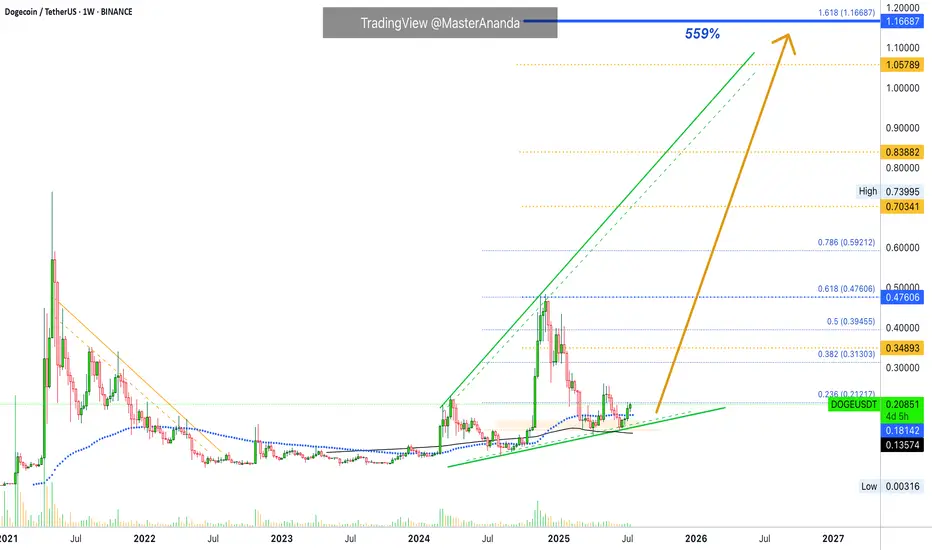
Dogecoin Mid-Term & Long-Term Targets · Advanced Trading TipsNotice here the same price dynamics we just saw with Cardano, the exact same:
» Dogecoin is now on the fourth consecutive green week.
» Dogecoin closed last week above EMA89 on a full green candle.
» Dogecoin is in a rising trend since August 2023 but the market bottom happened in June 2022 rather than 2023. A small variation compared to Cardano but these projects are in the same group, big capitalization, and they tend to move together. What one does, the rest follows.
The situation right now is really really good for this pair. Notice that Dogecoin is not only trading above EMA89 but also above MA200. This confirms that we will experience growth long-term.
The yellow targets are the intermediary targets while the blue ones are long-term. The minimum price Dogecoin will reach in this rise is $1.16. This is based on the long-term, the last all-time high, the previous bull market and the broader cycle. Now, it can definitely move much higher but we start with a strong target that has a high probability of success. Depending on how this level is handled, we can aim higher.
For example: I will always be here sharing charts. If at one point the market goes nuts and you need an update, just leave a comment or send me a message and I will look at the chart and share information based on the present day. Market conditions can always change.
Right now we have to make some wild speculations, still educated guesses but as the bull market is more advanced, we will know with a high level of certainty how far up each pair will go. That is because certain pairs tend to move ahead of the pack, look at FUNUSDT as a good example. It has been moving straight up.
An interesting bit of data. 5-May DOGEUSDT produced its last peak. Some altcoins are already trading above their May's high. This simply means that related pairs, those that move in a similar way, will do the same. This signal works as bullish confirmation, it means Dogecoin will continue to grow, with a high level of certainty, we know this based on price action, the chart and marketwide action.
You can use leverage on this setup even now as long as your liquidation is below MA200 to be safe. Very low leverage because it is already moving. If you do higher you are gambling. If you want to gamble that is also ok but we prefer trading: Low risk vs a high potential for reward and high probability chart setups.
The next leg up is already confirmed. We are moving up within days. The bullish action is already happening, it is already live; four consecutive weeks going up/green. Knowing this, we know the 5th, the 6th weeks and so on are composed of major bullish momentum.
Adapt now. Do whatever it takes, whatever you have to do to maximize profits. Opportunities are endless of course.
While it still early for this and many other pairs, there are some that have even less risk, trading at true bottom and the market will continue to have variations for all types of traders.
You can do great in this cycle.
Never take action on an impulse.
If an idea cannot wait a few hours to be implemented or a few days, then just let it go.
A true, valid and valuable idea will be valid even after the initial rush. They tend to come when everything is calm. If you get impulses when excitement is building up, hype and all that, sit, watch and relax, a shakeout can develop. If you feel like going in now hard, then go ahead, right now nobody is excited and nobody is hyped-up, this means that the market is rising and the bullish bias is confirmed. Only when we are approaching a crash everybody will start talking about forever more. When the market is good and low, nobody cares... If you do, you are already an expert.
Namaste.
#DOGEUSDT: Swing Trade Targeting $0.50| Swing Trade| Setupsfx_|Hey there! Everyone
DOGEUSDT is at a turning point right now, and it looks like it might just reverse course and head towards its target price of $0.50. This is a swing trade, which means it could take a few weeks, or even months, to complete.
We’d really appreciate your support.
Thanks
Team Setupsfx_
DOGEUSDT: Time For Bulls To Rule! The Dogecoin is currently trading at a key buying level, making it a potential opportunity to buy. However, we need confirmation before making a purchase or entering a trade. This trade could take time to develop as we are currently in the accumulating phase. To be certain of the price direction, we need to enter the distribution phase. While a single swing trade could be a target, you can set your own risk management parameters.
Good luck and trade safely!
Team Setupsfx_
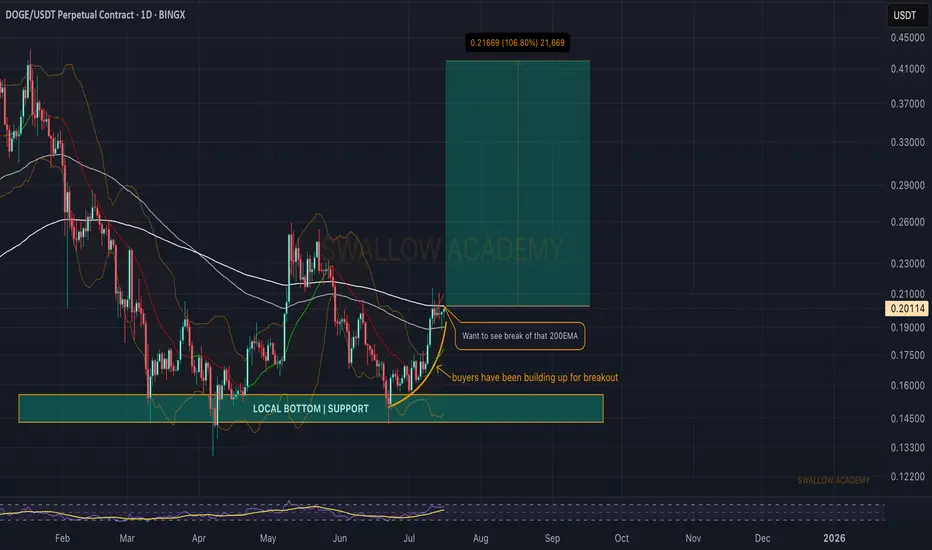
Dogecoin (DOGE): About To Breakout and Start Strong Bullish MoveDogecoin has been on our radars for quite some time, and we had a nice bounce since last time (from the local bottom).
Now we are approaching the breakout point (200 EMA) area, where upon seeing the break we should start a strong upward movement.
Swallow Academy
Portfolio Destruction In Bull Markets = Greed Without Strategy When the market is bullish, everyone thinks whatever they buy will make a profit.
But does a rising price really mean you’re winning? Or are you just chasing an illusion?
What kills most traders is greedy trading without a clear plan even when the market is green!
Hello✌
Spend 3 minutes ⏰ reading this educational material.
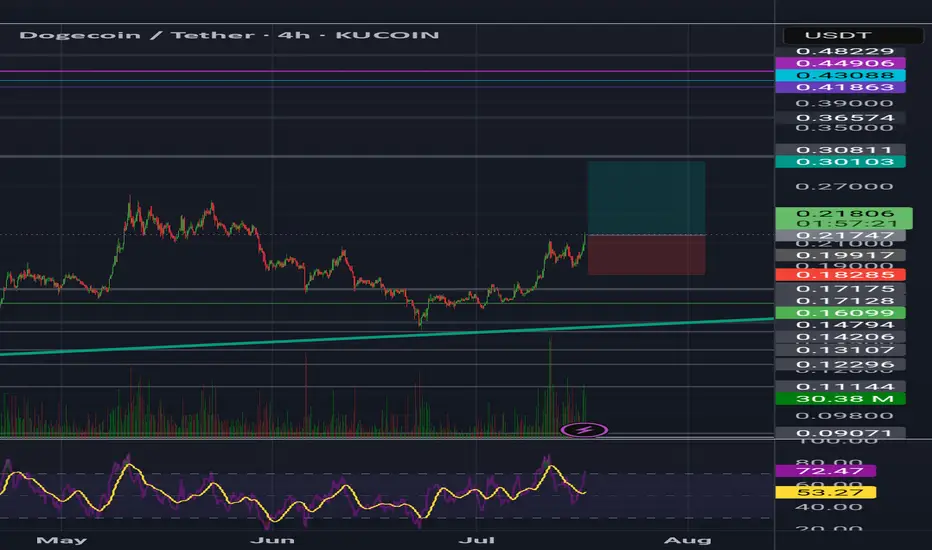
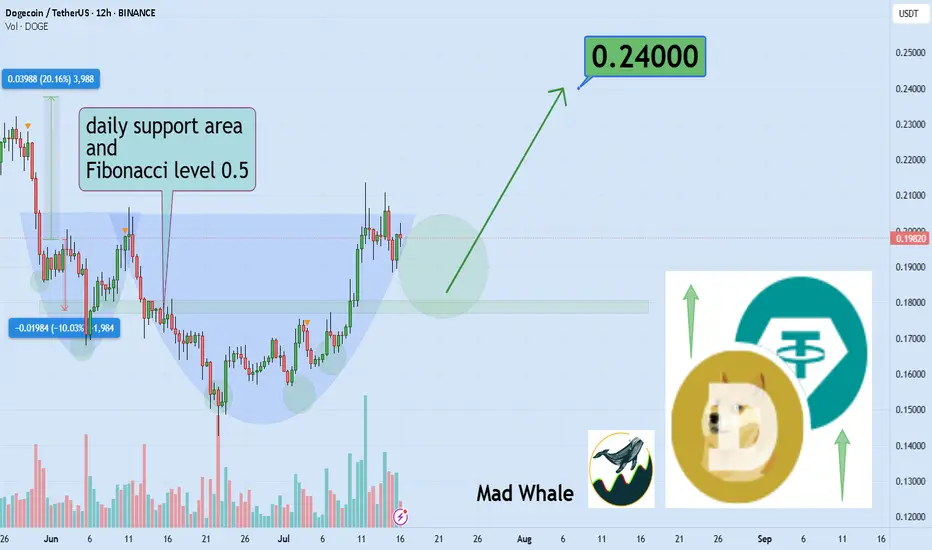
🎯 Analytical Insight on Dogecoin :
🚀 After breaking out of its daily downtrend channel, BINANCE:DOGEUSDT is now testing a strong support zone near the 0.5 Fibonacci level. This setup suggests the potential for a further 20% upside, with the main target around 0.24.
Now, let's dive into the educational section,
🧨 When the market is green fear should grow
In bearish markets people are cautious But in bull runs everyone fears missing out
This phase is exactly what pumpers love Why Because they know people are ready to chase every green candle
Are you actually profiting or just running after profits
If you do not have a strategy if your exit points are not clear if you do not know when to take profits
You are giving the game away to others
🕳️ Illusion of control traders’ silent enemy
When a few trades go well you think you have got the market figured out But actually the market has you
This sense of control mixed with greed leads to heavy risking skipping stop losses or riding fake pumps to the end
What is the solution Only strategy No influencer hype no social media noise no candle colors.
📊 Smart use of TradingView’s tools:
Many traders decide with emotions not data
But with a few simple TradingView tools you can base your decisions on data not feelings
One of the most practical indicators to spot overbought conditions or excessive greed is the RSI
When RSI goes above seventy it means the market is in a hype phase That is when many blindly jump in
A simple method Add RSI to your favorite crypto chart and check if a pump happened in the overbought zone
Another tool Volume Profile shows you the price levels with the highest trading volume
When price hits an area with very low volume behind it be cautious This could be a fake top
A golden tip Use TradingView Alerts
Instead of constantly staring at charts set alerts for when RSI passes seventy five or price reaches a suspicious zone Then get notified instantly
This way you let data guide you not momentary excitement
And this is exactly where you separate yourself from an unplanned greedy trader
💡 Summary and advice
Trading without strategy whether in bull or bear markets puts your capital at risk sooner or later
You can’t remove greed but you can control it
TradingView tools exist for exactly this reason to help you think before you act
Profit comes from planning not from chasing the next pump
✨ Need a little love!
We pour love into every post your support keeps us inspired! 💛 Don’t be shy, we’d love to hear from you on comments. Big thanks , Mad Whale 🐋
📜Please make sure to do your own research before investing, and review the disclaimer provided at the end of each post.
The Right Way to Manage Stop Loss: Dynamic Logic for Smart ExitsContext
In fast-moving markets, static stop losses often sabotage good trades by exiting too soon or too late. This approach uses dynamic, logic-driven stop loss adjustments that adapt to market context instead of sticking to a single fixed distance.
⸻
Key Principles of This Stop Loss Logic
Contextual Initial Placement
The stop is never just a fixed percentage below entry. It adapts based on recent swing lows/highs, ATR volatility, and trend confirmation signals.
Dynamic Extension in Favorable Conditions
If price retraces but shows bullish reversal evidence such as deep oversold signals, positive divergence, or compression breakouts, the stop loss is extended instead of closing immediately. This prevents cutting winners during normal pullbacks.
Tightening When Momentum Fades
If momentum weakens (for example, ADX drops, failed bounce, or resistance rejection), the stop is tightened dynamically. This reduces drawdown if the trend fails.
Clear Exit Triggers
The system can exit on consolidation breakdowns below support, confirmed bearish reversal patterns, or time-based exits if no continuation happens.
⸻
Examples and Visuals
Below, I’ve included chart examples with screenshots from my Multi Crossover Strategy . These images illustrate how dynamic stop loss management behaves in real conditions—showing entries, extensions during retracements, and exits triggered by different scenarios. You can see how the logic responds to changing volatility and trend strength in real time.
The "+" signs mark bars where the position would have closed using the default settings of 2.5 ATR Multiplier stop loss. A bullish reversal signal extended the stop, allowing the trade to close profitably instead of at a loss.
This example shows an early exit triggered by a consolidation breakdown. The system closed the position before the maximum stop loss was reached, limiting the loss as bearish momentum increased.
Example for lower high close to reduce loss. Here, the position was closed after a failed bounce and the formation of a lower high, signaling a likely continuation of the downtrend and helping to reduce the loss before a deeper move.
⸻
Advantages Over Simple Stop Losses
Adaptation
Stops react to volatility and price structure, not arbitrary distances.
Risk Mitigation
Dynamic tightening locks in gains faster when momentum fades.
Confidence to Stay In
Dynamic extension reduces the chance of premature exits during healthy retracements.
⸻
How to Use This Approach
When designing your strategy, start by defining a volatility-adjusted stop using an ATR multiplier as the base distance from entry. You can then set a maximum allowable loss in percentage terms to cap risk exposure to a fixed threshold.
After establishing your initial stop, consider adding layered adjustments that respond to different levels of reversal risk. For example:
ATR Multiplier: the factor used to calculate the initial stop distance based on market volatility.
Maximum Loss (%): the maximum risk per trade, defined as a percentage below the entry price.
Tight Stop Loss (%): a closer stop level that activates when early signs of a potential reversal appear, such as weakening momentum or minor bearish movement.
Bearish Stop Loss (%): a further tightening of the stop distance when stronger bearish reversal signals occur, including failed bounce attempts, lower highs, or clear resistance rejections. This level reduces the tolerance for further losses but still allows the trade to remain open if price stabilizes.
Extended Stop Loss Percentage Add-On: an additional percentage beyond the maximum loss cap, temporarily applied if strong bullish recovery signals appear.
In addition to these percentage-based stop adjustments, you can define instant exit rules that immediately close the position as soon as specific structural conditions are met. Unlike percentage-based stops, instant exits do not wait for further price movement or confirmation. They are typically used to react to decisive events such as a confirmed breakdown below support, a lower high after a failed bounce, or a sharp rejection at a resistance level. This combination of tightened stops and instant exit triggers allows for a flexible but disciplined approach to managing trades.
Pro Tip:
Most traders lose because their stops don’t evolve with the trade. Build a logic tree:
If trend = strong ➡ extend stop
If reversal risk ➡ tighten stop
If clear reversal signs ➡ exit
⸻
Disclaimer: This content is for educational purposes only and does not constitute financial advice. Please do your own research before making trading decisions.

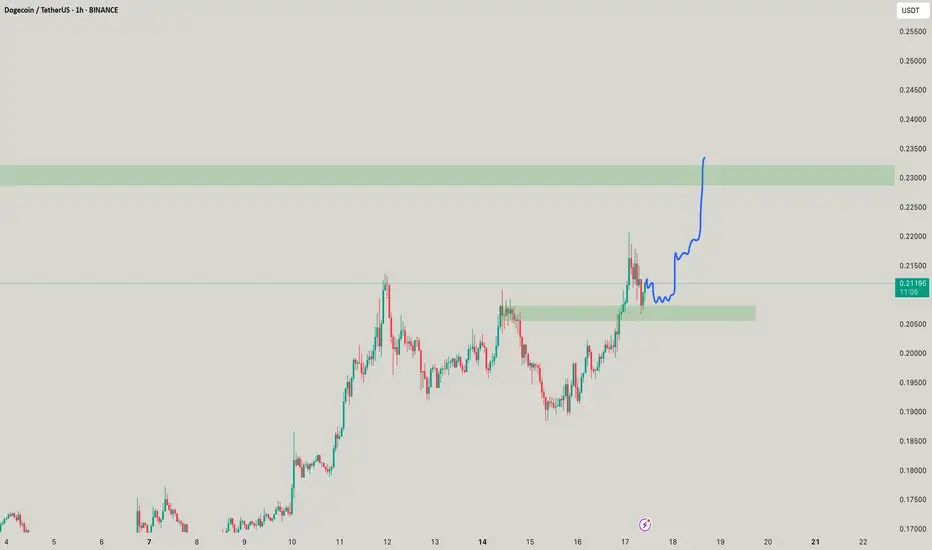
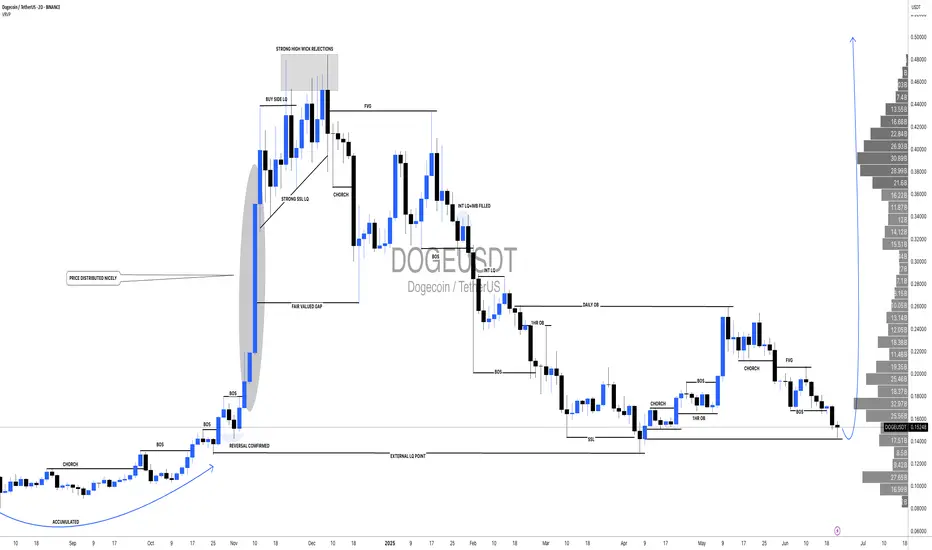
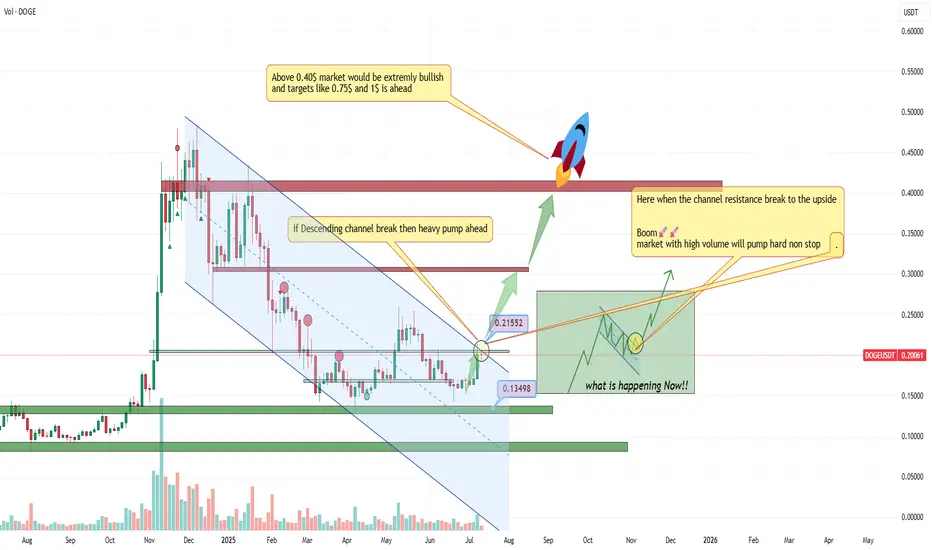
Wooow DOGEUSDT breakout happening Major resistance which is 0.22$ and is also channel resistance is breaking and BINANCE:DOGEUSDT would be nonstop bullish after that at least for a while to the targets like 0.40$ and 0.60$.
As we can see on the chart here is last valid and strong resistance zone after that i am expecting nonstop rise for This token which is still sleep and soon will follow the market and also lead with daily +15% candles.
DISCLAIMER: ((trade based on your own decision))
<<press like👍 if you enjoy💚
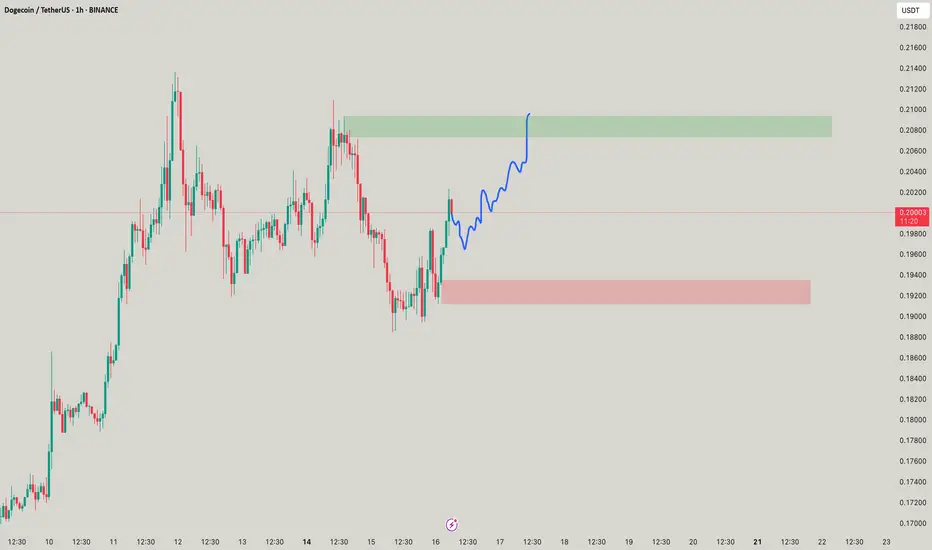
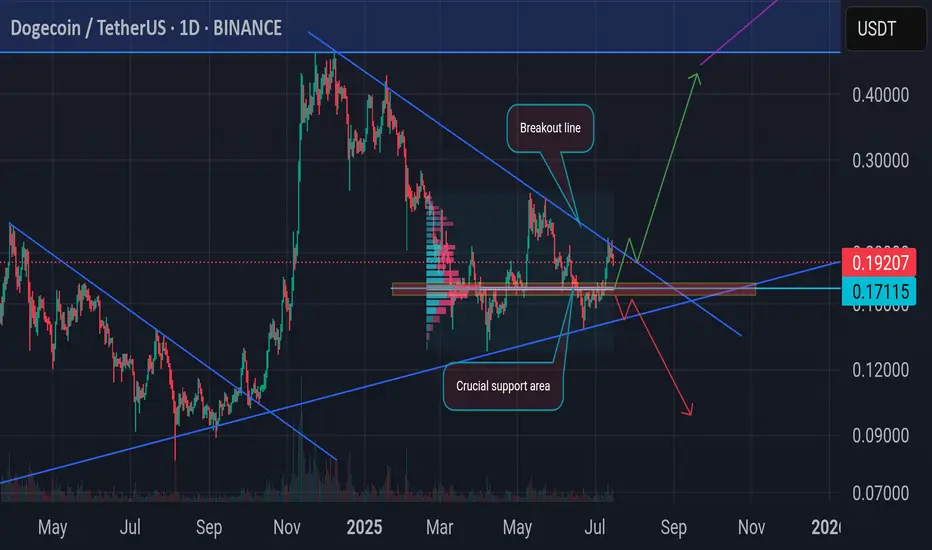
Fill your porto with DOGE :)Fill your portfolio with DOGE. DOGE's price structure 1D remains bullish. It would be impressive if it breaks through the breakout line.
⚠️ The $0.17115 support level is a crucial level to maintain, otherwise the price may decline further.
Doge can be a great long position Altcoins are about to start going up. And the Dogecoin has a strong resistance ahead. It can be a 1:9 or higher RRR.
*This is not a financial advise and is just an experimental idea.

DOGE setting up a bullish Bull Flag?DOGE is moving within a descending channel after making a good run upside.
Current tend shows possibly setting up a bullish bull flag pattern. If breakout verified, DOGE will skyrocket to $0.25 range in coming days.

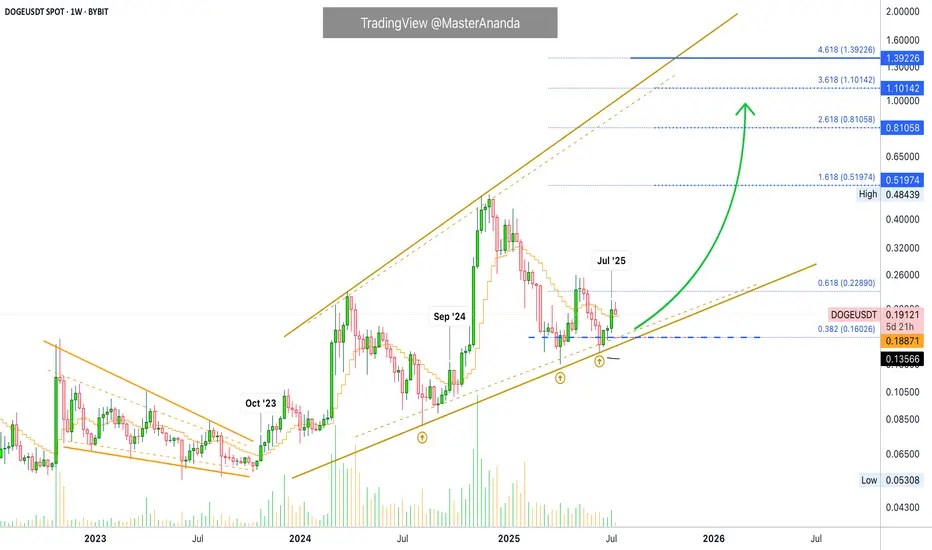
Dogecoin's Bullish Wave Over? Higher High Beyond $1.11111Nope, it is only getting started... Do you see that tiny speck of a black line on the chart? Way below the current candles around 0.135. That's MA200 weekly. Dogecoin is on the bullish zone 100% already confirmed. The bullish wave is only getting started.
DOGEUSDT is trading weekly above EMA13. Watch what happened in September 2024 when Dogecoin broke above this level. Or further back, October 2023. Both instances, there was a bullish impulse; both instances, a higher high.
Dogecoin moved and closed above EMA13 last week, July 2025. Guess what will happen next? A new bullish impulse and a strong higher high.
Patience is key, the market is set to continue growing long-term. No, the uptrend is not over, it is only getting started.
Thanks a lot for your continued support.
Namaste.

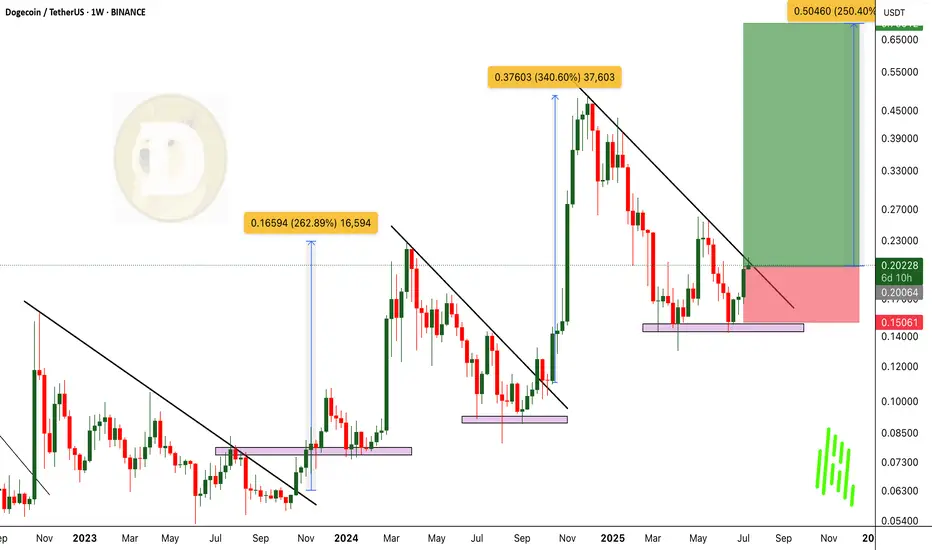
DOGEUSDT Breaking Out. 250% Rally Incoming? History Says Yes!BINANCE:DOGEUSDT is once again showing its classic breakout behavior, This time breaking above a key trendline with strong momentum. Historically, every time CRYPTOCAP:DOGE has broken out of similar structures, it has delivered powerful rallies averaging around 250% gains. And with the current bullish sentiment across the market, this setup looks ready to repeat history.
CRYPTOCAP:DOGE still appears undervalued, especially considering the broader market is already heating up. Once CRYPTOCAP:DOGE starts its move, it tends to run fast and hard – often leaving latecomers behind. This could be the start of the next explosive leg up.
For investors, this is a prime “BUY and HOLD” zone. For traders, this is the time to enter with proper risk management in place. Always use a stop loss and trail your profits accordingly.
BINANCE:DOGEUSDT Currently trading at $0.204
Buy level : Above $0.2
Stop loss : Below $0.15
Target 1: $0.27
Target 2: $0.35
Target 3: $0.48
Target 4: $0.7
Max leverage 2x
Always keep stop loss
Follow Our Tradingview Account for More Technical Analysis Updates, | Like, Share and Comment Your thoughts
DOGE LONG TRADEDoge long position, We have been extremely bullish lately so hopefully we continue and break out of this symmetrical triangle.
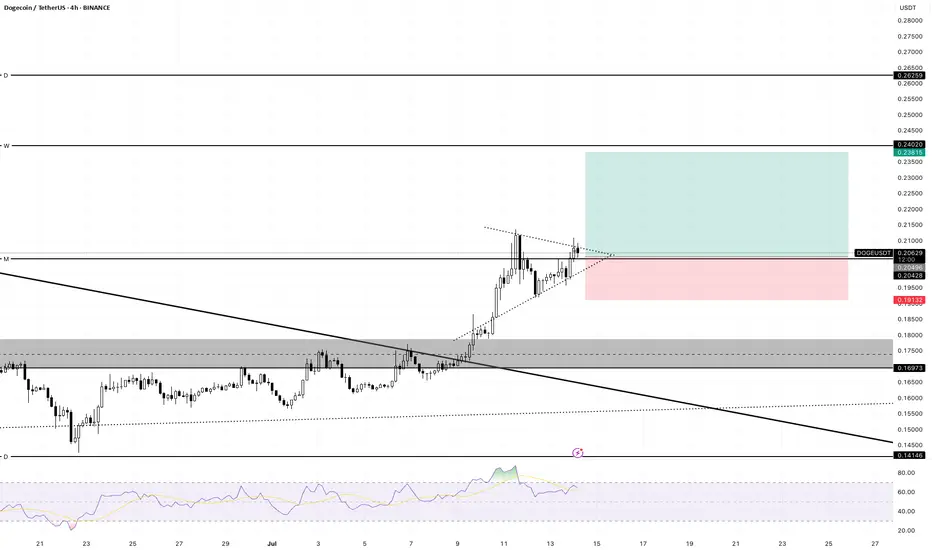
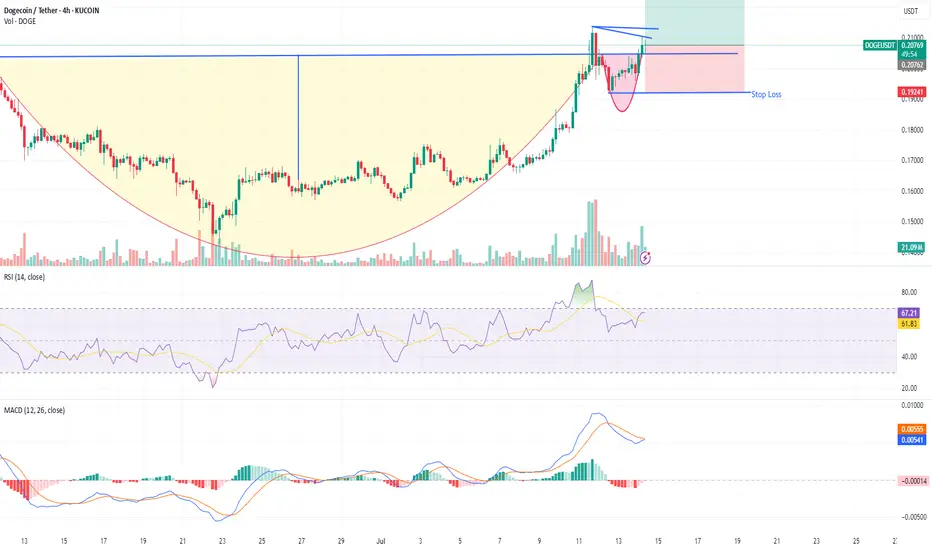
DOGE/USDT | Cup and Handle Breakout Setup – Swing Trade IdeaThis is my first post here, and I'm truly excited to begin this journey of learning, sharing, and growing as a trader with all of you.
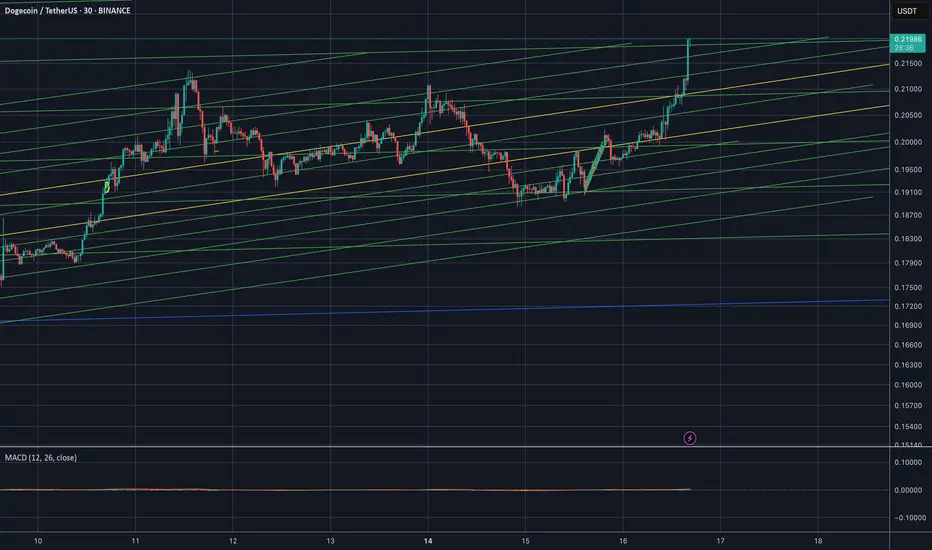
📈 I'm currently tracking DOGE/USDT and noticed what looks like a classic Cup & Handle formation developing on the 4H chart. I've marked out the structure, potential breakout zone, and my own thoughts on the setup (entry, SL, and TP).
I'm sharing this not as financial advice but as part of my learning and analysis process, and I wholeheartedly welcome your feedback, thoughts, or alternate views — this is how we all get better together. 🙏
🧠 Trade Idea – Cup & Handle Breakout on 4H Chart
I'm observing a clean Cup and Handle pattern forming on the DOGE/USDT 4H timeframe.
Cup formation is smooth with rounded structure
Handle completed with a slight consolidation/pullback
Price is now testing the breakout zone between $0.207–$0.214
A confirmed breakout and candle close above these levels could open the door for a strong move toward TP near $0.246
📌 Trade Plan
Entry Zone: Above $0.2145 (confirmation breakout)
Stop Loss: Below $0.1924
Take Profit (TP): Around $0.2468
Risk/Reward: Roughly 1:2.5 depending on exact entry
⚠️ Disclaimer:
This is not financial advice. Please do your own research (DYOR) before making any decisions. Markets are unpredictable, and this post reflects just an idea and my personal analysis — it could work out or completely fail. Manage your risk wisely!
Let’s keep the community friendly, helpful, and focused on growing our collective trading knowledge. 💬📚
Wishing you all green candles and strong confirmations!
– Cheers, and happy trading! 🚀🔥
DOGE! _ RISK it ! Get itSince ages! Ive never seen such beautiful movement of charts and so is doge, lots of liquidity to get captured! Hopefully it gets done as I marked!
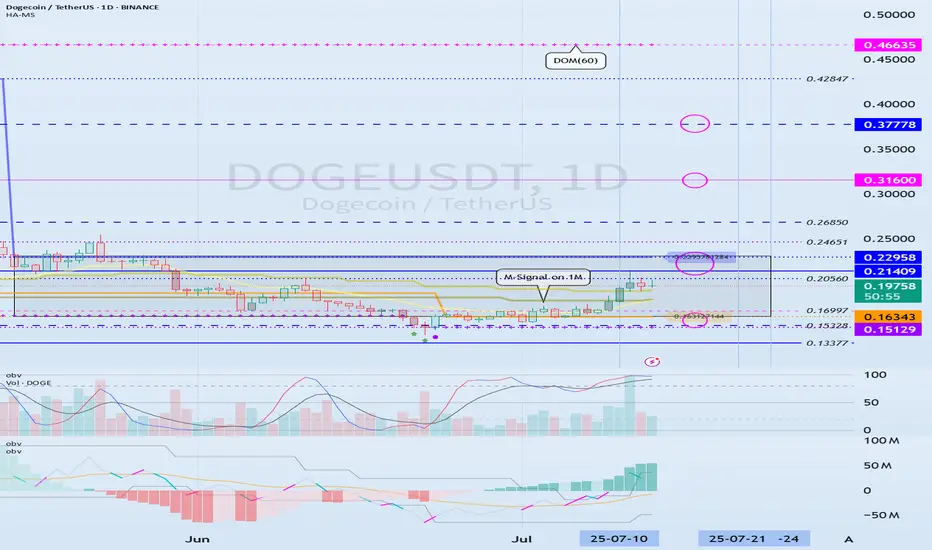
Check if there is an upward breakout of 0.21409-0.22958
Hello, traders.
If you "Follow", you can always get the latest information quickly.
Have a nice day today.
-------------------------------------
(DOGEUSDT 1D chart)
HA-High and HA-Low indicators are converging.
Accordingly, if it breaks through the 0.21409-0.22958 section, it is expected to surge.
However, since the DOM(60) indicator is formed at the 0.46635 point, we need to look at how the DOM(60) indicator is newly created.
It seems possible that the DOM(60) indicator will be newly created while shaking up and down in the 0.21409-0.31600 section, which is the HA-High indicator ~ DOM(60) indicator section of the 1M chart.
If the DOM(60) indicator is newly created, we need to check whether it is supported in the HA-High ~ DOM(60) section.
If it rises above the HA-High ~ DOM(60) section, it is likely to show a stepwise upward trend.
-
To summarize the above, it is as follows. - Buy range: 0.16343-0.22958
- Resistance range: 0.31600-0.37778
If the price breaks through the resistance range upward and maintains, there is a high possibility that the upward trend will continue in the medium to long term.
-
Thank you for reading to the end.
I hope you have a successful transaction.
--------------------------------------------------
- Here is an explanation of the big picture.
(3-year bull market, 1-year bear market pattern)
I will explain the details again when the bear market starts.
------------------------------------------------------