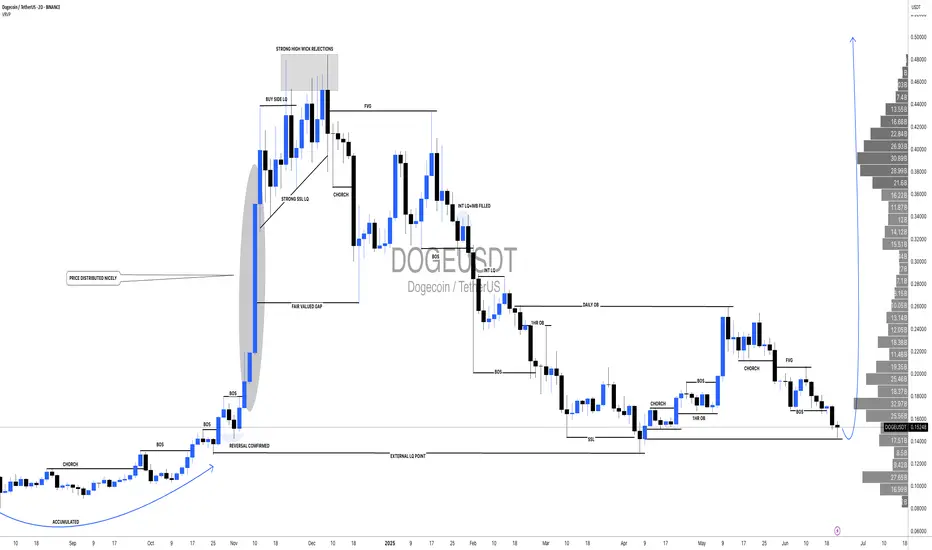
DOGE wait for entry
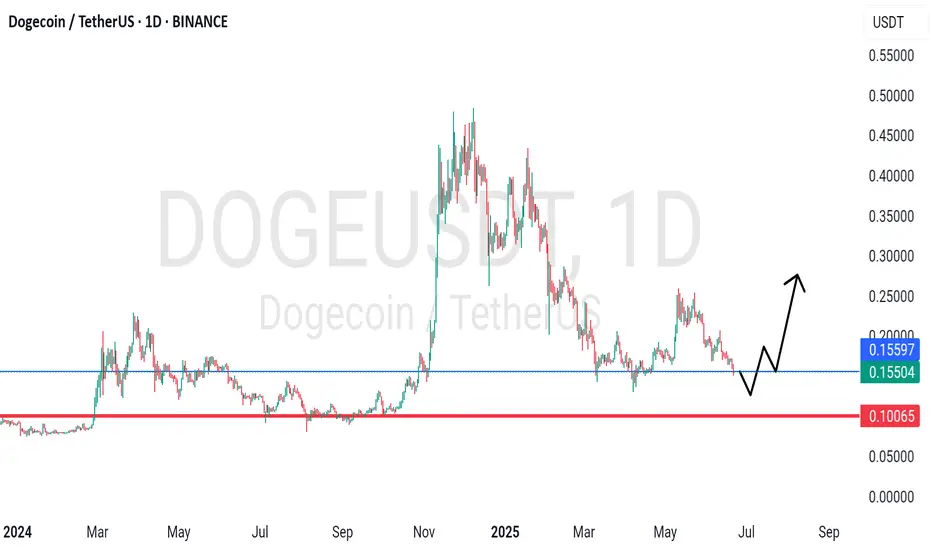
DOGE has been consolidating within the \$0.13–\$0.25 range for the past four months.
Wait for price to approach the area of interest, where the range support aligns with the weekly trendline—forming a strong confluence zone for a potential entry.
Disclaimer:
This analysis is based on my personnal views and is not a financial advice. Risk is under your control.
DOGEUSDT_89DA41 trade ideas
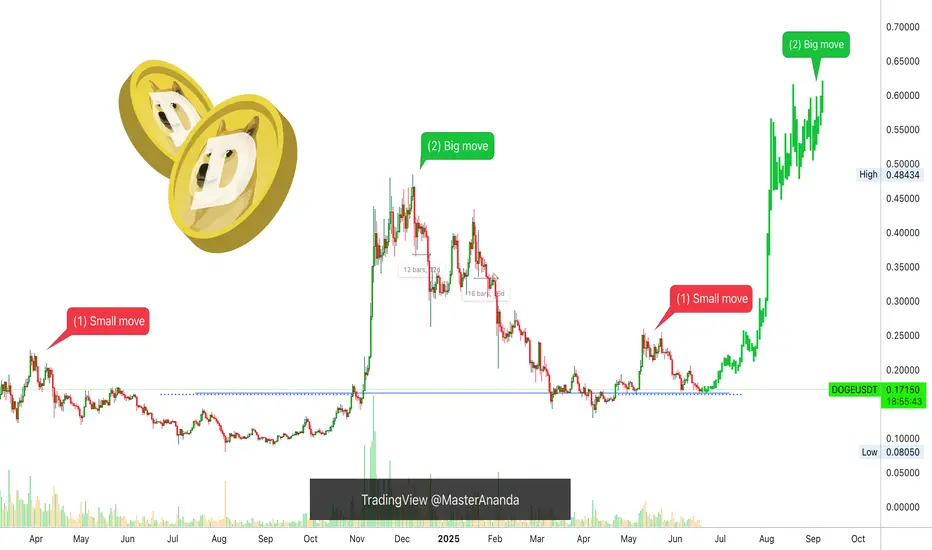
Dogecoin: Small Move, Big Move, What Will You Do?All gains have been removed, most of them. Dogecoin hit yesterday the same level from 6-May. This level was the base that propelled prices to 0.26000. From this high point 11-May, we witnessed a correction lasting more than a month. Total drop amounts to 36.9% (-37%).
Size and duration
» From 6 to 11-May we have 5 days.
» From 7-April to 11-May we have 34 days (bullish).
» From 11-May to 17-June we have 37 days (bearish).
I am making the case that the correction is over. Follow me a little longer and you will be convinced. If you are not convinced by my analysis, you will be convinced when prices start to increase.
Drop vs rise
» The 7-April low was 0.12986.
» The 6-May and 17-June lows was around 0.16400.
While the drop is bigger than the rise, in time duration, the action did not produce new lows (a lower low). Instead, prices remain strong as a higher low.
The low 17-June (yesterday) is 26% higher compared to the low that was hit 7-April.
Now I will make my case stronger.
Past action
Dogecoin peaked 8-December 2024. After this peak, bearish action is really strong and every few weeks we see a new low. Total drop from top to bottom amounts to more than 73%. But here is the thing, the final low in 7-April is still higher compared to the low in early August 2024.
» What you are seeing now is a "small move," (1).
» What comes next is a "big move," (2).
Now you know what is coming to Dogecoin—the altcoins market—what will you do?
Namaste.
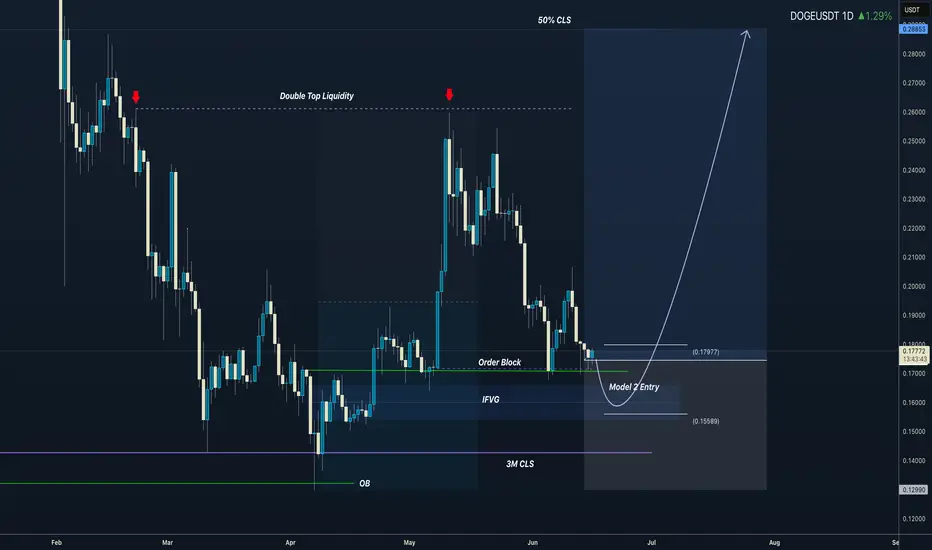
3M CLS I KL - OB I Model 2 I Targe 50% CLSHey, Market Warriors, here is another outlook on this instrument
If you’ve been following me, you already know every setup you see is built around a CLS Footprint, a Key Level, Liquidity and a specific execution model.
If you haven't followed me yet, start now.
My trading system is completely mechanical — designed to remove emotions, opinions, and impulsive decisions. No messy diagonal lines. No random drawings. Just clarity, structure, and execution.
🧩 What is CLS?
CLS is real smart money — the combined power of major investment banks and central banks moving over 6.5 trillion dollars a day. Understanding their operations is key to markets.
✅ Understanding the behavior of CLS allows you to position yourself with the giants during the market manipulations — leading to buying lows and selling highs - cleaner entries, clearer exits, and consistent profits.
📍 Model 1
is right after the manipulation of the CLS candle when CIOD occurs, and we are targeting 50% of the CLS range. H4 CLS ranges supported by HTF go straight to the opposing range.
"Adapt what is useful, reject what is useless, and add what is specifically your own."
— David Perk aka Dave FX Hunter ⚔️
👍 Hit like if you find this analysis helpful, and don't hesitate to comment with your opinions, charts or any questions.
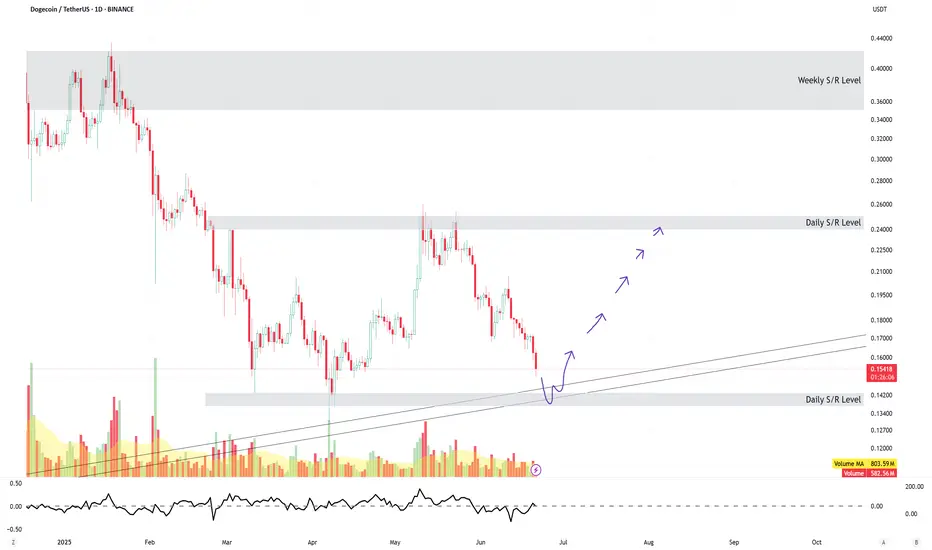
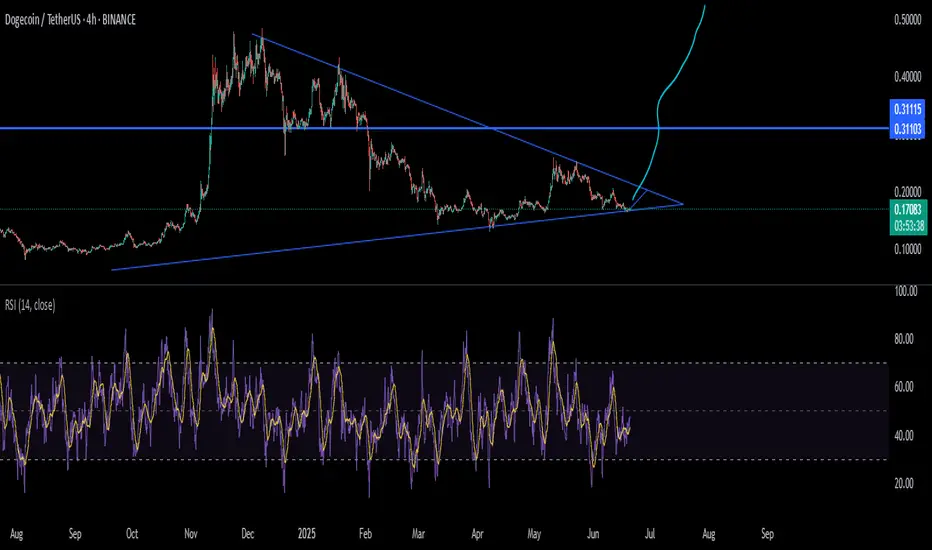
#DOGEUSDT: Swing Trade Targeting $0.50| Swing Trade| Setupsfx_|Hey there! Everyone
DOGEUSDT is at a turning point right now, and it looks like it might just reverse course and head towards its target price of $0.50. This is a swing trade, which means it could take a few weeks, or even months, to complete.
We’d really appreciate your support.
Thanks
Team Setupsfx_
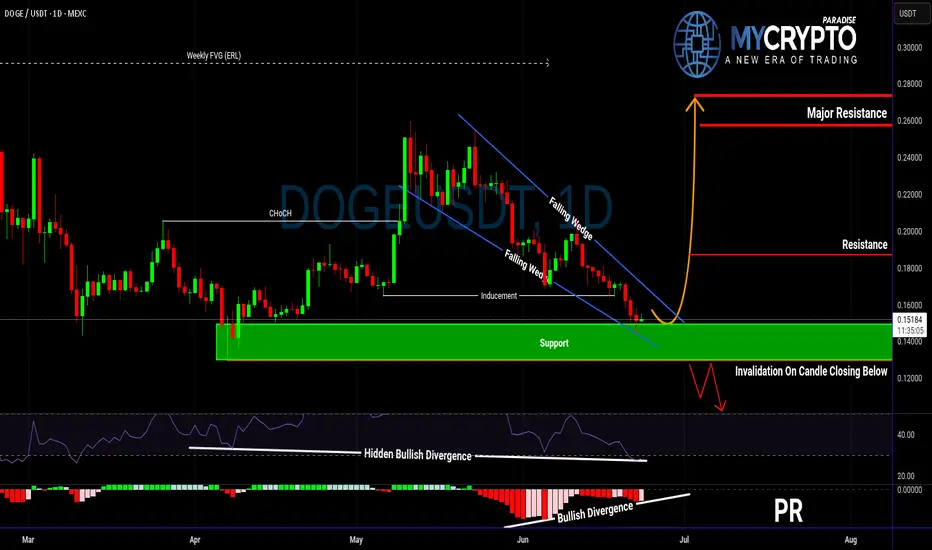
Is DOGE About to Explode or Collapse?Yello Paradisers! Are you ready for what could be DOGE’s most explosive move in weeks? DOGEUSDT is currently developing a very interesting bullish setup that deserves attention.
💎The pair has formed a falling wedge — a pattern that often precedes a breakout to the upside. This comes right after a confirmed bullish Change of Character (CHoCH), indicating that buyers are quietly stepping back in.
💎Even more important, we’ve seen a classic inducement grab, meaning early liquidity has been taken out, clearing the way for a potential real move. On top of that, there’s hidden bullish divergence on the RSI and clear bullish divergence on the MACD. This combination of signals significantly increases the probability of a bullish reversal from the current support zone.
💎If DOGE prints a convincing bullish candlestick pattern at these levels, it could offer a high-probability long opportunity with a strong risk-to-reward ratio. But be careful — if the price breaksdown and closes candle below this key support, the bullish scenario becomes invalid, and it’s better to wait for a more favorable structure to develop.
Strive for consistency, not quick profits. Treat the market as a businessman, not as a gambler. This is the only way you will make it far in your crypto trading journey. Be a PRO.
MyCryptoParadise
iFeel the success🌴
A time for rebound? Doge just hit the bottom of the descending channel and a rising blue support line.
It’s time for a rebound to the upper channel area.
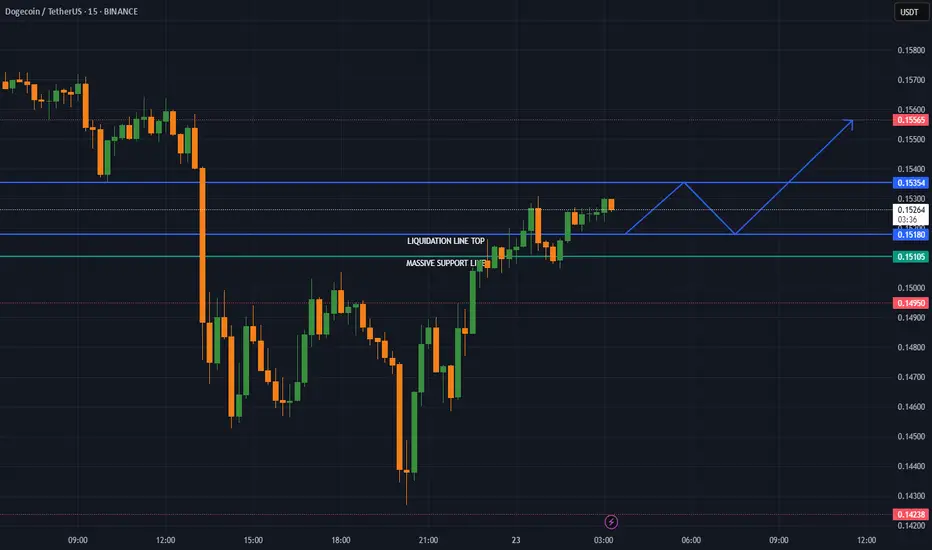
Bullish trend continues for DogeDogeUSDT still going upwards. Trading in complex zone currently. Lots of liquidity bw 0.15154 and 0.15364. Heading towards 0.15364. Will probably retest 0.15154 before a breakout towards 0.15565.
#dogetothemoon #futuretrading
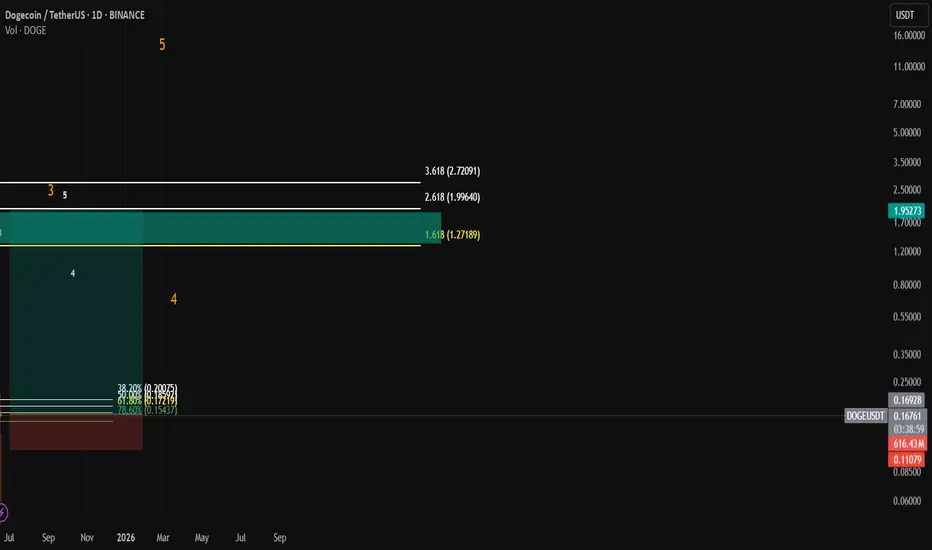
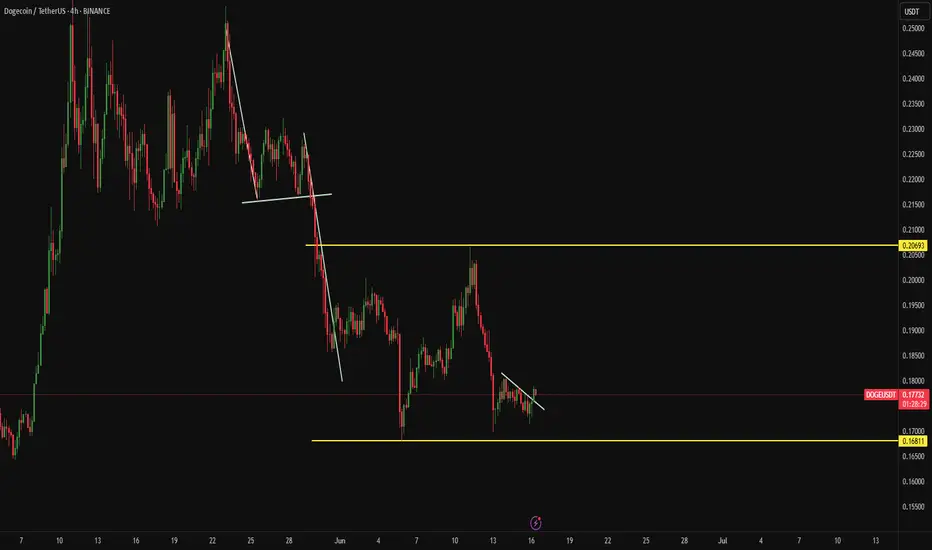
DOGE/USDT trade planThe chart shows a completed WXY correction followed by a triangle (ABCDE), marking the end of the larger correction at Wave 2.
Currently, Wave 3 is underway, with potential to enter the explosive sub-wave 3 of 3 soon. it will be the runner don't forget this coin
32RR trade setup
Entry Zone (Buy Area):
Between 0.154 – 0.172 USDT
Supported by:
61.8% Fib retracement: 0.172
78.6% Fib retracement: 0.154
Strong structural support from previous breakout zones.
🟥 Stop Loss (SL):
Below 0.110 USDT
A break below this invalidates the bullish impulse wave count.
TP1 ~$1.27
TP2 ~ $1.99
TP ~ $2.72
⚠️ Risk Note: Not financial advice. Use proper risk management
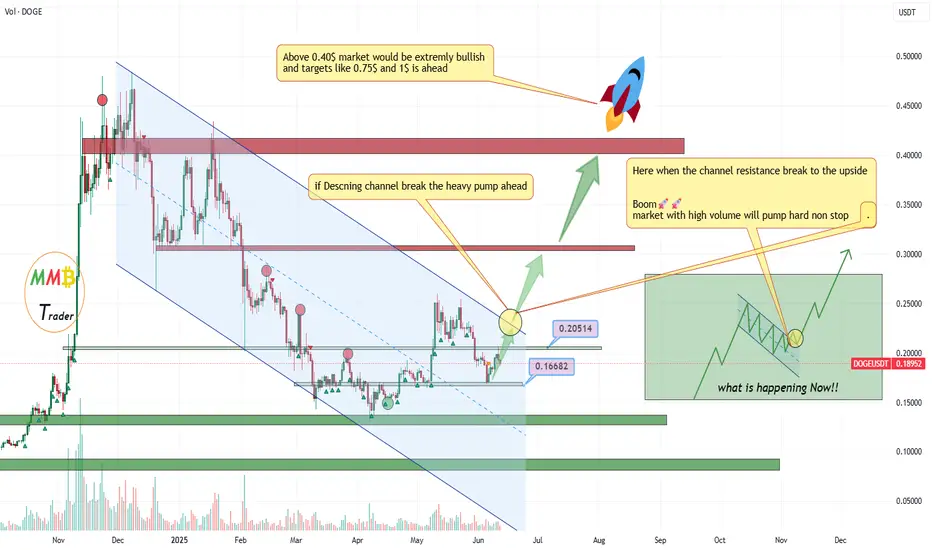
DOGEUSDT Massive pump!!!As we can see market is in range zone now and price is still in descending channel and still receiving range and correction and kicking out the sellers.
But soon after breakout of channel uperside and above 0.25$ resistance price will pump hard and non stop to the targets mentioned on chart.
DISCLAIMER: ((trade based on your own decision))
<<press like👍 if you enjoy💚
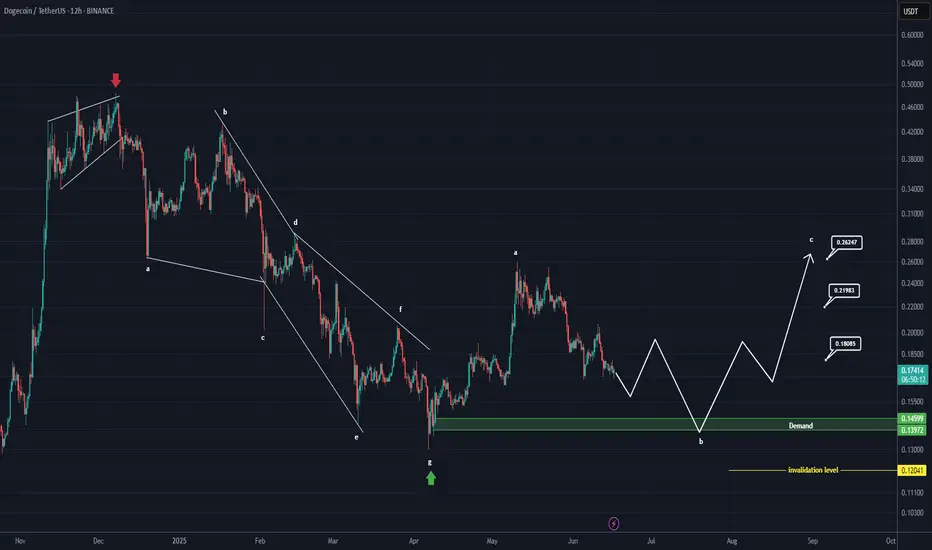
DOGE ANALYSIS (12H)Based on the current available data, it appears that Dogecoin has entered a bullish phase after completing the diametric pattern marked on the chart. We are currently in wave B of this bullish phase.
Wave B may complete within the green zone, which is a key support area.
The targets for wave C have been marked on the chart.
A daily candle closing below the invalidation level would negate this outlook.
For risk management, please don't forget stop loss and capital management
Comment if you have any questions
Thank You
DOGE: Not looking good.Hello Traders,
Today, let’s analyze DOGE on the weekly timeframe.
DOGE isn’t looking very strong at the moment. The price has once again dropped back to the same level from which it rebounded a couple of weeks ago. It’s uncertain whether we’ll see another rebound from this point — but if it does, then great!
However, if market sentiment turns bearish, DOGE could potentially drop to around $0.06. So, stay cautious and trade safely.
Not financial advice.

DOGE: A Reversal In Development?Im monitoring for something like this on DOGE with the plan to DCA as it takes SSL and comes into the range low and demand.
Looking a little weak here with signs on majors of weakness, i can see this going into the SSL and lower demand areas marked.
Still seeing this as a large range development and looking for a HTF bullish reversal to form in this region.
Although theres unmitigated demand in the discount below as marked around $0.11, i dont see this targeting that just yet and my main thesis and bias is this potential range and reversal region we are in here.
1D:
3D:
1W:
1M:

DOGEUSDT - near support? Holds or not??#DOGEUSDT... market just reached near his supporting area even ultimate area. That is around 0.10 and current market price is around 0.15
If market holds current supporting area then we can expect a bounce from here.
Below 0.10 we will never see again bounce ... Note that.
Good luck
Trade wisely
Update on DOGE chart after Apr 7th heavy bleeding🔮 Short-Term Forecast (1–7 Days)
🧱 Base Case Scenario (Most Likely — 60% probability)
If DOGE holds above $0.14, builds support and gradually climbs toward $0.155–$0.16.
Could form a mini bull flag or W-bottom on the 4H/daily.
RSI levels will normalize in the 50–60 zone. This sets up a second leg of recovery — possibly to $0.165–$0.172. ((This is most likely if BTC stays above $72K+ and consolidates.))
🐻 Bearish Continuation (20% probability)
If DOGE rejects from $0.15–$0.155, forms lower high, and BTC breaks back down to test FWB:67K or $65K. In that case, DOGE can retest $0.13 or even wick into the $0.12s. Possible liquidation traps below $0.13.
Monitor BTC dominance: if it spikes, alts like DOGE suffer more.
🚀 Bullish Breakout (20% probability)
If BTC reclaims $80K and surges toward ATH ($85K+), DOGE could: Break above $0.165 and push quickly to $0.18–$0.19. Reignite interest and flip the trend.
📈 Levels to watch
Price Action Reason
$0.14–0.145 Watch support If it holds = accumulation zone
$0.172–0.18 Strong resistance Reclaim = full trend reversal confirmed
🧘♂️ Psychological Edge
The Fear Index was at 17: Usually marks bottoms, not tops.
RSI recovery = healthy reversal start.
High volume + strong candle = whales likely already bought.

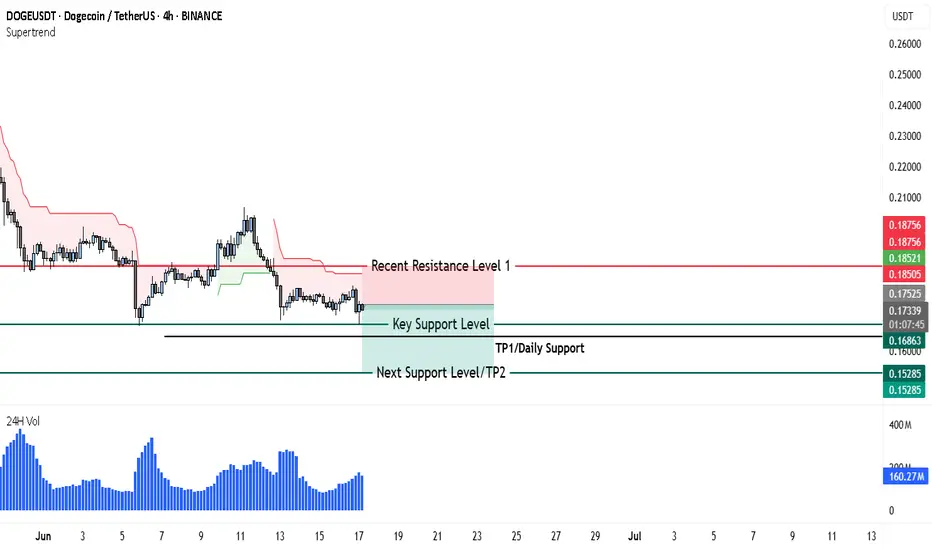
DOGE Support Is Crumbling Here’s Why a Drop to $0.15 Is On CardsThe 4-hour chart for DOGEUSDT reveals a weakening structure, with price currently hovering just above a key support at $0.16863, which also aligns with the marked TP1/Daily Support level. Price action has been consistently rejected from the upper zone near $0.18500–$0.18756, confirming that supply is dominant at higher levels.
The Supertrend indicator remains firmly red and is trailing far above the current price — a strong confirmation that the trend bias is still bearish. Each attempt to retest or reclaim higher ground is quickly sold off, indicating a lack of bullish conviction.
From a structural perspective, DOGE recently formed a lower high followed by a breakdown beneath the local mid-range. This has pushed the price back into a distribution-to-breakdown zone, where the probability of further downside is increasing. If the current support at $0.16863 breaks with momentum, the next obvious liquidity pool is sitting near $0.15285, which is already marked as the Next Support/TP2. That level could serve as the next major bearish target.
Volume also supports a bearish narrative — despite brief surges, the recent volume profile shows no sustained buying pressure, and sellers remain in control around each resistance test. The failure to push above the $0.173–$0.175 region in the last bounce attempt further reinforces the weakening bullish effort.
While some buyers may attempt to defend the $0.168 level, the lack of follow-through on rebounds suggests this support is softening. A clean 4H close below $0.168 — especially on volume — would likely trigger stop-losses and lead to a swift drop toward $0.160 and then $0.152.
If you're looking to position with the bearish trend:
• A low-risk short entry could be placed on any failed bounce near $0.173–$0.175 (prior local supply zone).
• Ideal targets remain at $0.160 and $0.15285.
• Stop-loss can be positioned just above $0.177–$0.180, depending on your risk appetite.
Given the current structure, DOGE is making lower highs, testing support more frequently, and showing no bullish divergence in volume — all classic signs of a market preparing for a breakdown. Unless a sudden reversal in momentum occurs (which would require DOGE reclaiming at least $0.180), short setups are favored.
Long trade
🟢 Trade Journal Entry – Buyside Trade
📍 Pair: DOGEUSDT
📅 Date: Monday, June 23, 2025
🕒 Time: 11:00 AM (NY Session AM)
⏱ Time Frame: 4 Hour
📈 Direction: Buyside
📊 Trade Breakdown:
Metric Value
Entry Price 0.15395
Profit Level 0.17081 (+10.95%)
Stop Loss 0.14844 (−3.58%)
Risk-Reward
Ratio 3.06 : 1
🧠 Context / Trade Notes:
4H Order Block Execution:
Entry triggered at the retest of a 4-hour bullish order block following price rejection and a bullish engulfing structure.

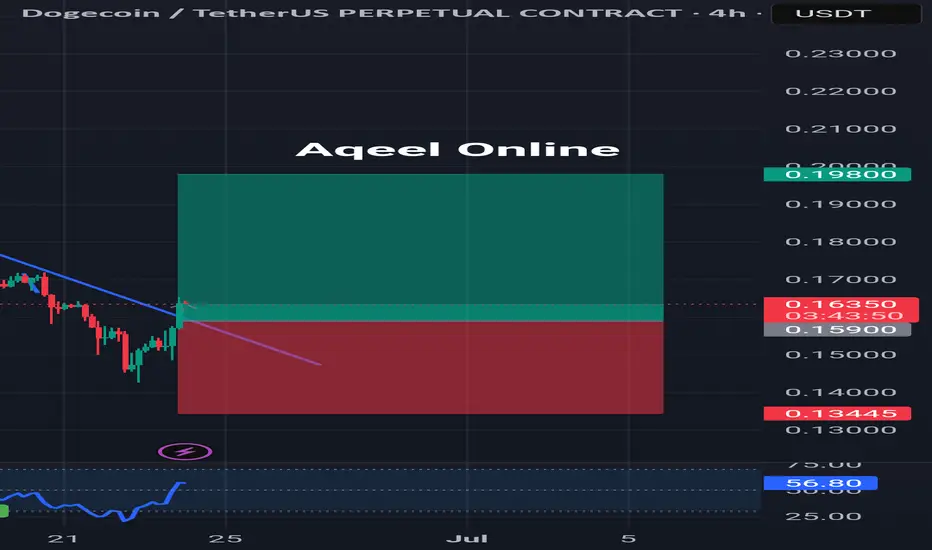
Doge Long SetupDoge has successfully changed it's downtrend to uptrend with heavy volume, Waiting for a potential retest at 0.1590 area then we are good to go towards our MASSIVE target in the coming days.
DOGE Free Call
Longing Now: 0.1590 - 0.1640
Tp: 0.1980
Sl: 0.13445
It will take few days to fully play out.
Do your own research before taking any entry.
Dogecoin is dead, short it to zeroDead coin already RIP
Doge coin can't go any higher and had lost fame and momentum

DOGE/USDTDogecoin is currently in a trading range and could enter a trend if it breaks the upper and lower lines. We'll have to wait and see what happens.
Dogecoin Weekly, Bullish Update —1,2,3,4,5 SequenceJust to make sure we have a little bit of everything, here we have Dogecoin sandwiched in-between EMA34 and MA200.
» XRP is trading above these two levels.
» ADA is trading below.
» ETH is trading above.
» BTC is mixed.
Seeing DOGE in-between can reveal a few things.
No drama, MA200 will hold.
MA200 sits at $0.13822.
Notice the drop between December 2024 and March 2025.
Big red candles; straight down.
Notice the more recent drop, between early May and early June.
Small candles and a curve is starting to show already.
What I am gathering from all these charts is that the retrace only has 1-2 weeks left. I say 1-3 weeks just to play it safe, but it seems to be almost over, the bearish action.
Look at this 1,2,3,4,5 sequence.
1) The last peak.
2) The main low.
3) Initial breakout.
4) Retrace and higher low.
5) The next peak.
We are currently at #4. This means that we are set to experience a new wave of growth, "the next peak."
Thanks a lot for your continued support.
Namaste.

You were warned. Now it’s runningThis was the second test into the FVG + 4H OB confluence. High volume candle. Wicking liquidity. And structure still intact.
Why I stayed calm:
Price didn't just drop — it delivered into a known rebalance zone. That 0.176–0.178 box was a magnet, not a mystery.
The reaction came right on cue:
Volume confirmed interest
Structure stayed intact
And the engine kicked in right after the sweep
Now? The play isn’t about guessing the top. It’s about knowing where price is drawn — and why.
Play-by-play logic:
4H OB provided the base
FVG gave the imbalance
Reaction zone created a clean entry
TP target? +18% mapped to 0.21
I didn’t enter on emotion. I positioned based on structure. That’s why it’s already moving while others still think it needs “confirmation.”
Final words:
“You don’t need hindsight when your foresight is built on logic.”

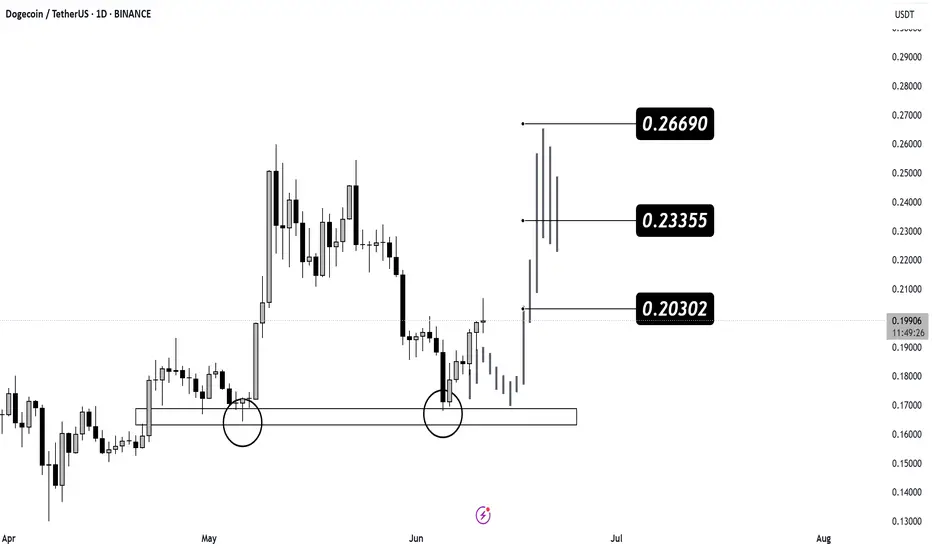
Technical Analysis for Dogecoin (DOGE/USDT) – Daily Chart
🔍 Current Price Action:
Current Price: 0.19892 USDT
The price is reacting positively from a key support zone (highlighted with circles), indicating a strong bounce and potential for upward continuation.
📈 Target Resistance Levels:
0.20302 USDT – First short-term resistance, may be tested soon.
0.23355 USDT – Intermediate resistance; a key breakout level.
0.26690 USDT – Major resistance; target if momentum remains strong.
🧠 Technical Insights:
Pattern Observation: A double bottom-type reaction from support suggests bullish reversal.
Projected Gray Candles: Show a potential bullish scenario toward the next resistances.
Trend Outlook: Bullish bias remains as long as the price holds above the 0.185 area.
✅ Strategy Suggestion:
Entry Zone: Between 0.195 – 0.200 USDT (after confirmation of support hold)
Take Profits:
Target 1: 0.203
Target 2: 0.233
Target 3: 0.266
Stop Loss: Below 0.180 (to protect against failed support)
📌 Summary:
A strong bounce from a confirmed support zone gives DOGE potential for a continued rally toward 0.23–0.26 if the current momentum is maintained.