DOGEUSDT - near support? Holds or not??#DOGEUSDT... market just reached near his supporting area even ultimate area. That is around 0.10 and current market price is around 0.15
If market holds current supporting area then we can expect a bounce from here.
Below 0.10 we will never see again bounce ... Note that.
Good luck
Trade wisely
DOGEUSDT_FCD13E trade ideas
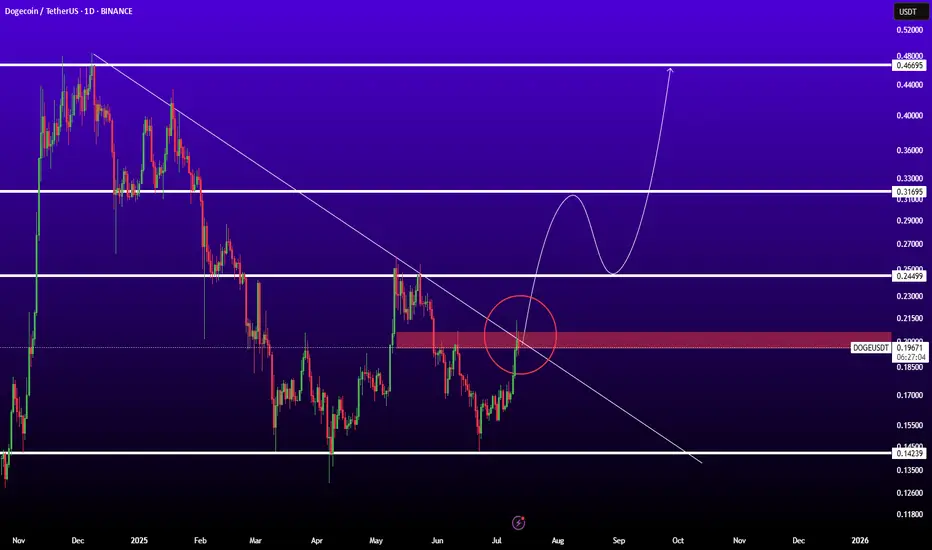
DOGEUSDTBINANCE:DOGEUSDT is in good level for pump because if breaked trendline and resistance 0.200$ ready for sharp movement to next levels.
Resistances: 0.25 - 0.32 - 0.45
Support: 0.15
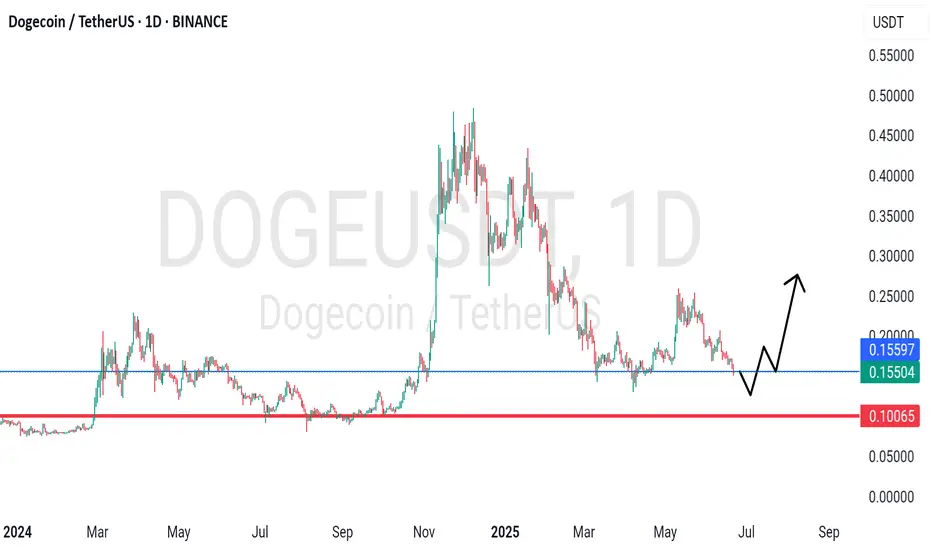
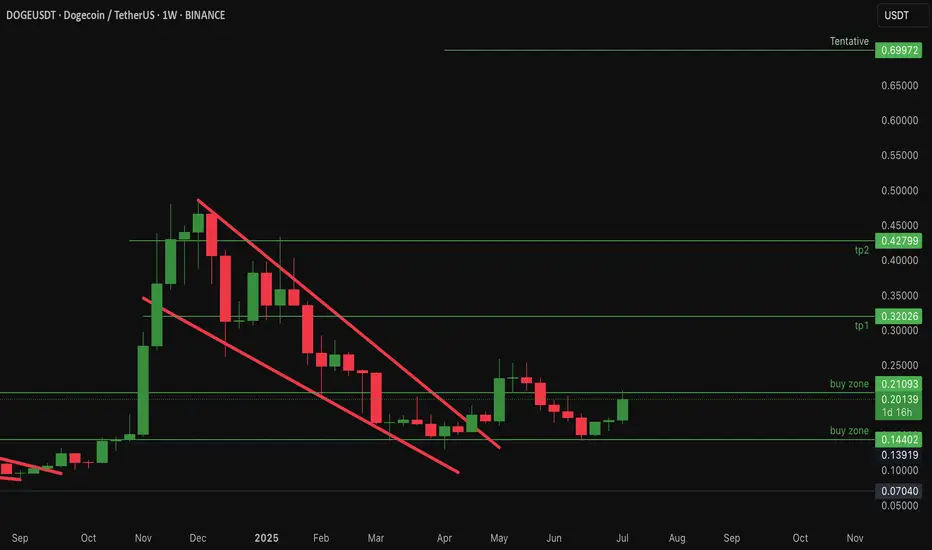
DOGEUSDT WEEKLY CHART | MY FAVORITEHELLO, DOGEUSDT
MEMECOIN my favoritoo
This is just my basic analysis. I see that DOGEUSDT Weekly looks very promising.
Why the Weekly? Because I’m aiming for the long term with DOGEUSDT — i'm Doge Holder..
Only patient people will reap the rewards of their efforts.
Remember, trading involves risk, and you are responsible for your own decisions — manage your finances wisely.

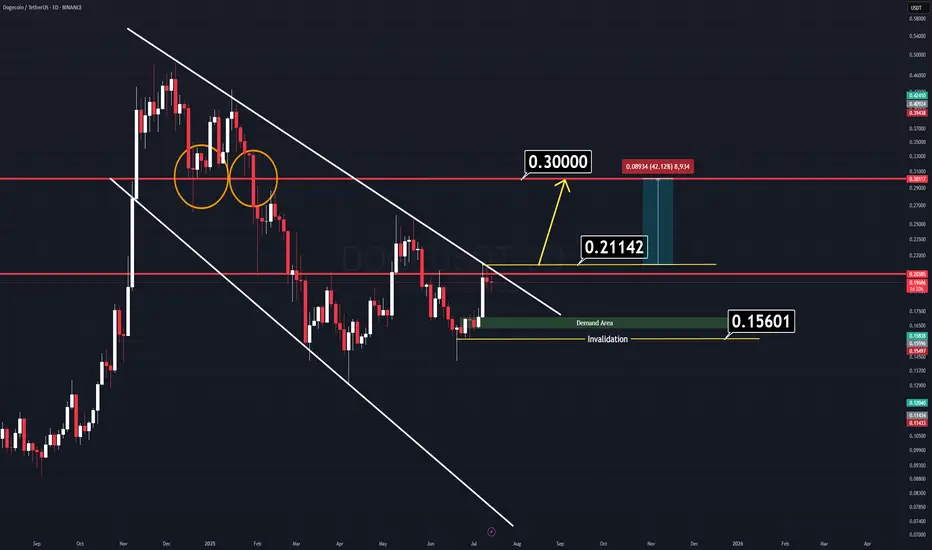
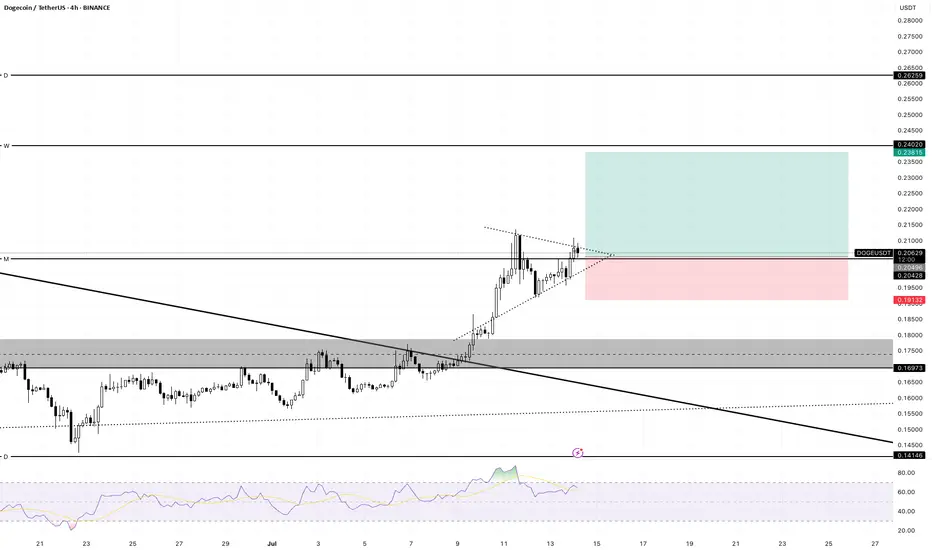
DOGE Analysis (3D)There’s a very simple and clear chart setup on Dogecoin (DOGE) right now.
We have two major horizontal key levels and a channel that is about to break down. If the price manages to close above the yellow-marked line ($0.21142), we can expect a strong rally to follow.
There’s no need for complicated indicators cluttering the screen — all relevant levels are clearly marked on the chart.
Two Logical Entry Approaches:
1️⃣ Breakout Entry: Enter on a confirmed breakout. (Waiting for a daily candle close on a memecoin might slightly reduce your profit range, but it’s the safer approach.)
2️⃣ Demand Zone Entry: Wait for the price to retrace to the green demand zone — though this scenario seems less likely for now.
A combined approach can work best: enter on breakout, use the horizontal levels as support, and set a tight stop-loss to manage risk.
Good Luck.
More DOGE - More WOWThe most probable trade of the morning times from Masta Crypta! with small sl like a sling shot!
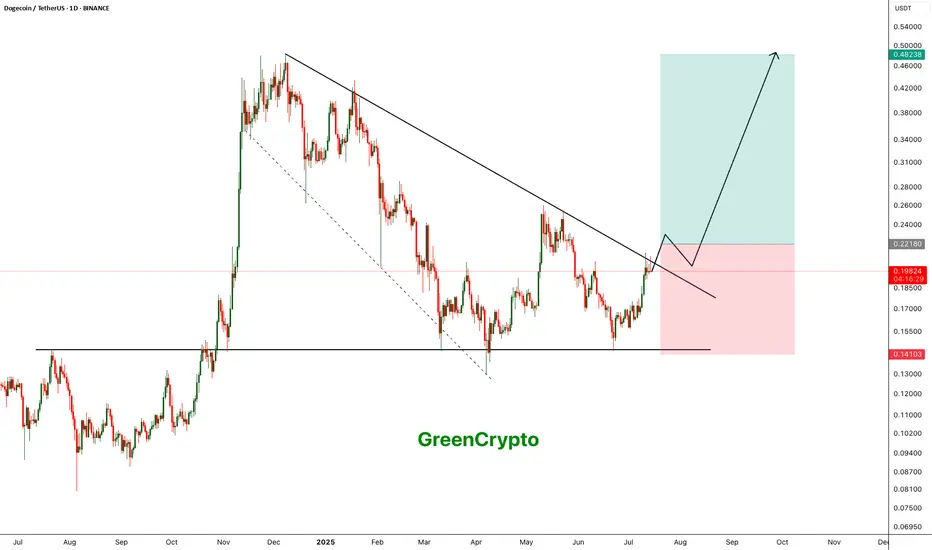
DOGE - Another Perspective- DOGE is currently trading nearing the trendline resistance and pending breakout
- A clear breakout from this resistance line is a must to continue to bullish momentum.
- we will enter the trade after confirmed breakout
Entry: 0.221
SL at: 0.14103
TP1: 0.26035
TP2: 0.33892
TP3: 0.47751
Stay tuned for more updates.
Cheers
GreenCrypto
$Doge Dogecoin about 60% retracement from all time high...CRYPTOCAP:DOGE dogecoin has retraced about 60% from an all time high of about 0.49
Current price: 0.20
Reasons why i am bullish on #Doge
CRYPTOCAP:DOGE price action has remained above the 200ema on the weekly timeframe ...bullish!
- $dogecoin has committed an over 60% retracement from all time high of 0.49
- It is currently at double bottom support seen in April
#dogecoin negative money flow is thinning out
- Sentiments are neutral : neither greedy for fearful
- Price action is exactly at point of control on the weekly time frame!
Resistances above to watch: 0.32, 0.42 up to 0.69
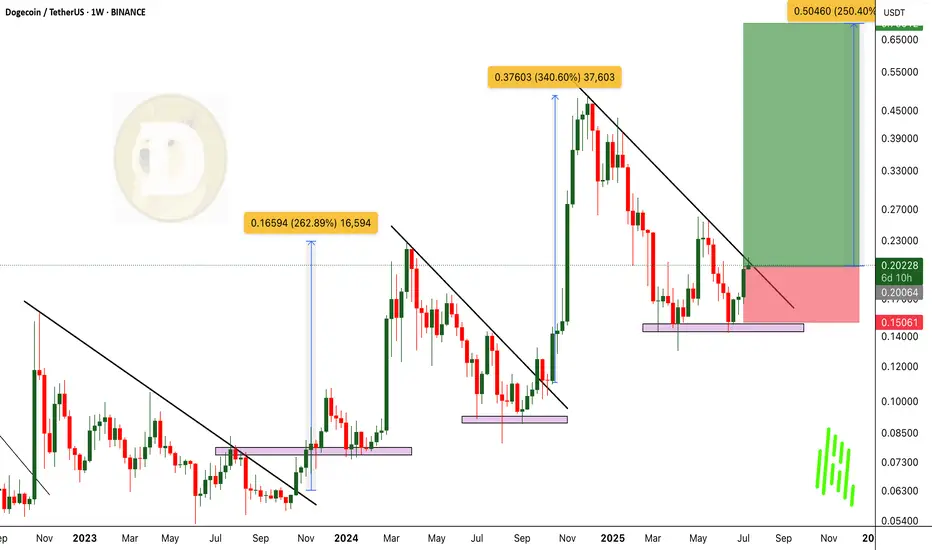
DOGEUSDT Breaking Out. 250% Rally Incoming? History Says Yes!BINANCE:DOGEUSDT is once again showing its classic breakout behavior, This time breaking above a key trendline with strong momentum. Historically, every time CRYPTOCAP:DOGE has broken out of similar structures, it has delivered powerful rallies averaging around 250% gains. And with the current bullish sentiment across the market, this setup looks ready to repeat history.
CRYPTOCAP:DOGE still appears undervalued, especially considering the broader market is already heating up. Once CRYPTOCAP:DOGE starts its move, it tends to run fast and hard – often leaving latecomers behind. This could be the start of the next explosive leg up.
For investors, this is a prime “BUY and HOLD” zone. For traders, this is the time to enter with proper risk management in place. Always use a stop loss and trail your profits accordingly.
BINANCE:DOGEUSDT Currently trading at $0.204
Buy level : Above $0.2
Stop loss : Below $0.15
Target 1: $0.27
Target 2: $0.35
Target 3: $0.48
Target 4: $0.7
Max leverage 2x
Always keep stop loss
Follow Our Tradingview Account for More Technical Analysis Updates, | Like, Share and Comment Your thoughts

DOGE LONG TRADEDoge long position, We have been extremely bullish lately so hopefully we continue and break out of this symmetrical triangle.
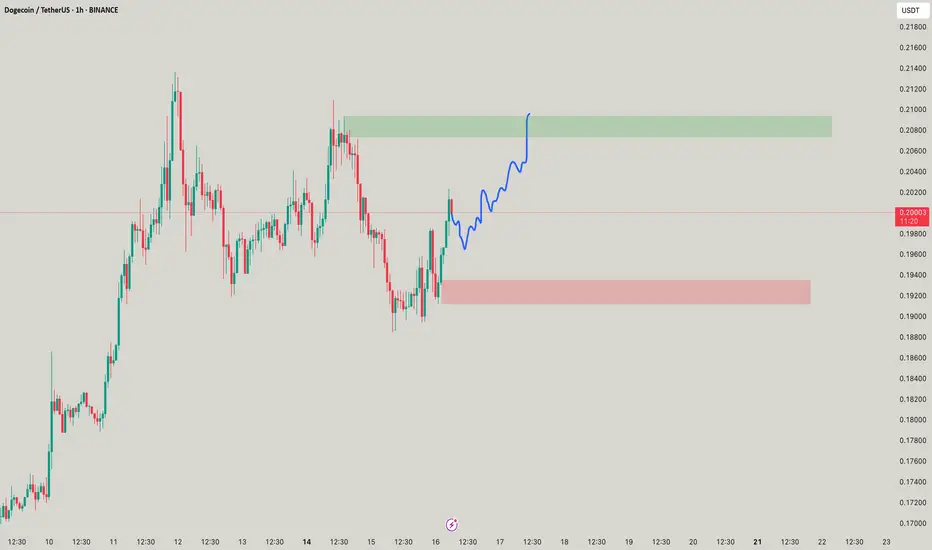
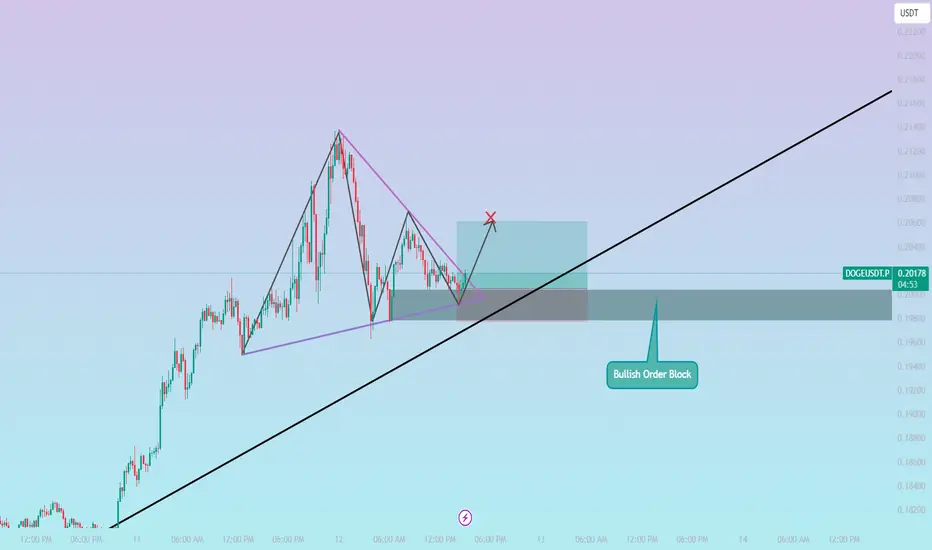
DOGEUSDT / 15M / LONG🚀 DOGEUSDT Long Opportunity | Bullish Order Block + Trendline Confluence
DOGEUSDT is showing signs of a potential bullish reversal from a Bullish Order Block on the 15-minute timeframe. Price has respected the ascending trendline while forming a corrective structure, and we can see clear liquidity grab wicks into the order block zone.
🧠 Smart Money Insight:
The price dipped into the Bullish OB where institutions likely accumulated long positions. With the trendline intact and structure holding, we expect price to push up, targeting liquidity above recent highs.
🔹 Entry: ~0.20050 (Within OB zone)
🔹 Stop Loss: 0.19772 (Below OB invalidation + liquidity sweep)
🔹 Take Profit: 0.20607 (Above recent swing high)
🔹 Risk:Reward Ratio: 1:2 ✅
📌 Confluences:
Bullish Order Block
Trendline support
Break of market structure to the upside
Clear corrective wave into OB (possible Wyckoff accumulation behavior)
🎯 If price maintains above the OB and breaks structure, this could lead to a bullish impulsive wave.
The Right Way to Manage Stop Loss: Dynamic Logic for Smart ExitsContext
In fast-moving markets, static stop losses often sabotage good trades by exiting too soon or too late. This approach uses dynamic, logic-driven stop loss adjustments that adapt to market context instead of sticking to a single fixed distance.
⸻
Key Principles of This Stop Loss Logic
Contextual Initial Placement
The stop is never just a fixed percentage below entry. It adapts based on recent swing lows/highs, ATR volatility, and trend confirmation signals.
Dynamic Extension in Favorable Conditions
If price retraces but shows bullish reversal evidence such as deep oversold signals, positive divergence, or compression breakouts, the stop loss is extended instead of closing immediately. This prevents cutting winners during normal pullbacks.
Tightening When Momentum Fades
If momentum weakens (for example, ADX drops, failed bounce, or resistance rejection), the stop is tightened dynamically. This reduces drawdown if the trend fails.
Clear Exit Triggers
The system can exit on consolidation breakdowns below support, confirmed bearish reversal patterns, or time-based exits if no continuation happens.
⸻
Examples and Visuals
Below, I’ve included chart examples with screenshots from my Multi Crossover Strategy . These images illustrate how dynamic stop loss management behaves in real conditions—showing entries, extensions during retracements, and exits triggered by different scenarios. You can see how the logic responds to changing volatility and trend strength in real time.
The "+" signs mark bars where the position would have closed using the default settings of 2.5 ATR Multiplier stop loss. A bullish reversal signal extended the stop, allowing the trade to close profitably instead of at a loss.
This example shows an early exit triggered by a consolidation breakdown. The system closed the position before the maximum stop loss was reached, limiting the loss as bearish momentum increased.
Example for lower high close to reduce loss. Here, the position was closed after a failed bounce and the formation of a lower high, signaling a likely continuation of the downtrend and helping to reduce the loss before a deeper move.
⸻
Advantages Over Simple Stop Losses
Adaptation
Stops react to volatility and price structure, not arbitrary distances.
Risk Mitigation
Dynamic tightening locks in gains faster when momentum fades.
Confidence to Stay In
Dynamic extension reduces the chance of premature exits during healthy retracements.
⸻
How to Use This Approach
When designing your strategy, start by defining a volatility-adjusted stop using an ATR multiplier as the base distance from entry. You can then set a maximum allowable loss in percentage terms to cap risk exposure to a fixed threshold.
After establishing your initial stop, consider adding layered adjustments that respond to different levels of reversal risk. For example:
ATR Multiplier: the factor used to calculate the initial stop distance based on market volatility.
Maximum Loss (%): the maximum risk per trade, defined as a percentage below the entry price.
Tight Stop Loss (%): a closer stop level that activates when early signs of a potential reversal appear, such as weakening momentum or minor bearish movement.
Bearish Stop Loss (%): a further tightening of the stop distance when stronger bearish reversal signals occur, including failed bounce attempts, lower highs, or clear resistance rejections. This level reduces the tolerance for further losses but still allows the trade to remain open if price stabilizes.
Extended Stop Loss Percentage Add-On: an additional percentage beyond the maximum loss cap, temporarily applied if strong bullish recovery signals appear.
In addition to these percentage-based stop adjustments, you can define instant exit rules that immediately close the position as soon as specific structural conditions are met. Unlike percentage-based stops, instant exits do not wait for further price movement or confirmation. They are typically used to react to decisive events such as a confirmed breakdown below support, a lower high after a failed bounce, or a sharp rejection at a resistance level. This combination of tightened stops and instant exit triggers allows for a flexible but disciplined approach to managing trades.
Pro Tip:
Most traders lose because their stops don’t evolve with the trade. Build a logic tree:
If trend = strong ➡ extend stop
If reversal risk ➡ tighten stop
If clear reversal signs ➡ exit
⸻
Disclaimer: This content is for educational purposes only and does not constitute financial advice. Please do your own research before making trading decisions.

Doge can be a great long position Altcoins are about to start going up. And the Dogecoin has a strong resistance ahead. It can be a 1:9 or higher RRR.
*This is not a financial advise and is just an experimental idea.

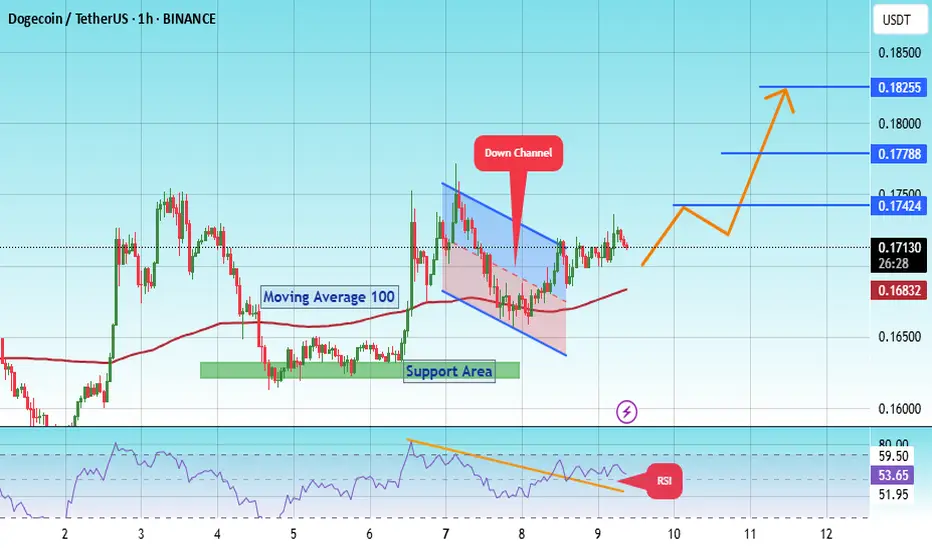
#DOGE/USDT Long Swing Setup #DOGE
The price is moving within a descending channel on the 1-hour frame, adhering well to it, and is on its way to breaking it strongly upwards and retesting it.
We have a bounce from the lower boundary of the descending channel, this support at 0.1660.
We have a downtrend on the RSI indicator that is about to break and retest, supporting the upside.
There is a key support area in green at 0.16200, which represents a strong basis for the upside.
Don't forget one simple thing: ease and capital.
When you reach the first target, save some money and then change your stop-loss order to an entry order.
For inquiries, please leave a comment.
We have a trend of stability above the Moving Average 100.
Entry price: 0.17120
First target: 0.17420
Second target: 0.17788
Third target: 0.18250
Don't forget one simple thing: ease and capital.
When you reach the first target, save some money and then change your stop-loss order to an entry order.
For inquiries, please leave a comment.
Thank you.
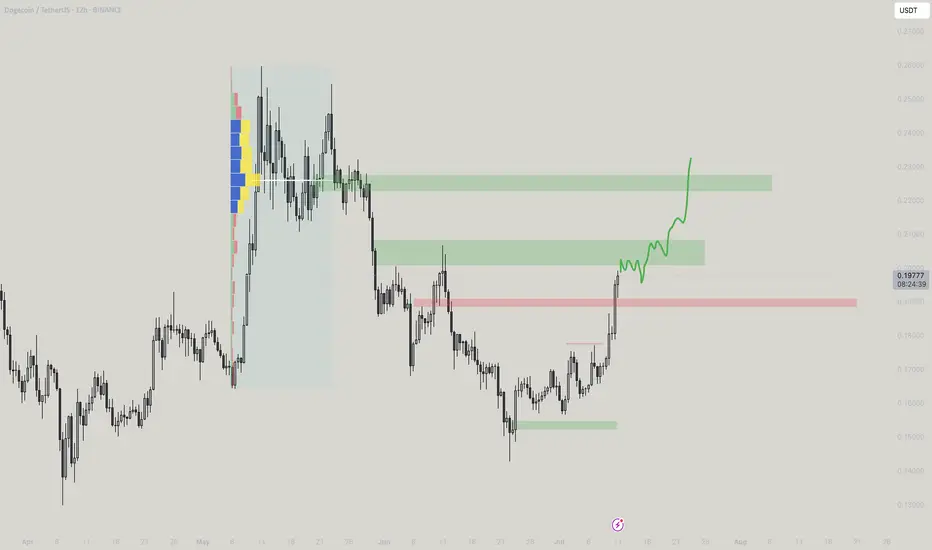
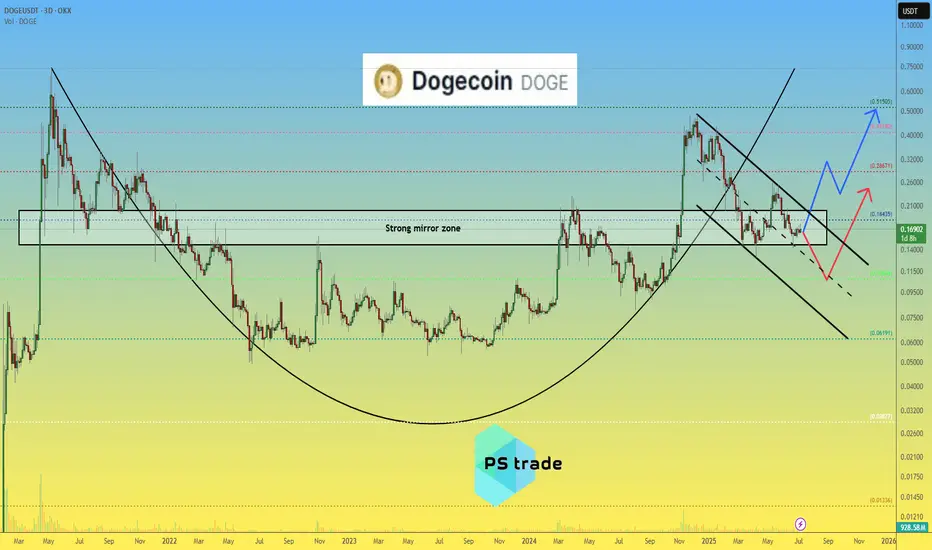
Dogecoin DOGE price analysisCRYPTOCAP:DOGE price is now in the middle of a strong mirror zone of $0.15-0.20
📈 It looks like the position is now accumulating, forming a "double bottom" and then, only a way for growth, to the highs in the region of $0.45-0.50
🐻 On the other hand, the scenario of another "leg" down fits perfectly into the TA canons. That is, it is very likely that if the price of OKX:DOGEUSDT drops below $0.15, then it is already fall to $0.10)
P.S.:
#Doge is an interesting asset, it is worth watching with one eye, and with the other eye, watch how the "battle" between Trump and Musk (who is the main influencer and "pumper" of #Dogecoin) will end.
💡 And then put the two pieces of information together and make a trading decision - "easy money" !)
_____________________
Did you like our analysis? Leave a comment, like, and follow to get more
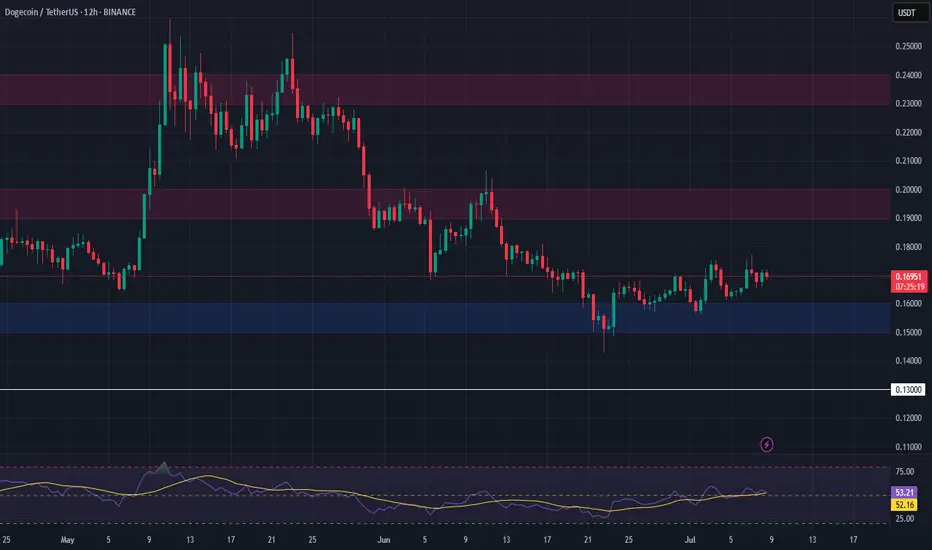
DOGE Long Swing Setup – Musk-Fueled Hype & Political BuzzElon Musk’s launch of the “America Party” is reigniting interest in his potential impact on crypto—especially Dogecoin. With his history of moving DOGE’s price, this political pivot could stir volatility and renewed upside. We’re watching for a dip into the $0.15–$0.16 zone for a possible long entry.
📌 Trade Setup:
• Entry Zone: $0.15 – $0.16
• Take Profit Targets:
o 🥇 $0.19 - $0.20
o 🥈 $0.23 – $0.24
• Stop Loss: Daily close below $0.13
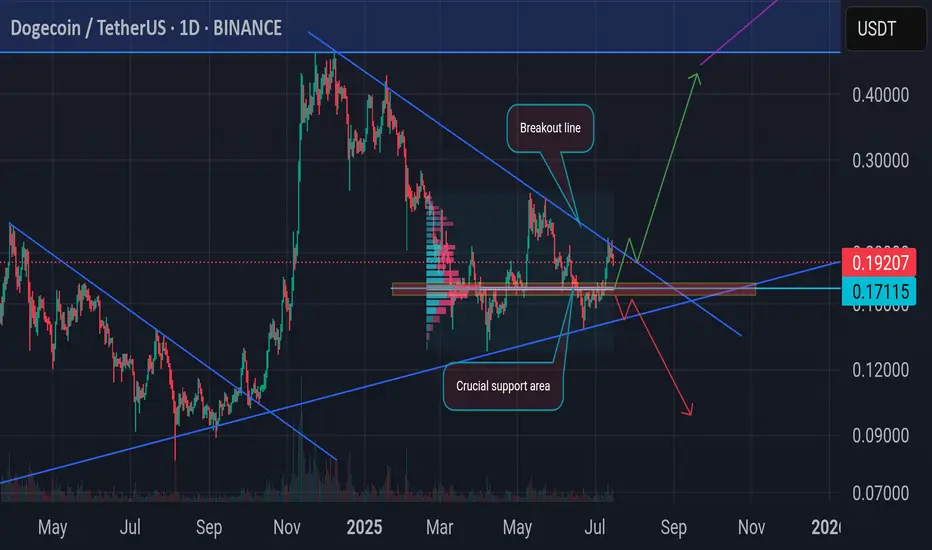
Fill your porto with DOGE :)Fill your portfolio with DOGE. DOGE's price structure 1D remains bullish. It would be impressive if it breaks through the breakout line.
⚠️ The $0.17115 support level is a crucial level to maintain, otherwise the price may decline further.
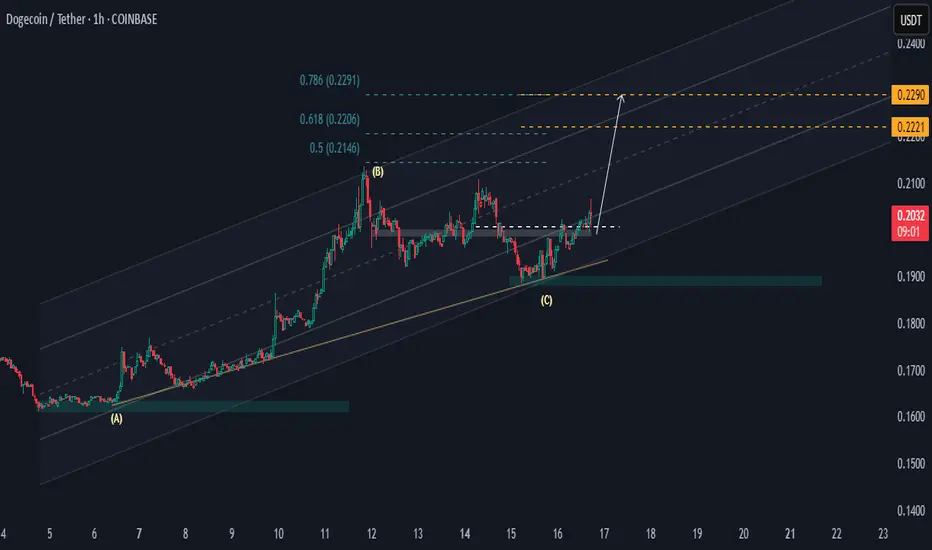
DOGEUSDT Above Key SupportHi there,
DOGE/USDT looks bullish at H1 with two potential price targets for a bias of 0.2290.
The price made a higher low at the 0.1900 area zone and pushed above the key level of 0.1990, and it is hovering above this level. Now, as long as the 0.1900 sustains the 0.1963 low, then the price will rally to previous highs.
Happy Trading,
K.
DOGE setting up a bullish Bull Flag?DOGE is moving within a descending channel after making a good run upside.
Current tend shows possibly setting up a bullish bull flag pattern. If breakout verified, DOGE will skyrocket to $0.25 range in coming days.


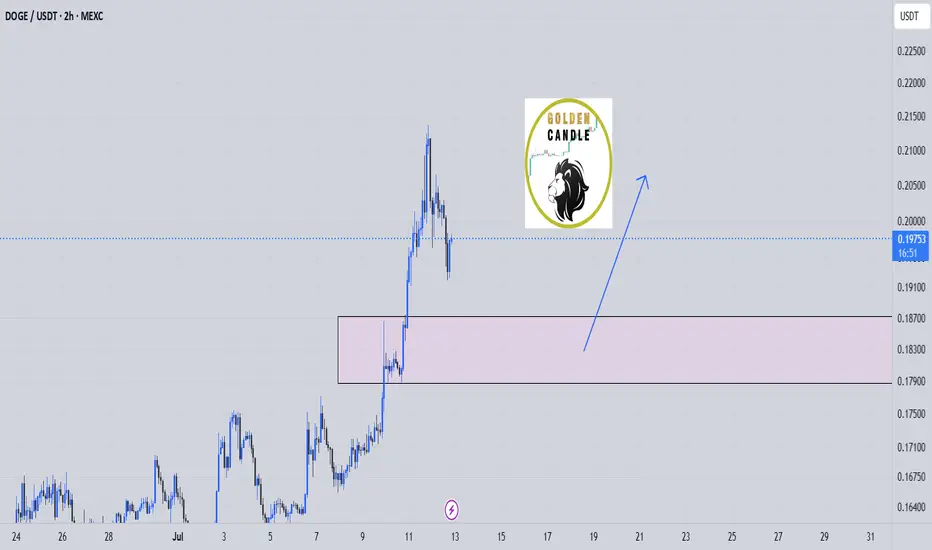
doge buy midterm"🌟 Welcome to Golden Candle! 🌟
We're a team of 📈 passionate traders 📉 who love sharing our 🔍 technical analysis insights 🔎 with the TradingView community. 🌎
Our goal is to provide 💡 valuable perspectives 💡 on market trends and patterns, but 🚫 please note that our analyses are not intended as buy or sell recommendations. 🚫
Instead, they reflect our own 💭 personal attitudes and thoughts. 💭
Follow along and 📚 learn 📚 from our analyses! 📊💡"
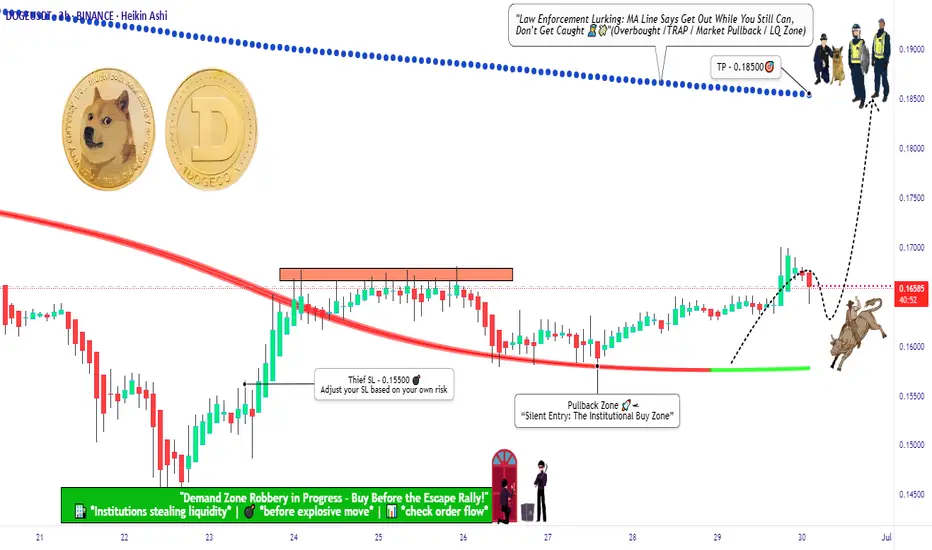
DOGE/USDT Breakout Theft Plan| Smart Entry + Exit| Bullish Bias🐶💰 DOGE/USDT Master Heist Plan – The Bullish Breakout Robbery! 💸🔓
(Thief Trading Style – Steal Profits, Not Dreams)
🌟Hello, Hola, Ola, Bonjour, Hallo, Marhaba!🌟
To all the fearless Market Movers & Silent Operators out there – welcome to another strategic DOGE raid guided by technical precision and macro-level insight! 📈🧠
🔐 The Game Plan – Let’s Break the Bank!
This chart outlines our long-entry mission for DOGE/USDT, based on a unique Thief Trading Style strategy. The market currently shows bullish momentum, setting the stage for an upside breakout—but not without traps! Stay sharp.
💥 Key Concepts at Play:
Pullback Zones = Entry Points (Mark the lows, grab the loot)
ATR Line Zone = High-Risk Area (Time to plan your exit)
Reversal & Consolidation Zones = Watch for fakes & traps
News Events = Potential market detonators – keep your stop-loss close
📍Entry Point – "The Vault’s Open!"
💰 Plan A: Instant execution for those already prepped.
📉 Plan B: Place Buy Limit Orders near recent 15–30 min swing lows for a stealthier entry during pullbacks.
🚨Stop-Loss Setup – Safety First, Always
📍 Recommended SL: Near the 2H swing low (around 0.15500)
🛡️ Adjust based on your personal risk, account size, and trade volume. Thieves plan smart—never go in blind.
🎯Target – Clean the House and Vanish
🎯 Primary Target: 0.18500
⚠️ Exit early if market conditions shift. The first rule of the game? Don’t get greedy.
⚡Scalpers’ Mode – Hit & Run
Only trade LONG setups. Whether you’re a heavy hitter or playing it safe, stick with the bulls. Use trailing SL to protect the bag.
📊Why This Heist Works – Under the Hood
The DOGE/USDT setup is driven by:
✅ Bullish sentiment
✅ Fundamental trends
✅ Macro drivers
✅ On-chain activity & intermarket signals
✅ COT Reports & future momentum indicators
(For full breakdown, check linkkied data 👉🔗🔍)
📡News & Risk Management Reminder
🚫 Avoid opening fresh trades during high-volatility news events.
📉 Always trail your stop to secure profits during live positions.
Adapt fast – the market changes in a blink.
❤️Support The Plan
💥 Smash the Boost button to help spread the Thief Trading Style across the platform! Let’s make smart money together, one chart at a time. Every like, comment, and follow powers the next move. 💪💵🚀
🔔 More Heist Plans Coming Soon – Stay connected, stay dangerous... and stay profitable.
🐱👤Until then – Trade Smart. Trade Thief. Make Your Mark. 💸