DOGE is stuck in the golden pocket... but for how long?📍Chart Breakdown:
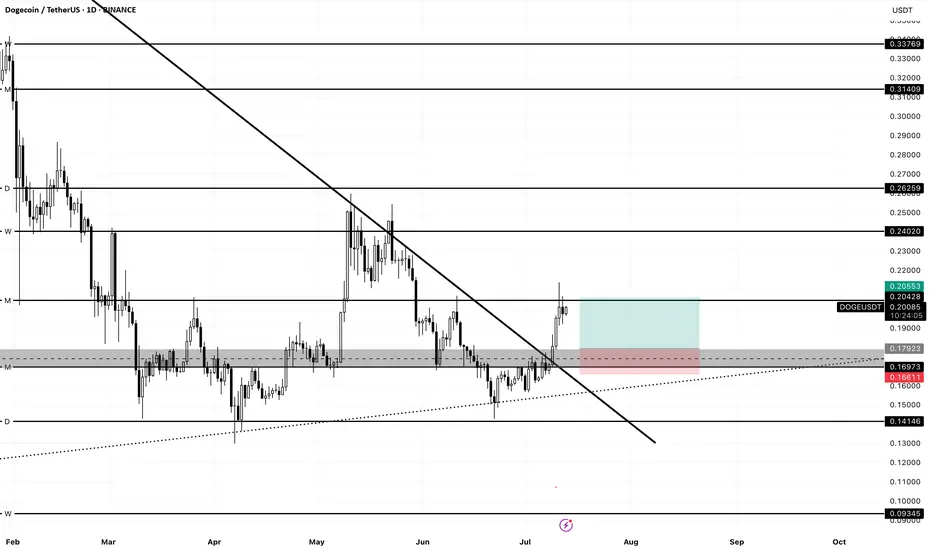
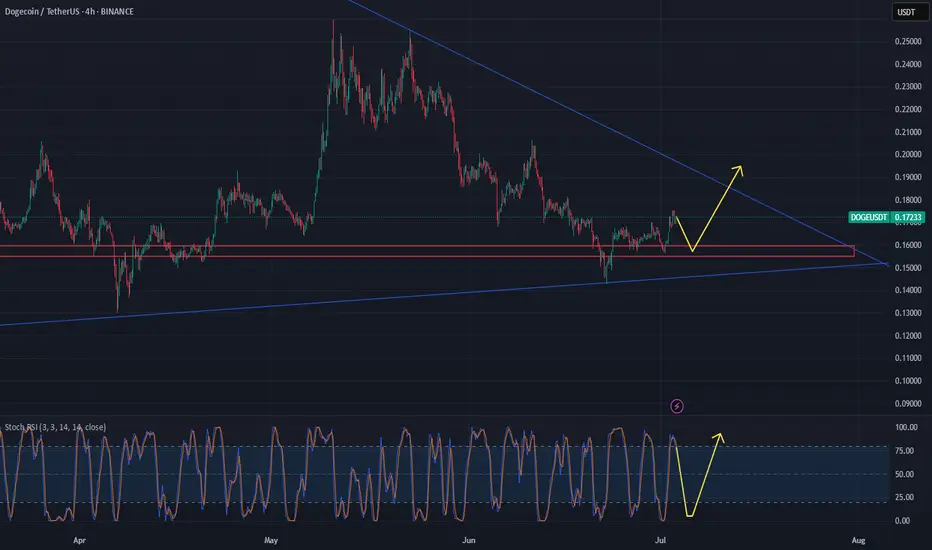
Dogecoin is consolidating within a key Fibonacci retracement zone, ranging between $0.158 and $0.178 — what traders often call the “golden pocket.” Price is coiling just above critical support.
🟡 Fibonacci Zone (Golden Pocket):
The $0.158–$0.178 area has acted as both resistance (early May) and support (mid-June onward).
Holding this range = potential bullish continuation.
Breaking below = likely retest of $0.14 or lower.
📉 Recent Context:
Sharp drop from the $0.22–$0.23 area in early June.
Since then, DOGE has been trying to base out in this fib zone.
Trendline support from April still loosely intact.
📊 Indicators:
Stoch RSI: Mid-range (53), turning up — could indicate a potential bounce or continuation higher.
Volume: Still muted — watch for spikes on breakout attempts.
🧠 Trade Scenarios:
Bullish: Break and close above $0.178 could retarget $0.20 and eventually $0.23.
Bearish: Breakdown of $0.158 with volume = high risk of drop to $0.14
DOGEUSDT_FCD13E trade ideas

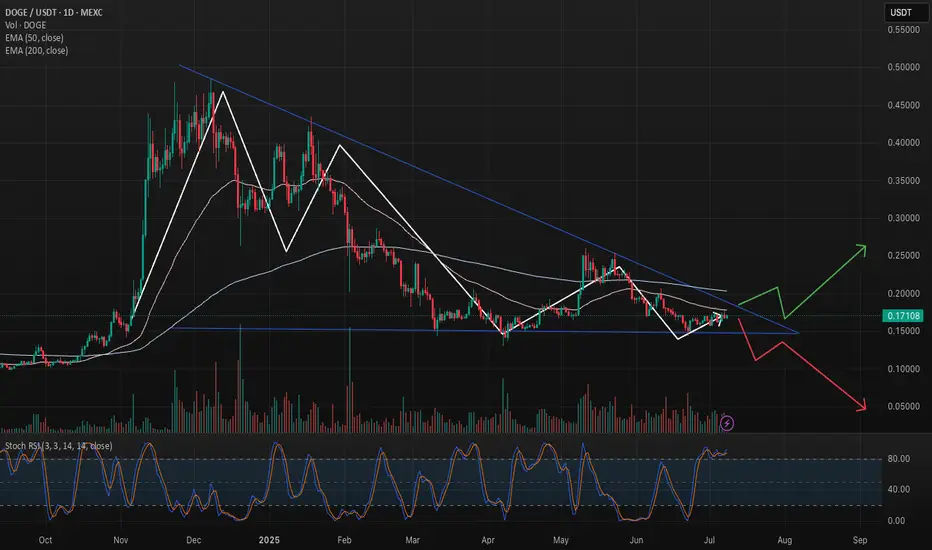
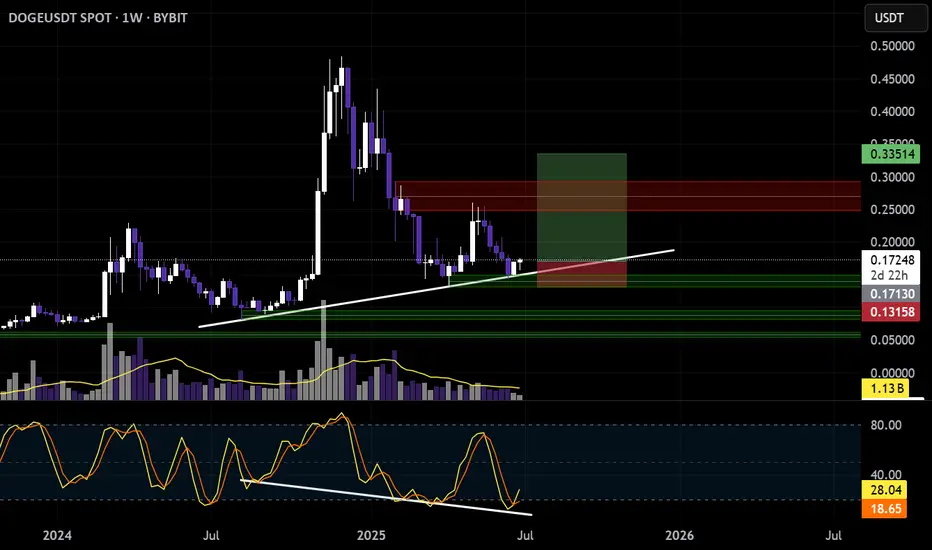
DOGE Presses Into Long-Term Trendline — Breakout or Breakdown?DOGE is approaching a multi-month descending trendline with rising volume and an overbought stochastic RSI. Price is coiling in a tight triangle just below both the 50 and 200 EMA — a major move is on deck.
🟢 Scenario 1 – Bullish:
Break above $0.18 and reclaim of the 200 EMA ($0.20) could launch DOGE toward $0.25+. A confirmed flip of the trendline would mark a major sentiment shift.
🔴 Scenario 2 – Bearish:
A rejection here and break below $0.16 could lead to a steep drop toward $0.12 or lower. The red path shows a return to the broader downtrend if bulls fail to step in.
⚠️ Stoch RSI is at extreme levels — suggesting the next move may come soon.
All market will face to fall!All markets are expected to decline, so the focus should be on short positions.
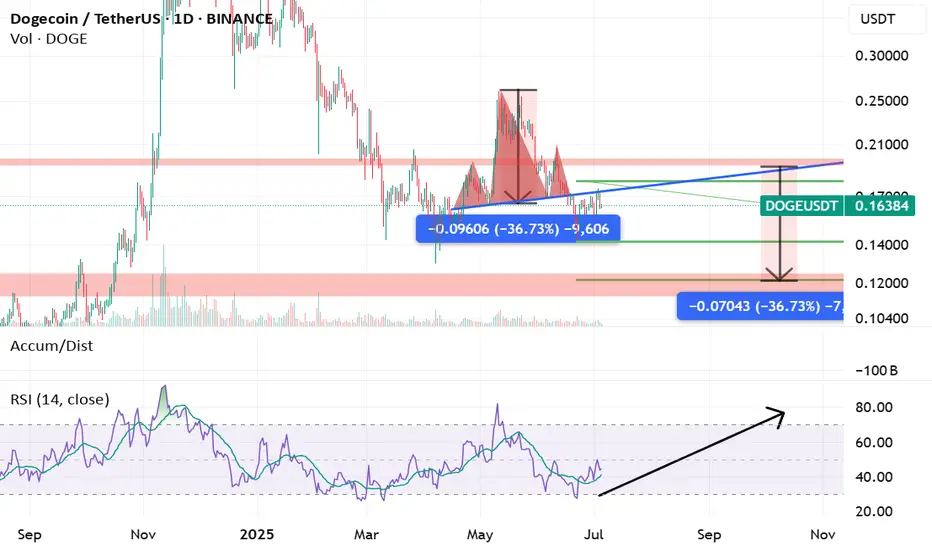
DOGEUSDT Technical Analysis – Is Dogecoin Preparing for a Major 🚨 DOGEUSDT Technical Analysis – Is Dogecoin Preparing for a Major Move?
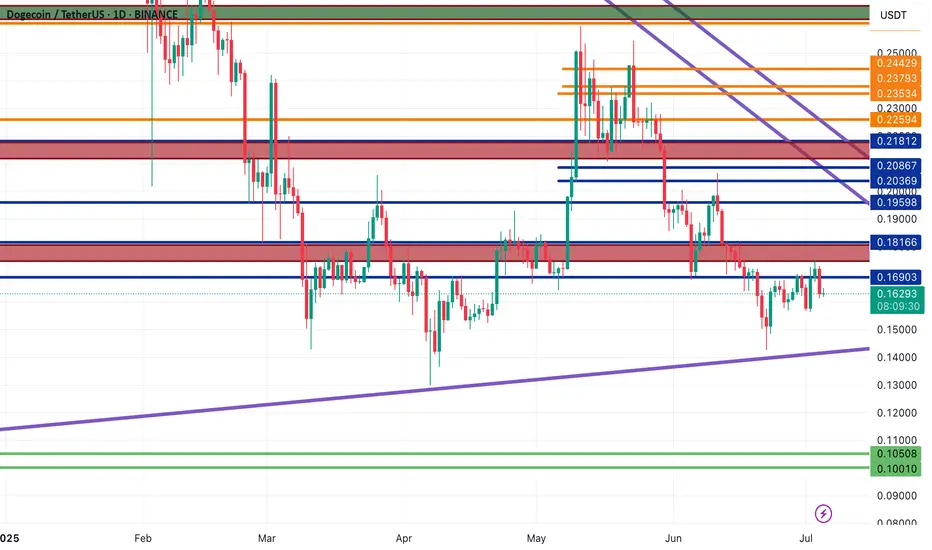
As predicted in my previous analysis, all key support and resistance levels have worked out perfectly.
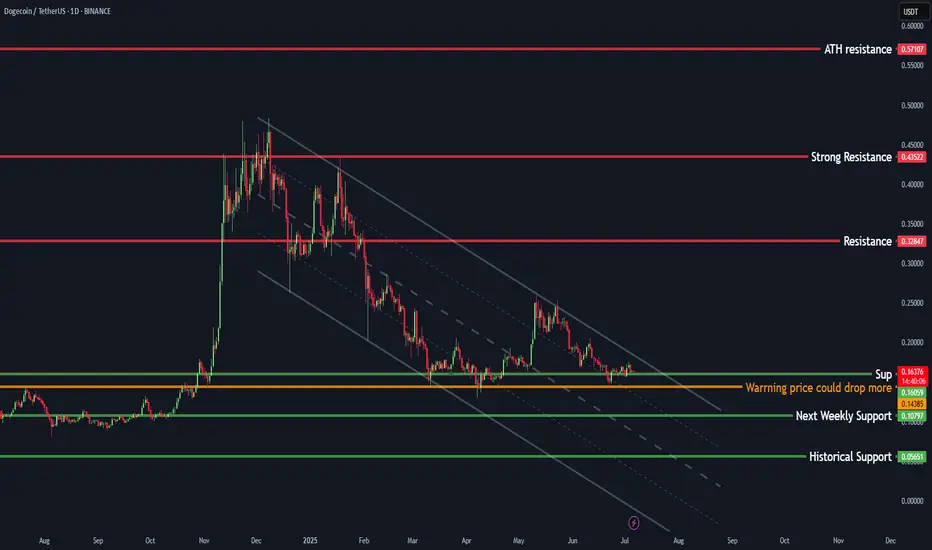
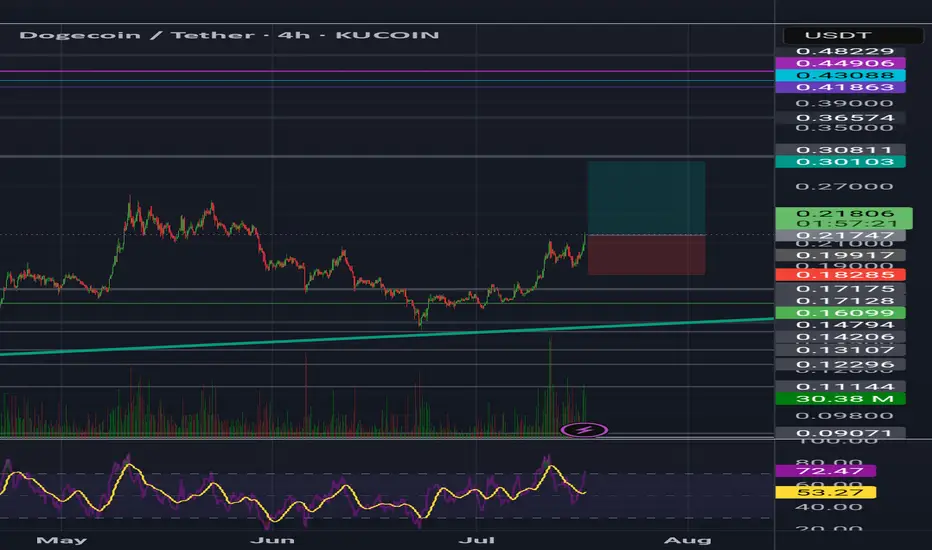
📌 Currently, DOGE is facing a major resistance zone (red area) and has been rejected after testing it. If the price fails to break this zone and selling pressure continues, the next strong support areas lie between 0.15197 and 0.10508. These ranges could act as solid buy zones.
🚀 On the other hand, if DOGE manages to break above the red resistance, we could see a move toward the first major target at 0.19600, followed by 0.20369 and 0.20867.
📊 This is a crucial decision point for Dogecoin. Whether it breaks out or pulls back, both bullish and bearish scenarios are clearly mapped.
🔍 Follow me for real-time price action updates, breakout alerts, and clean technical charts!
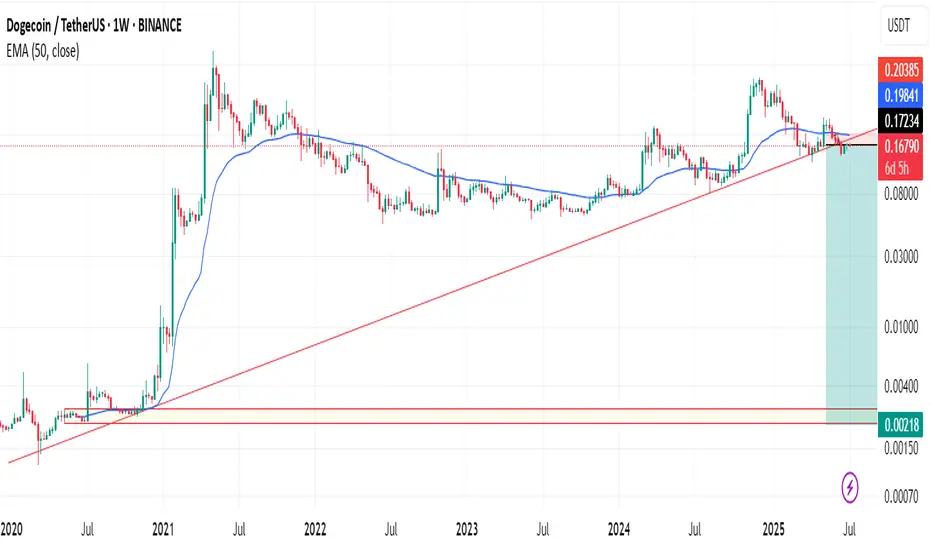
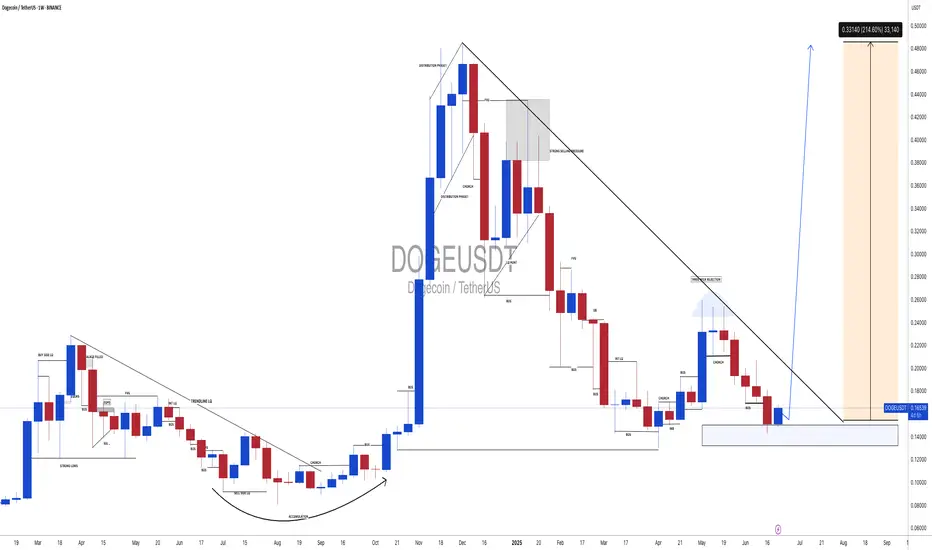
DOGEUSDT: Time For Bulls To Rule! The Dogecoin is currently trading at a key buying level, making it a potential opportunity to buy. However, we need confirmation before making a purchase or entering a trade. This trade could take time to develop as we are currently in the accumulating phase. To be certain of the price direction, we need to enter the distribution phase. While a single swing trade could be a target, you can set your own risk management parameters.
Good luck and trade safely!
Team Setupsfx_
Are you ready for New Miracle ? Doge is one of them#Gold #XAUUSD #PriceAction #Fibonacci #EMA50 #TradingView #Scalping #TrendTrading #LiquidityGrab #AltcoinsSpeakLouder #TradeWithMky
What happens when price dives, grabs liquidity, and kisses the 50 EMA with a bullish shadow candle?
You get what I call a "Miracle Shot" setup.
🔹 Price retraced deeply into a golden zone (between 50–61.8% Fibonacci).
🔹 The candle with a long lower wick shows liquidity grab.
🔹 Immediate bullish rejection right from the EMA50 = clear entry signal.
🎯 Entry: Near EMA50 + confirmation candle
🛑 SL: Below the shadow
✅ TP: Fibonacci extensions at 161%, 261%, and 414%
You can already see how price exploded after this textbook setup.
In the next move (second screenshot), price creates a wick to the upside—classic sign of profit-taking or potential trap for late buyers.
✍️ If price retests EMA50 again with a valid setup, this could be your Re-entry Shot.
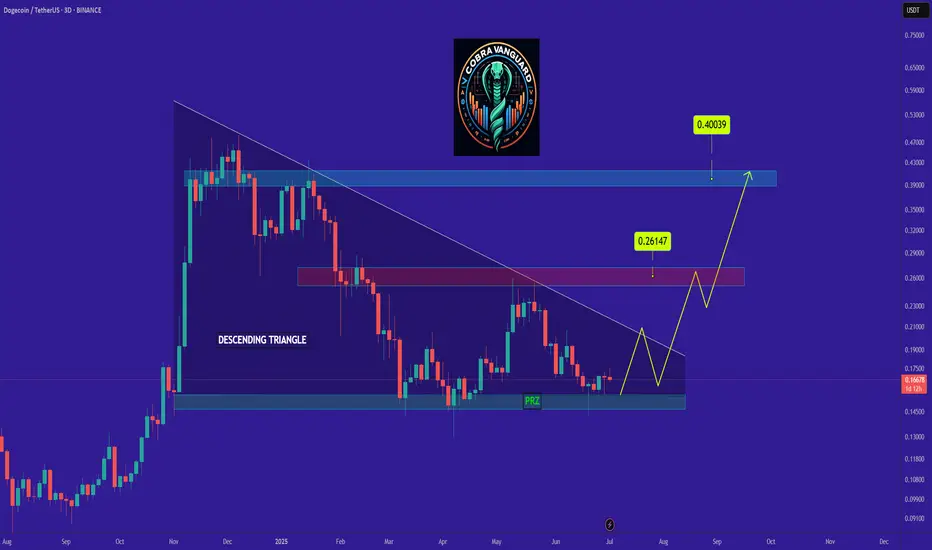
DOGE Ready for PUMP or what ?The price is within a descending triangle, which is discouraging, but this market often behaves contrary to these patterns, and it could be the start of a new price increase. I won’t fall for these patterns anymore.
Best regards CobraVanguard.💚
DOGE UpdateDOGE Price Update
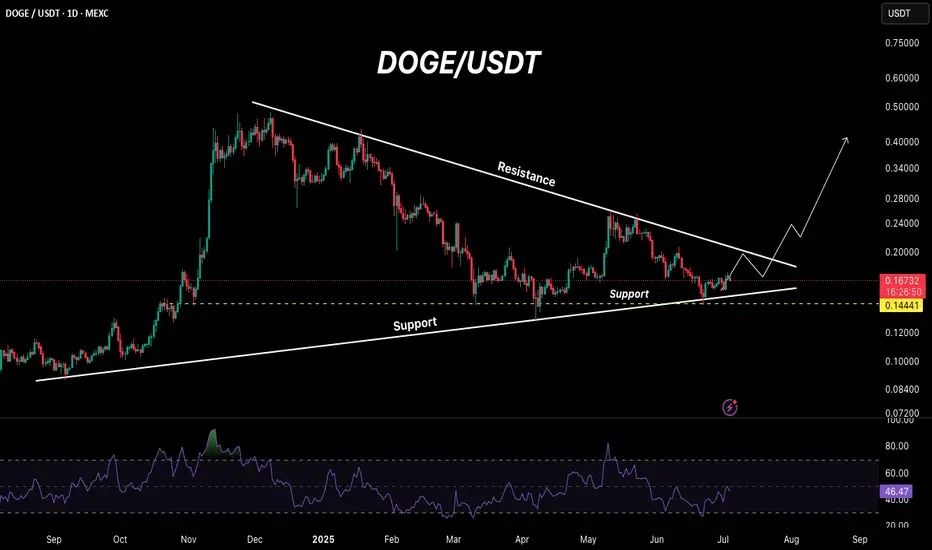
DOGE is currently forming a symmetrical triangle pattern, holding above the support line. An upward rally is likely, but for a bullish confirmation, DOGE must break above the resistance trendline on the daily timeframe.
Strategy:
~ Entry / Accumulation: $0.144 to CMP
~ Invalidation: Daily candle close below the support line ($0.144)
~ Target: $0.30 – $0.50
Note: Don’t rush into the entry. Always conduct your own thorough research and analysis before investing.
Regards,
Dexter
Much DOGE Much WOW!DOGE will caught you on the guard to eat you! Beware! You know the direction well! Its a well liq hump!
Trending Tokens Are Traps they Destroy your Portfolios🚨 Why Everyone Falls for Trending Projects That End in Disaster
Have you ever bought a token just because everyone was talking about it?
And the moment you jumped in, it started crashing?
This isn’t a rare story; it’s a repeating trap. But why does our brain love buying at the worst possible moment?
Hello✌
Spend 3 minutes ⏰ reading this educational material.
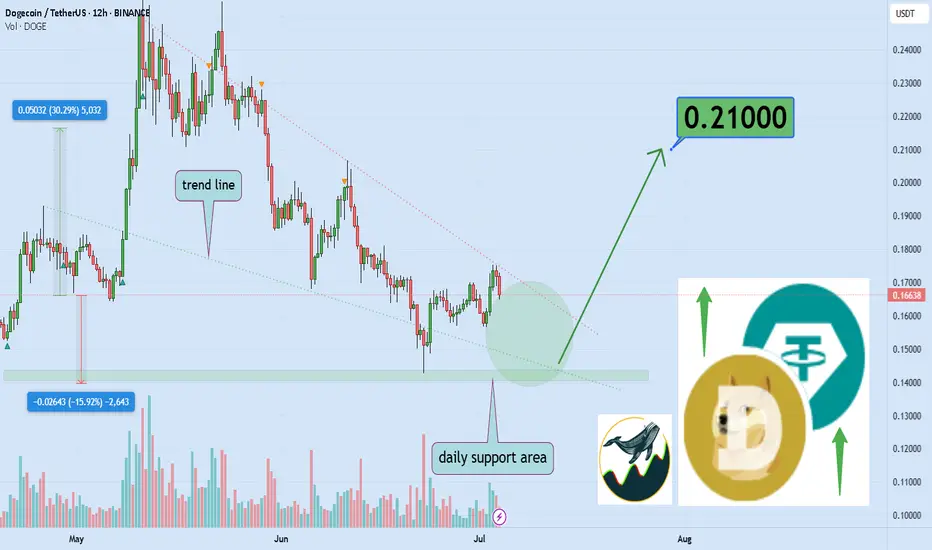
🎯 Analytical Insight on Dogecoin:
BINANCE:DOGEUSDT is currently forming a tight price structure, resembling a compressed spring just below a key daily resistance and trendline. A clean breakout above this area, supported by volume, could trigger a strong bullish continuation, with a projected upside of approximately 30 percent toward the 0.21 level. Traders should monitor this setup closely for confirmation before entering any positions. 📈🐶
Now , let's dive into the educational section,
💸 Trend Equals Triggering Your Greed
Trending coins don’t just pump prices; they pump emotions. One word: FOMO. Fear of missing out makes us ditch logic, ignore risk, and buy because it feels like everyone else is making money. That’s when the trap is set.
🧠 The Market Forgets, But You Shouldn’t
The crypto space is littered with the graves of hyped-up tokens. The cycle is always the same: quick pump, viral noise, massive retail entry, then a violent crash. The names may change, but the pattern doesn’t.
📊 Practical TradingView Tools to Spot Sketchy Trends
Before you click that “Buy” button just because something is trending, take a breath and open your charting tools. Here's a shortlist of powerful features you can use on TradingView that’ll help you filter out dangerous pump tokens:
Volume Profile: Shows where real smart money sits. If most volume spikes near the top, chances are whales are exiting.
RSI (14) : If RSI is above 70 and climbing with no pullback, odds are you're catching it too late.
Anchored VWAP: Anchor it at the start of the trend and see how far price has stretched from rational levels.
Stochastic RSI: Sharp crosses in overbought zones equal major risk signals.
Make it a habit to cross-check multiple timeframes with these tools. Blindly following trends without analysis? That’s how portfolios get burned.
🧪 Pre-Entry Checklist That Could Save You
If something feels “too hot to miss,” ask yourself:
Is the chart readable, or just a straight line up?
Are there healthy pullbacks or just blind momentum?
Is volume spiking only at the top?
Does the project show signs of organic market interest?
Do your TradingView tools confirm a smart entry?
Stick to this list, and you’ll avoid being just another exit-liquidity victim.
🕵️ Spotting Fake Pumps Before It’s Too Late
Here are the red flags no one talks about but every rug has them:
Massive vertical candles in low timeframes
Chaotic candlestick structures with no rhythm
Sharp volatility without any legit updates
Sudden spikes in follower hype and buzz
Real analysts don’t get excited when everyone else is; they start questioning why.
💥 Even Pro Traders Get Caught
Yes, even experienced traders can fall for a perfectly staged hype cycle. Why? Because human brains are wired to chase the crowd. That’s why having a pre-built system is critical. If you rely on gut feelings in a FOMO storm, you’re gambling.
✨ Need a little love!
We put so much love and time into bringing you useful content & your support truly keeps us going. don’t be shy—drop a comment below. We’d love to hear from you! 💛
Big thanks , Mad Whale 🐋
📜Please remember to do your own research before making any investment decisions. Also, don’t forget to check the disclaimer at the bottom of each post for more details.
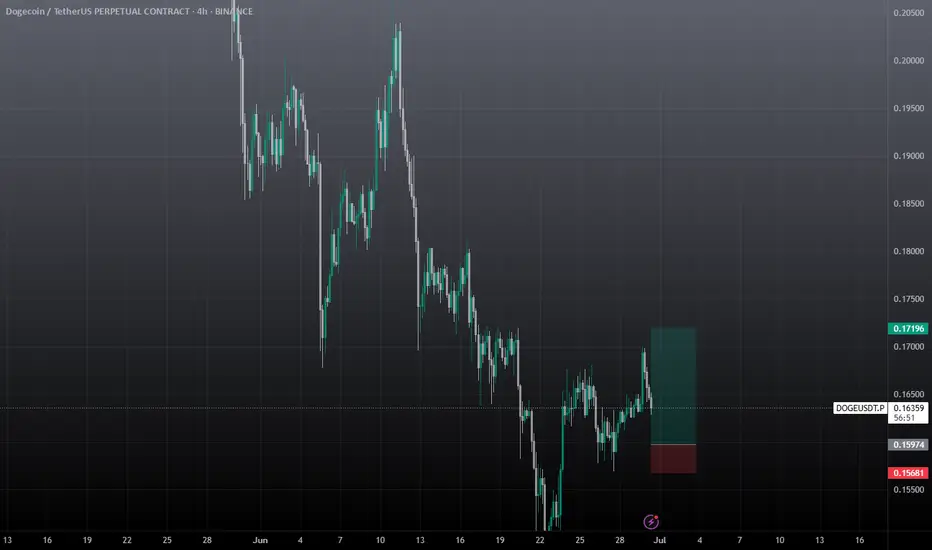
DOGEUSDT Buy Long SetupWait for entry, if the tp hits first, then ignore the trade, I will share new entry.
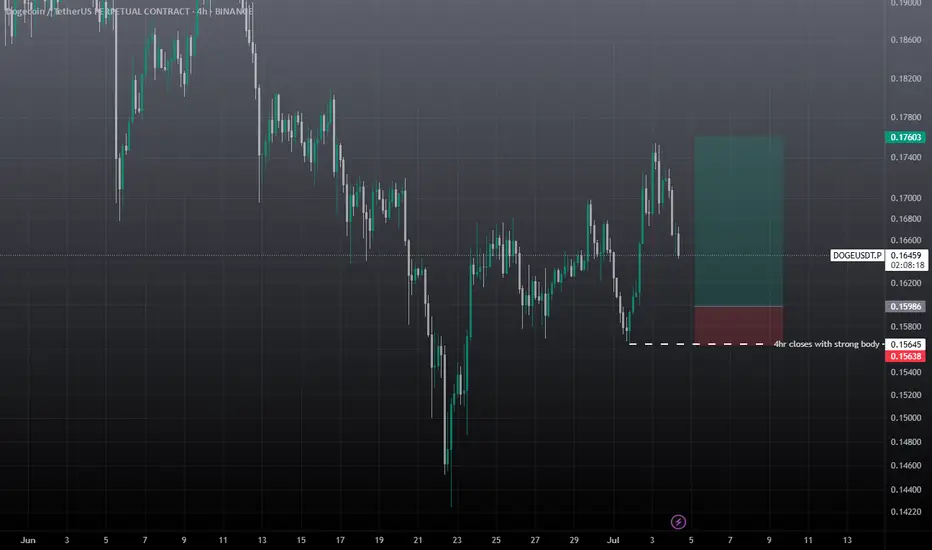
Doge Buy / Long SetupDoge has some Bullish Momentum, Invalidation if 4hrs closes below the mentioned point, then close on entry, otherwise wick doesn't matter. If tp achieved first then Cancel the trade.
DOGEUSDT last short before run shortDOGEUSDT last short before run short. Looks like classic head and shoulders with support at the bottom of target.
DOGE LONG- DIvergence price with stoch
- price at demand area
- BTC possible break out
- stoch W and M oversold
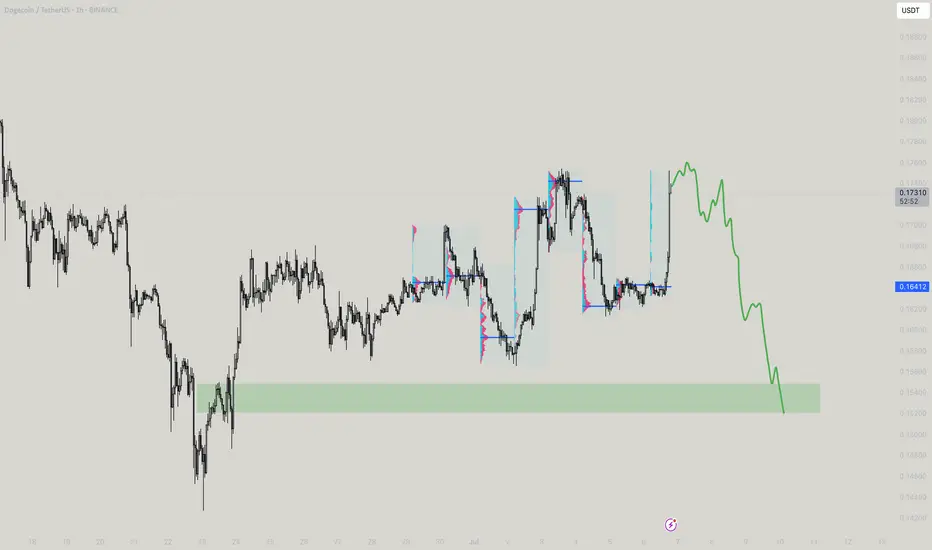
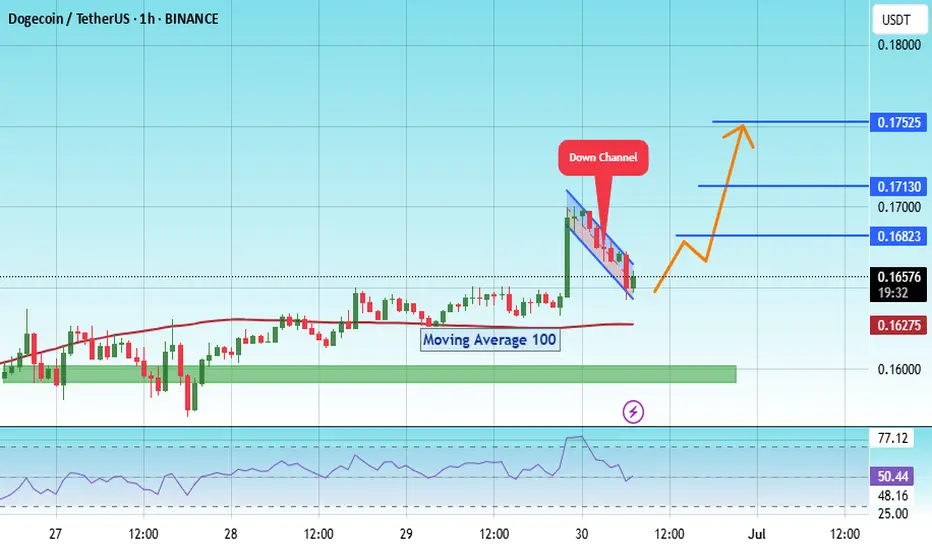
Dogecoin $0.1725 Next Target ? #DOGE
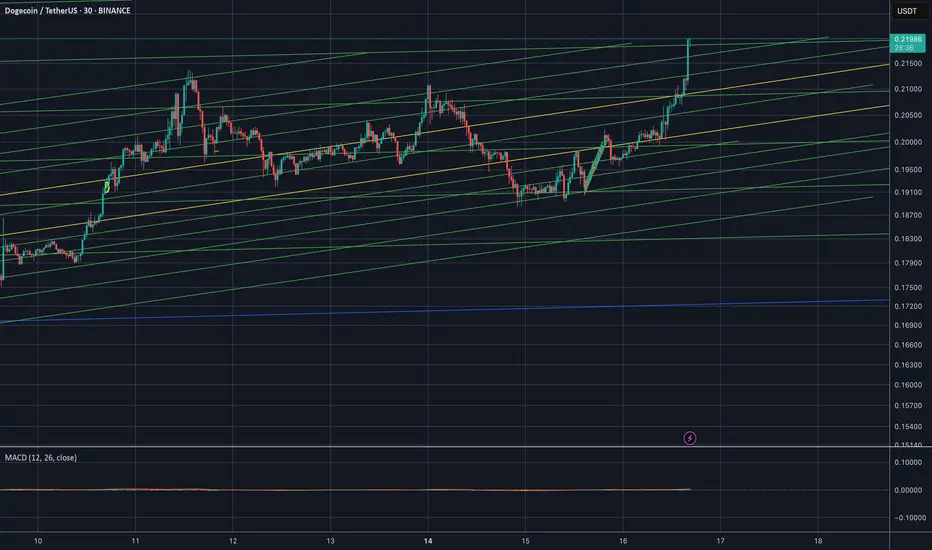
The price is moving within a descending channel on the 1-hour frame, adhering well to it, and is on its way to breaking it strongly upwards and retesting it.
We have a bounce from the lower boundary of the descending channel. This support is at 0.1624.
We have a downtrend on the RSI indicator that is about to break and retest, supporting the upside.
There is a major support area in green at 0.16000, which represents a strong basis for the upside.
Don't forget a simple thing: ease and capital.
When you reach the first target, save some money and then change your stop-loss order to an entry order.
For inquiries, please leave a comment.
We have a trend to hold above the 100 Moving Average.
Entry price: 0.1656
First target: 0.1682
Second target: 0.1713
Third target: 0.1752
Don't forget a simple thing: ease and capital.
When you reach the first target, save some money and then change your stop-loss order to an entry order.
For inquiries, please leave a comment.
Thank you.
DOGE Short Term pullback prior to breaking trendI am bearish on Dogecoin for the next 10 days or so, but overall bullish to break the downward trend for months now.
Waiting for a break above the longterm downward then a retest would be the safest play. A more aggresive approach may be to put some orders in at the recent support levels with a stop loss near the recent lows.
Doge is a popular token and meme that has a large following. I think there are many long term holders than any other meme.
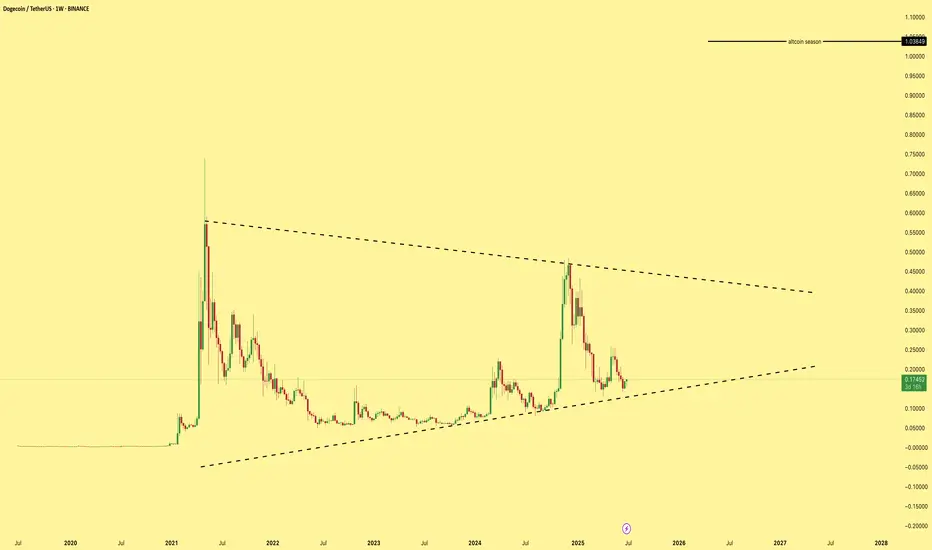
DOGE/USDTCRYPTOCAP:DOGE can easily pump to $1. Measuring the range inside the triangle points to a potential 550% gain from the current price. CRYPTOCAP:DOGE is also a strong indicator for altcoin season. Do not fade the Elon Musk coin.
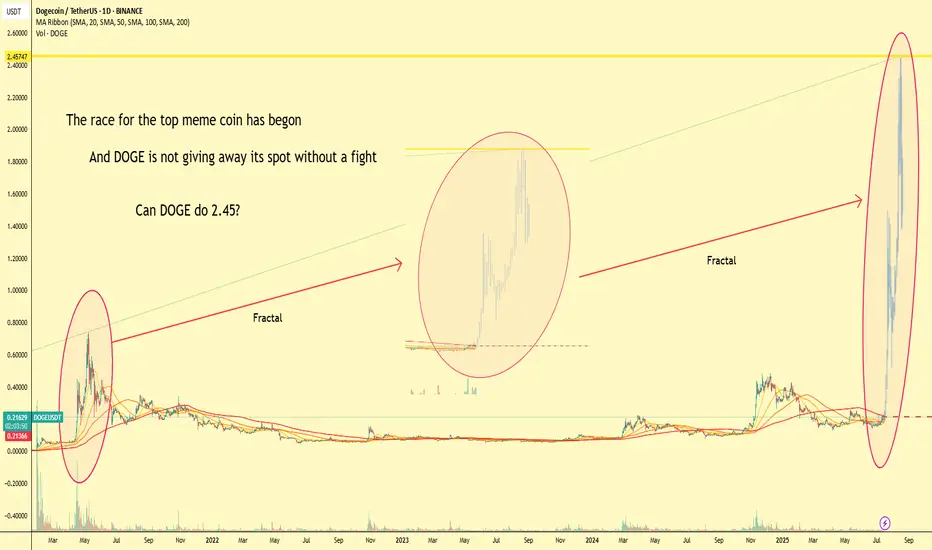
The Meme Coin Race Has Begun, DOGE fighting for top spot!📈 The Meme Coin Race Has Begun
🔥 The battle for the throne is heating up...
🐶 DOGE, the original meme coin, isn’t giving up its crown without a fight.
Fractals from the past seem to echo in today's chart – history doesn’t repeat, but it rhymes.
⚔️ With new challengers lining up in the meme arena, one question remains:
Can DOGE reach $2.45 and reclaim the top spot?
🚀 Volume is rising. Patterns are aligning.
The king is awake.
👑 The OG vs the New School. Who will win the meme war?
Comment your prediction 👇
#DOGE #MemeSeason #CryptoFractals #Altseason #DOGEUSDT #CryptoTrading #TradingView #FractalAnalysis #CryptoWar #MemeCoins
yesascending nicely through the top of the range. Critical resistance at 24 cents. Next is 32 cents.
Dogeusdt bullish iH&S/cup&handle pattern in daily tfForming a bullish pattern and a close above 0.206 in daily time frame may activate the pattern.
Targets are 0.225, 0.255 and 0.29
Invalidation below 0.1886

DOGE Short SetupTight SL, 1:3 Risk-Reward.
We might go higher, but current key levels and price actions tells me to go short setup.