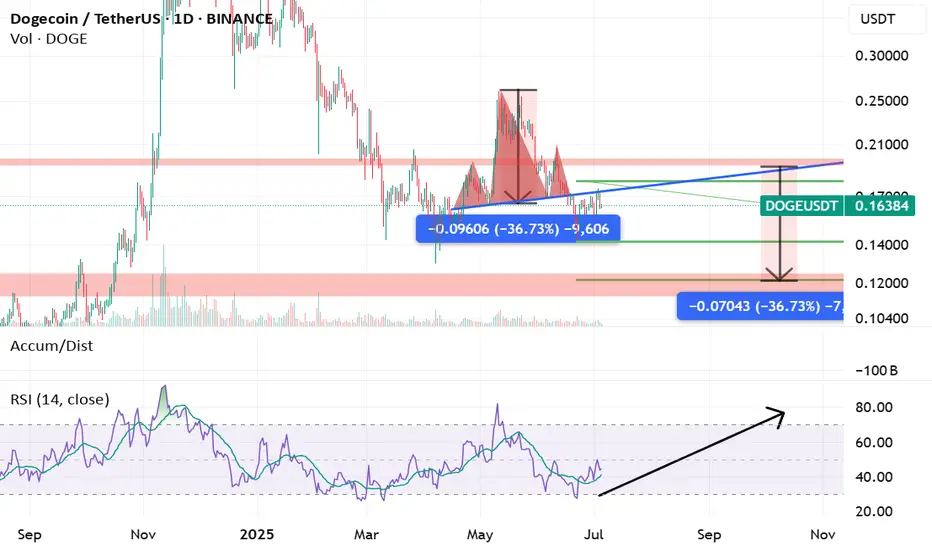
DOGEUSDT last short before run shortDOGEUSDT last short before run short. Looks like classic head and shoulders with support at the bottom of target.
DOGEUST trade ideas
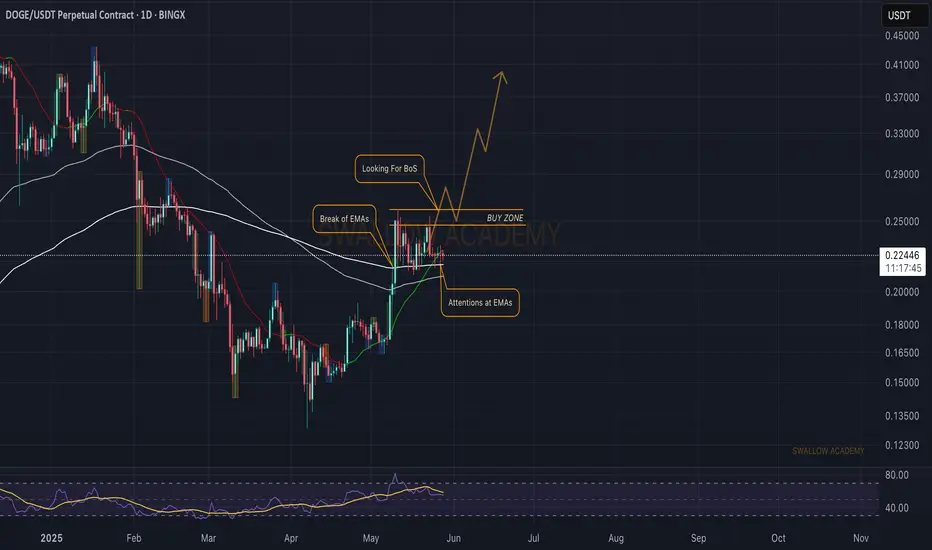
Dogecoin (DOGE): Keeping Eye on 200EMA | Looking For BounceDogecoin is still hovering above the 200EMA, where we see some kind of weakness but the price still remains above the line so we are keeping our bullish game plan still active.
We are looking for a bounce on daily timeframe from 200EMA where we will be looking at $0.25 for a proper breakout, which then would send the price as high as $0.37
Swallow Academy
DOGE/USDT Breakout Theft Plan| Smart Entry + Exit| Bullish Bias🐶💰 DOGE/USDT Master Heist Plan – The Bullish Breakout Robbery! 💸🔓
(Thief Trading Style – Steal Profits, Not Dreams)
🌟Hello, Hola, Ola, Bonjour, Hallo, Marhaba!🌟
To all the fearless Market Movers & Silent Operators out there – welcome to another strategic DOGE raid guided by technical precision and macro-level insight! 📈🧠
🔐 The Game Plan – Let’s Break the Bank!
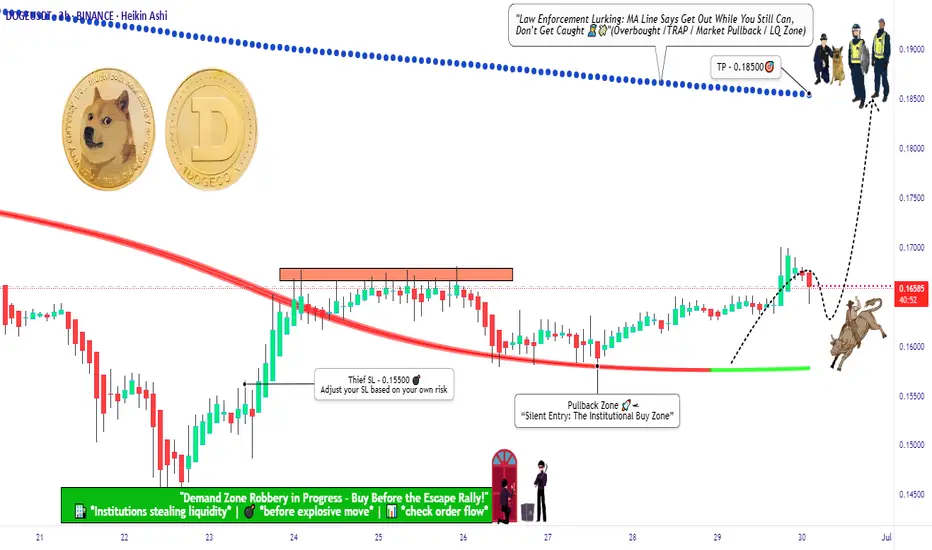
This chart outlines our long-entry mission for DOGE/USDT, based on a unique Thief Trading Style strategy. The market currently shows bullish momentum, setting the stage for an upside breakout—but not without traps! Stay sharp.
💥 Key Concepts at Play:
Pullback Zones = Entry Points (Mark the lows, grab the loot)
ATR Line Zone = High-Risk Area (Time to plan your exit)
Reversal & Consolidation Zones = Watch for fakes & traps
News Events = Potential market detonators – keep your stop-loss close
📍Entry Point – "The Vault’s Open!"
💰 Plan A: Instant execution for those already prepped.
📉 Plan B: Place Buy Limit Orders near recent 15–30 min swing lows for a stealthier entry during pullbacks.
🚨Stop-Loss Setup – Safety First, Always
📍 Recommended SL: Near the 2H swing low (around 0.15500)
🛡️ Adjust based on your personal risk, account size, and trade volume. Thieves plan smart—never go in blind.
🎯Target – Clean the House and Vanish
🎯 Primary Target: 0.18500
⚠️ Exit early if market conditions shift. The first rule of the game? Don’t get greedy.
⚡Scalpers’ Mode – Hit & Run
Only trade LONG setups. Whether you’re a heavy hitter or playing it safe, stick with the bulls. Use trailing SL to protect the bag.
📊Why This Heist Works – Under the Hood
The DOGE/USDT setup is driven by:
✅ Bullish sentiment
✅ Fundamental trends
✅ Macro drivers
✅ On-chain activity & intermarket signals
✅ COT Reports & future momentum indicators
(For full breakdown, check linkkied data 👉🔗🔍)
📡News & Risk Management Reminder
🚫 Avoid opening fresh trades during high-volatility news events.
📉 Always trail your stop to secure profits during live positions.
Adapt fast – the market changes in a blink.
❤️Support The Plan
💥 Smash the Boost button to help spread the Thief Trading Style across the platform! Let’s make smart money together, one chart at a time. Every like, comment, and follow powers the next move. 💪💵🚀
🔔 More Heist Plans Coming Soon – Stay connected, stay dangerous... and stay profitable.
🐱👤Until then – Trade Smart. Trade Thief. Make Your Mark. 💸
DOGECOIN Eyes Major Breakout – Trend Channel in Controlhello guys!
doge seems potential now!
DOGECOIN has successfully broken out of a long-standing bearish trendline and is now respecting a well defined ascending channel structure.
After a clean retest of both the midline and the demand block around 0.1950–0.2150, the price is showing renewed bullish pressure. As long as price holds above this key support zone, we can expect further continuation to the upside.
what I see:
✅ Breakout of descending trendline confirmed
✅ Strong structure support from the demand block (0.1950–0.2150)
✅ Clean reaction from channel midline
✅ Momentum currently favors continuation of the bullish trend
🎯 Bullish Targets:
TP1: 0.2530 (recent swing high)
TP2: 0.2750 (channel upper boundary)
TP3: 0.3035 (major horizontal resistance zone)
🛑 Stop-loss idea: Below 0.1950 (invalidates bullish structure)

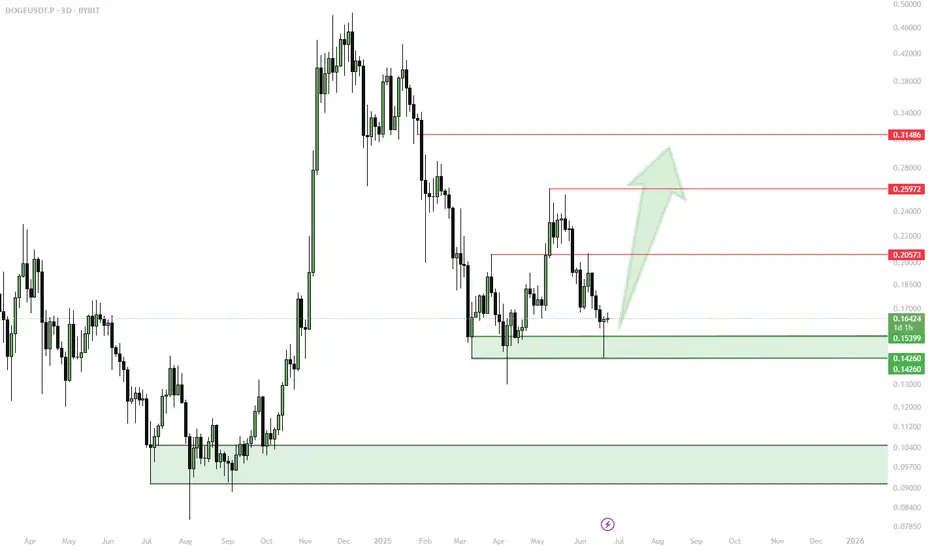
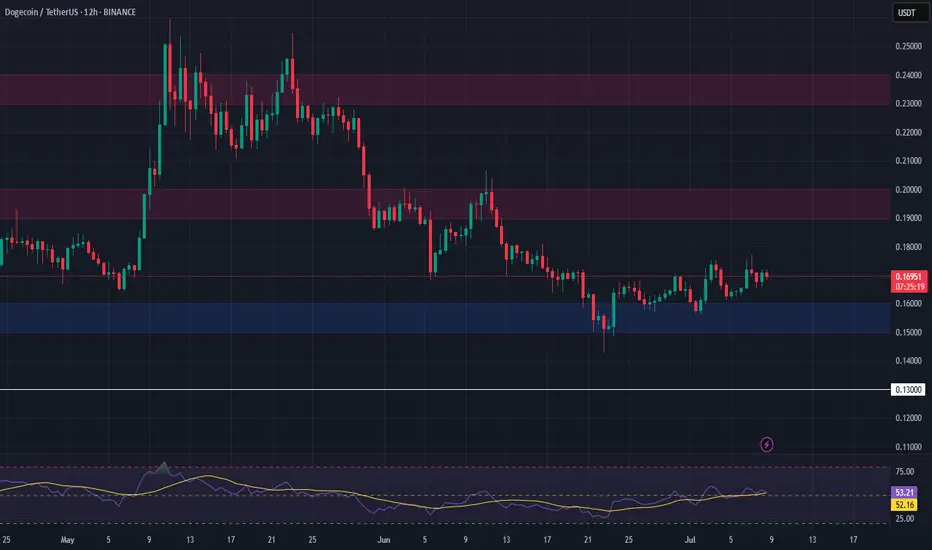
DOGE/USDT Rebound from Key Demand Zone! Bullish Rally Incoming?
🔍 Technical Analysis Overview:
1. Strong Demand Zone (Support Area):
DOGE has just bounced off a strong demand zone around $0.15000 – $0.16318, which previously acted as a significant accumulation area (highlighted in yellow). This signals a potential trend reversal from bearish to bullish.
2. Bullish Bounce Confirmation:
Price action is forming a potential "higher low" in this support area, indicating the early signs of a bullish structure.
3. Key Resistance/Target Levels: If momentum continues, DOGE could target the following resistance zones:
📍 $0.19637 – Initial minor resistance.
📍 $0.21000 – Previous consolidation area.
📍 $0.24911 – $0.31170 – Mid-term targets.
📍 $0.41583 – $0.48432 – Major resistance zone for long-term rally.
4. Short to Mid-Term Outlook:
The price is showing signs of a potential "V-shaped recovery." The yellow arrow suggests possible minor pullbacks before a continued bullish move toward higher resistance zones.
💡 Potential Strategy:
Entry: Look for re-entry opportunities on a retest of the $0.16 – $0.18 zone with bullish candle confirmation.
Stop Loss: Below $0.15000 (key invalidation level).
Take Profits: $0.196 – $0.249 – $0.311 – $0.415 (ladder out positions).
🚀 Conclusion:
DOGE is currently in an exciting technical setup, rebounding from a major demand zone with a strong potential for a bullish trend reversal. If volume supports and broader crypto sentiment improves, a strong upside rally could be in play in the coming weeks.
#DOGE #Dogecoin #DOGEUSDT #CryptoAnalysis #TechnicalAnalysis #Altcoins #CryptoTrading #Breakout #SupportAndResistance #BullishReversal

DOGEUSDT: Time For Bulls To Rule! The Dogecoin is currently trading at a key buying level, making it a potential opportunity to buy. However, we need confirmation before making a purchase or entering a trade. This trade could take time to develop as we are currently in the accumulating phase. To be certain of the price direction, we need to enter the distribution phase. While a single swing trade could be a target, you can set your own risk management parameters.
Good luck and trade safely!
Team Setupsfx_
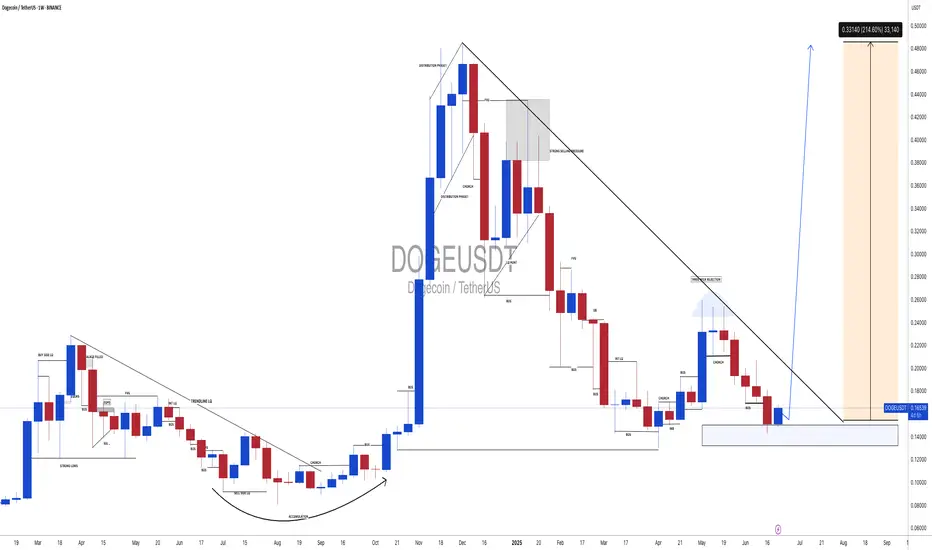
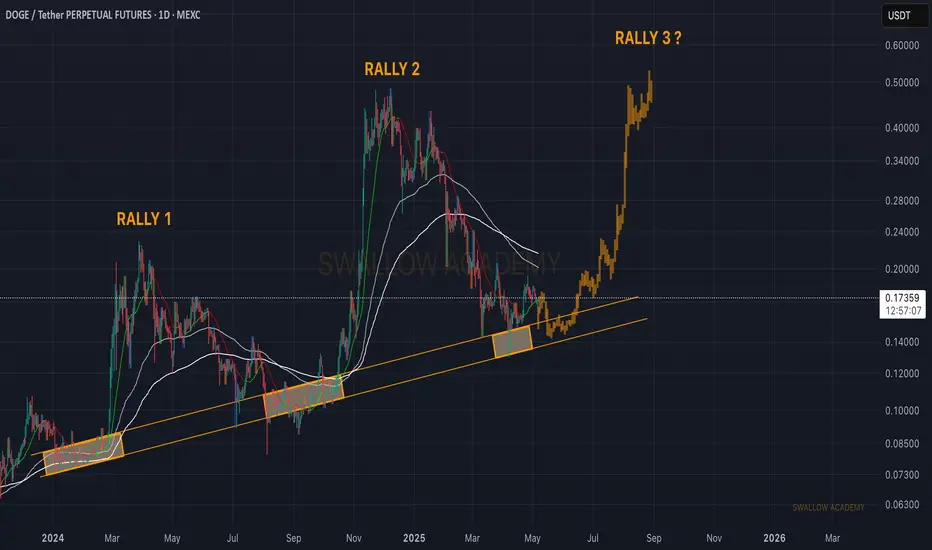
Dogecoin (DOGE): Getting Ready For Rally 3 | Possible Good BuyWe decided to take a broader look at Dogecoin, where we are seeing a price at a supportive trend, which might send the price to a very fast and quick upward movement, which could give us 200% market price movement from here.
We are going to keep this kind of game gameplan as long as we are above or inside our bullish trend line here.
Swallow Academy
DOGE Forming a Bottom — Risk/Reward Favor Bulls✅ DOGE looks “forgotten” — minimal interest, low volume, no panic selling
✅ Bottoming structure forming; bounce from key support, retest of lows possible
✅ Accumulation only via spot limit orders in green zones; avoid market buys
⚠️ No expectations of breaking ATH, targets capped at $0.31–0.38
1. Bullish Scenario (~55%)
Retest of support zones ($0.143–0.16), spot accumulation
Trigger: Bounce on volume, reclaim of previous quarterly levels
Partial profit: $0.25; main targets: $0.31–0.38
2. Sideways Scenario (~35%)
Consolidation between $0.14–0.18, low volume, slow accumulation
Work the range: accumulate at lows, trim on spikes, patience
3. Bearish Scenario (~10%)
Break below $0.14 with no demand, deeper altcoin market correction
Stop loss on close under $0.14, wait for new supports — no averaging down without buy signals
📝 Order Management & Recommendations:
Place spot limit orders only in $0.143–0.16 and lower green zones
No market FOMO entries
First take-profit: $0.25; main TP: $0.31–0.38
Hard stop/loss under $0.14; no holding through breakdowns
DogeIt broke out on all TF. If nothing bad happens in the news I think it's goin to be profitable 😁😁

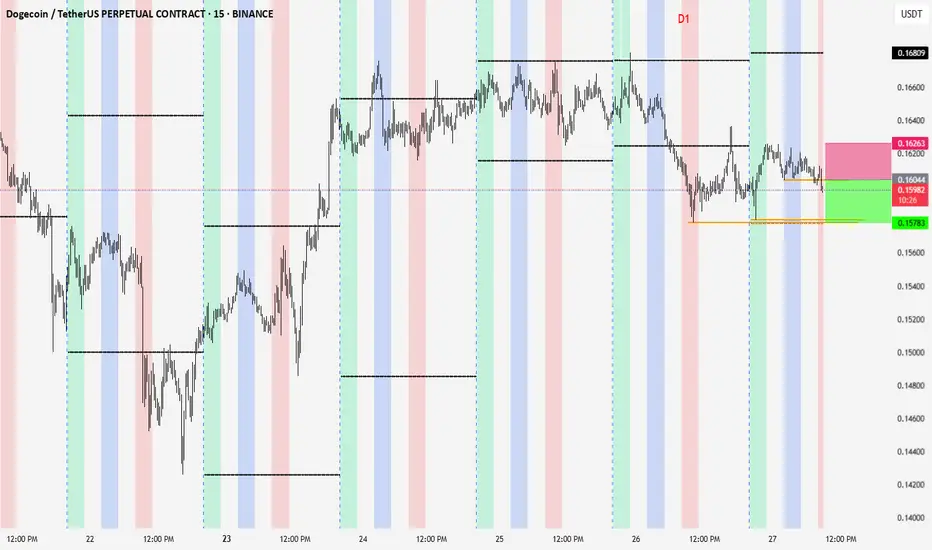
Buy setup by TiqGPT Analyzing the provided charts for Dogecoin/TetherUS across multiple timeframes, we observe a consistent pattern of consolidation and minor fluctuations within a defined range. The 1D chart shows a downtrend with recent attempts at recovery, marked by small bullish candles. The 4H and 1H charts indicate a ranging market with price oscillating around the 0.1635 to 0.1650 levels, suggesting a lack of strong directional momentum.
The 15M, 5M, and 1M charts further detail this consolidation, with price making higher lows and lower highs, indicative of a compression in volatility and potential preparation for a breakout. The repeated tests of the 0.1635 level across lower timeframes suggest it's a significant area of short-term support.
INSTITUTIONAL THESIS:
Institutions may be in a phase of accumulation within this range, using the lack of clear directional momentum to quietly build positions. The repeated support tests and tight consolidation indicate preparation for a potential upward move, as institutions capitalize on the compressed volatility to trigger a breakout.
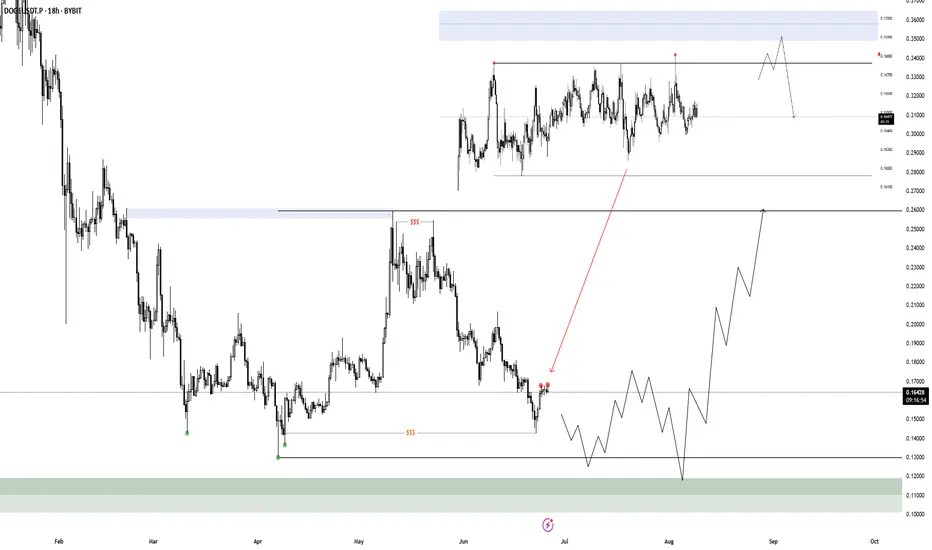
DOGE AccumulationI haven't made a post about Doge in a while. This seems like a good area to find a bottom, at least for a while. There was already an accumulation model 2 in April, but it seems like that was just intended to create a larger range to then accumulate on a bigger scale. Something like that would be a perfect scenario, but only time will tell.
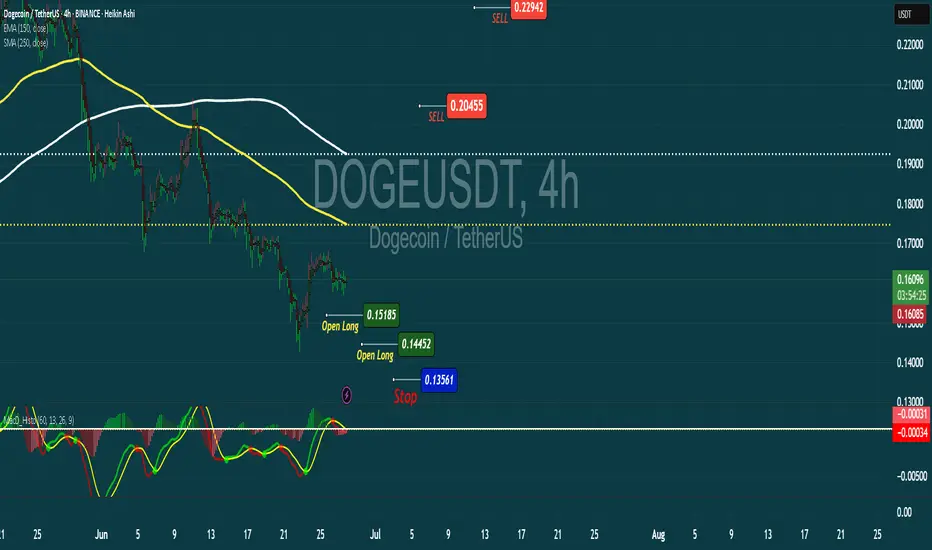
Complete Analysis of DOGE/USDT 4hComplete Analysis of DOGE/USDT 4h
The chart suggests a transition phase toward an uptrend.
Moving averages are beginning to slope upward, indicating a potential trend reversal. The MACD shows weakening selling pressure and is approaching a bullish crossover, which often precedes upward price movement.
Entry zones: Between 0.14452 and 0.15185 — favorable areas for position accumulation.
Price targets:
First target: 0.20455 (a key resistance zone).
Second target: 0.22942, where stronger selling pressure may emerge.
Risk management: A suggested stop-loss at 0.13561 to protect capital if the anticipated move fails.
If the price breaks and consolidates above 0.17, the market could gain momentum to reach the projected targets. Monitor volume during breakout candles to confirm the presence of buying flow.
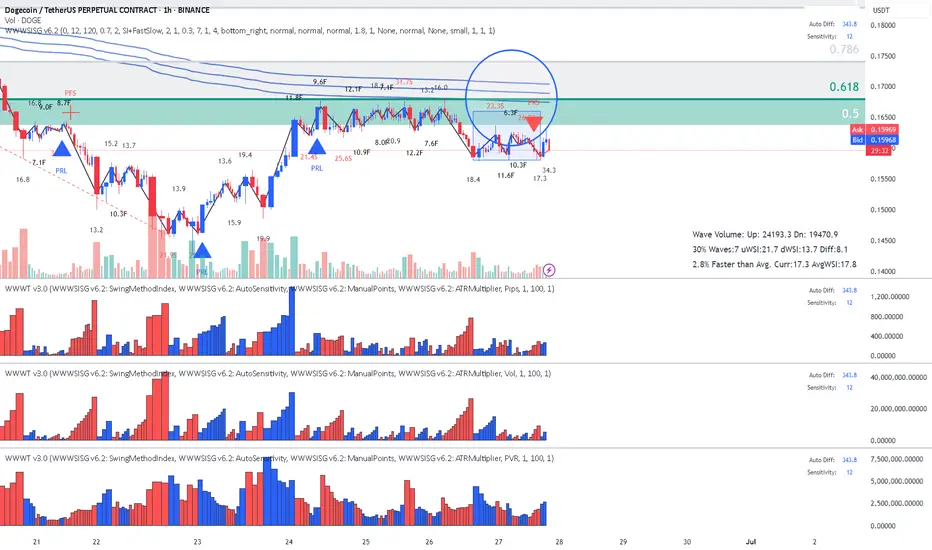
DodgeCoin - Speed Index is telling me ShortReading the chart
1.Location: Fib + touch AVWAP low
2. Speed Index numbers at top on the High side (red numbers) which means Hard to Move Up.
3. PRS Short signal
4. If we do not get stuck into range and break it downwards , it's Short!
Enjoy! Reading the chart with Speed Index!
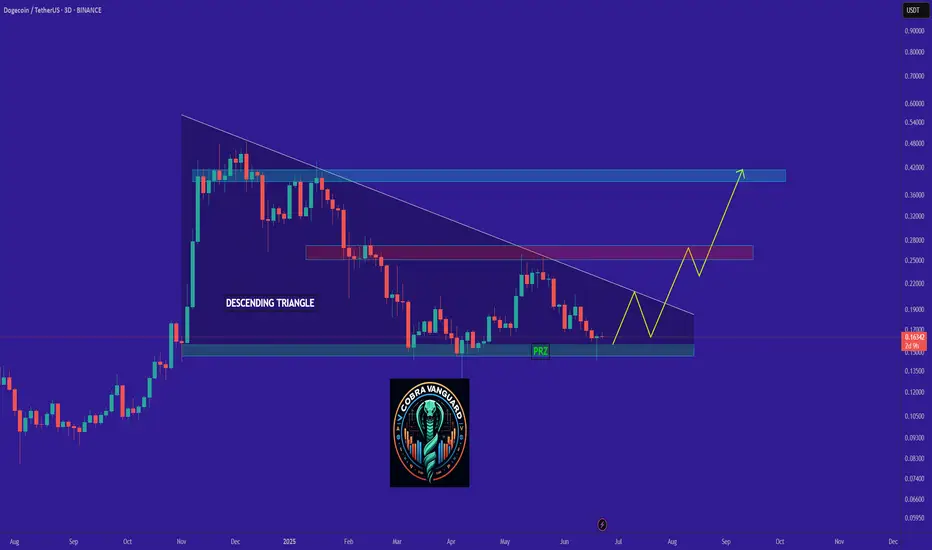
It's disappointing !!!Do you think this will happen, or do you see DOGE below $0.14 in the future?
Best regards CobraVanguard.💚
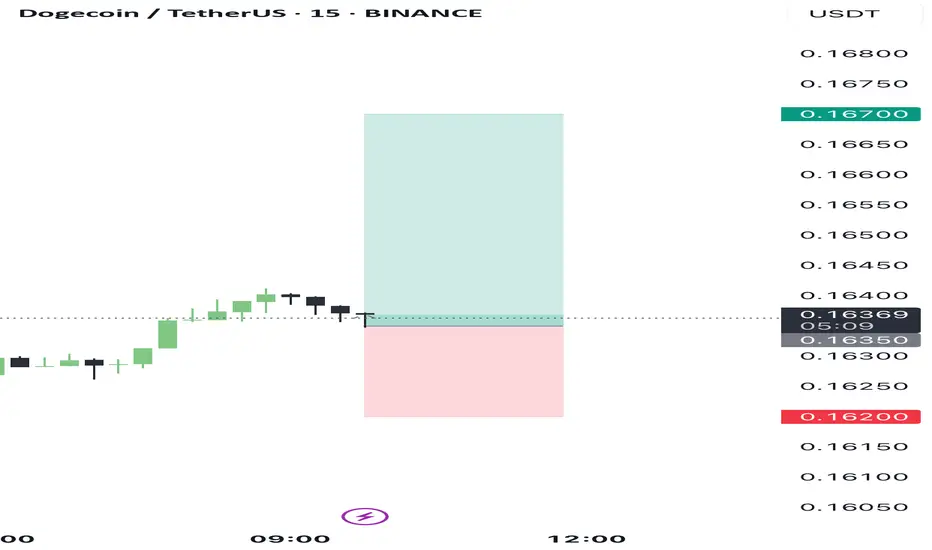
Long trade
📍 Pair: DOGEUSDT
📅 Date: Tuesday, June 24th, 2025
📈 Direction: Buyside
TIME: 2.45 PM (NY time)
NY Session PM
📊 Trade Breakdown:
Metric
Entry Price 0.16375
Profit Level 0.16581 (+1.26%)
Stop Loss 0.16337 (−0.23%)
Risk-Reward
Ratio 5.42: 1
🧠 Context / Trade Notes – ICT Inversion FVG Model
Fair Value Gap (FVG): The trade was executed based on ICT’s Inversion FVG model, where a previously bearish FVG was broken to the upside and then revisited as a bullish support zone.
🔍 Liquidity Sweep + Displacement:
Price swept a short-term sell-side low, triggering stops before sharply displacing upward, forming a bullish break in market structure and the FVG.
1min TF Entry
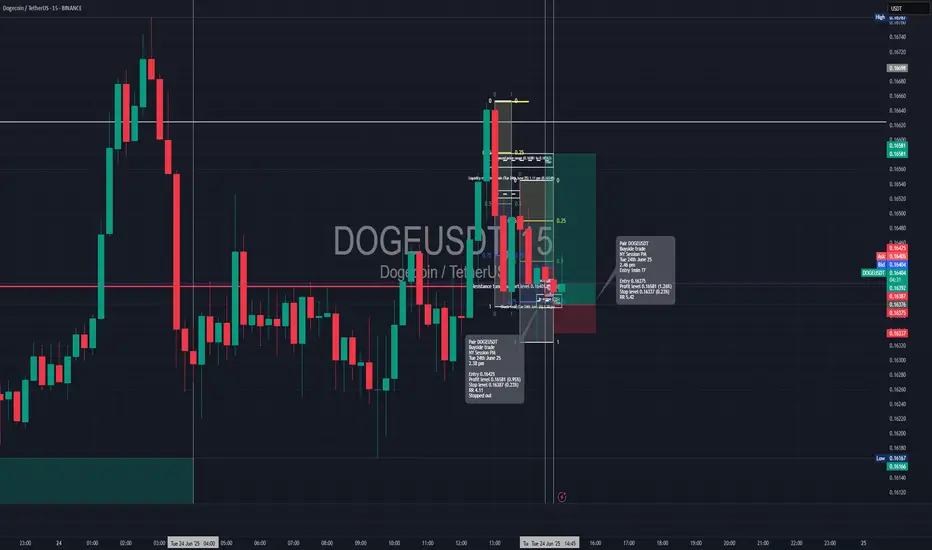
Long trade
🟢 Trade Journal Entry – Buyside Trade
📍 Pair: DOGEUSDT
📅 Date: Monday, June 23, 2025
🕒 Time: 11:00 AM (NY Session AM)
⏱ Time Frame: 4 Hour
📈 Direction: Buyside
📊 Trade Breakdown:
Metric Value
Entry Price 0.15395
Profit Level 0.17081 (+10.95%)
Stop Loss 0.14844 (−3.58%)
Risk-Reward
Ratio 3.06 : 1
🧠 Context / Trade Notes:
4H Order Block Execution:
Entry triggered at the retest of a 4-hour bullish order block following price rejection and a bullish engulfing structure.

DOGE Long Swing Setup – Musk-Fueled Hype & Political BuzzElon Musk’s launch of the “America Party” is reigniting interest in his potential impact on crypto—especially Dogecoin. With his history of moving DOGE’s price, this political pivot could stir volatility and renewed upside. We’re watching for a dip into the $0.15–$0.16 zone for a possible long entry.
📌 Trade Setup:
• Entry Zone: $0.15 – $0.16
• Take Profit Targets:
o 🥇 $0.19 - $0.20
o 🥈 $0.23 – $0.24
• Stop Loss: Daily close below $0.13
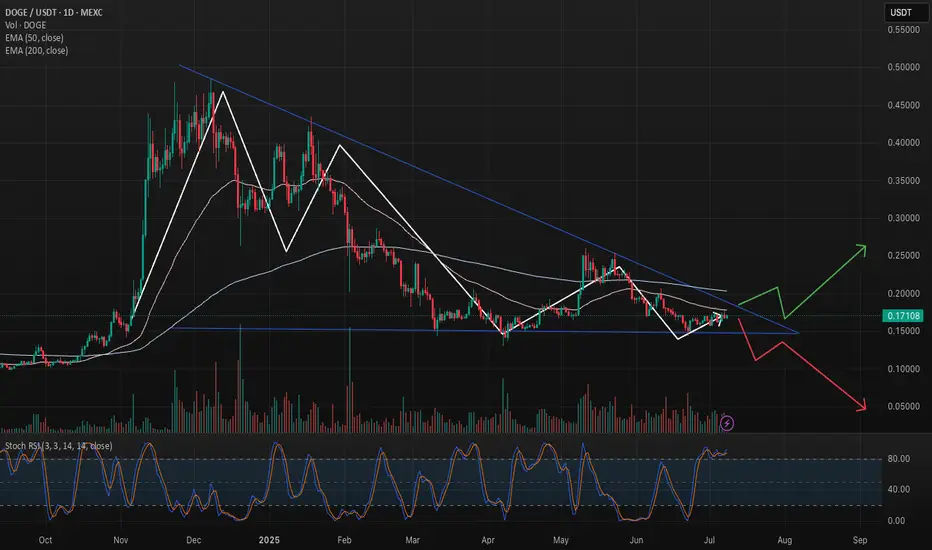
DOGE Presses Into Long-Term Trendline — Breakout or Breakdown?DOGE is approaching a multi-month descending trendline with rising volume and an overbought stochastic RSI. Price is coiling in a tight triangle just below both the 50 and 200 EMA — a major move is on deck.
🟢 Scenario 1 – Bullish:
Break above $0.18 and reclaim of the 200 EMA ($0.20) could launch DOGE toward $0.25+. A confirmed flip of the trendline would mark a major sentiment shift.
🔴 Scenario 2 – Bearish:
A rejection here and break below $0.16 could lead to a steep drop toward $0.12 or lower. The red path shows a return to the broader downtrend if bulls fail to step in.
⚠️ Stoch RSI is at extreme levels — suggesting the next move may come soon.
friday backside of the week, continues the reversal thursday was first red day and a false break after 4 days of breakout. hopefully it is quick. not going to move anything after this, let it play out, no more mistakes
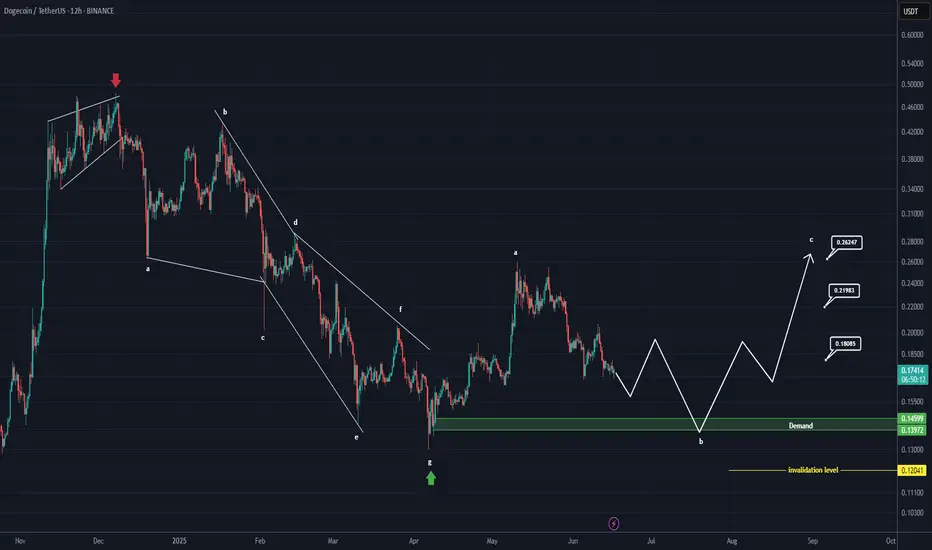
DOGE ANALYSIS (12H)Based on the current available data, it appears that Dogecoin has entered a bullish phase after completing the diametric pattern marked on the chart. We are currently in wave B of this bullish phase.
Wave B may complete within the green zone, which is a key support area.
The targets for wave C have been marked on the chart.
A daily candle closing below the invalidation level would negate this outlook.
For risk management, please don't forget stop loss and capital management
Comment if you have any questions
Thank You
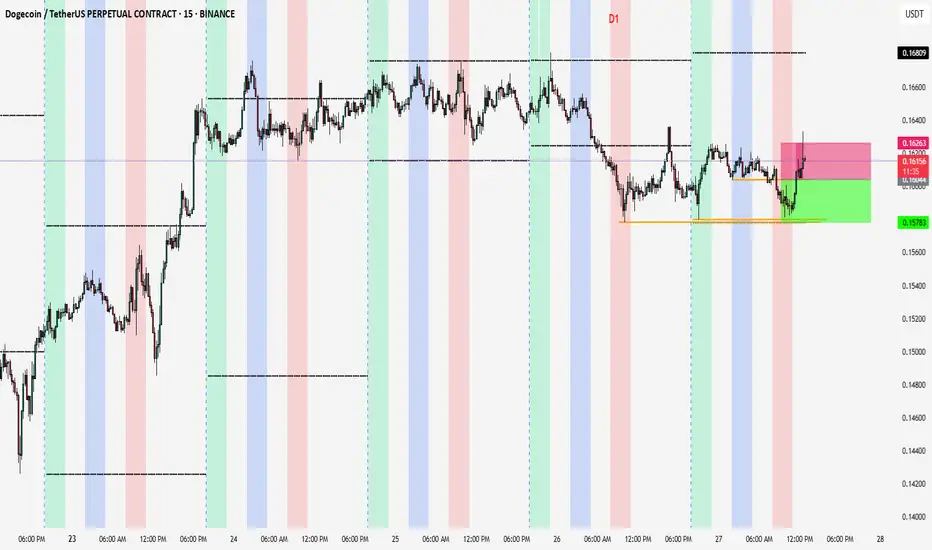
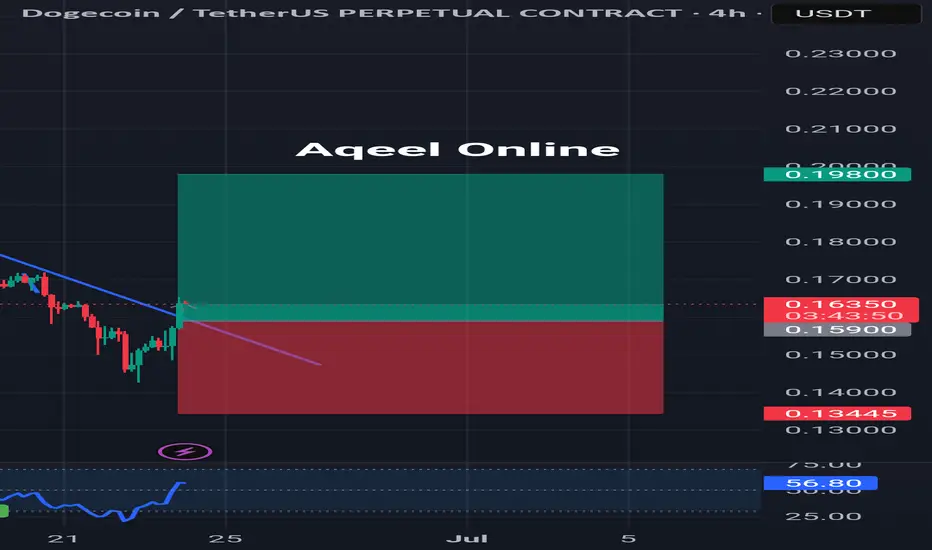
Doge Long SetupDoge has successfully changed it's downtrend to uptrend with heavy volume, Waiting for a potential retest at 0.1590 area then we are good to go towards our MASSIVE target in the coming days.
DOGE Free Call
Longing Now: 0.1590 - 0.1640
Tp: 0.1980
Sl: 0.13445
It will take few days to fully play out.
Do your own research before taking any entry.
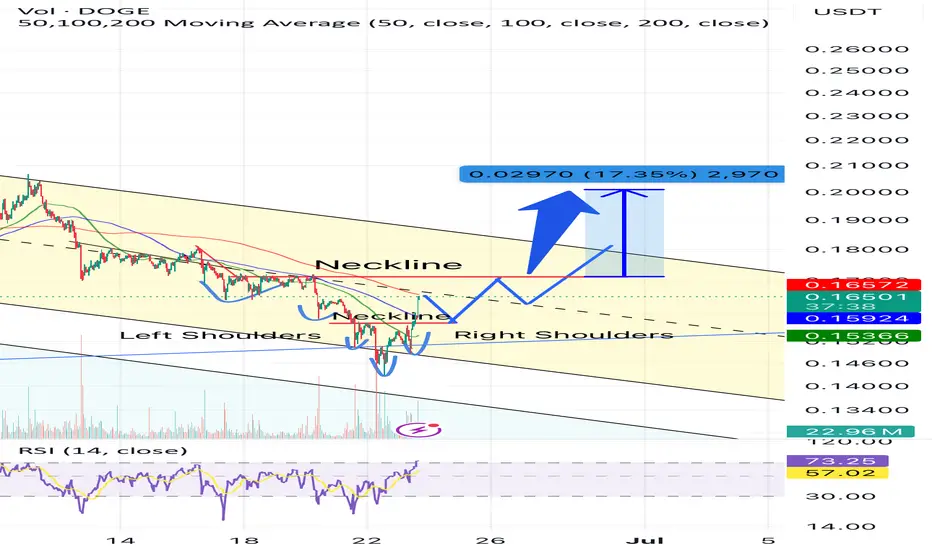
A huge reversal for DOGE!#DOGE finally found the bottom and currently forming bullish inverse head and shoulder pattern. It may continue to form a multiple bigger inverse head and shoulder pattern as it bounces up.
A short term price target appears to be around $0.20 if these patterns materialize.