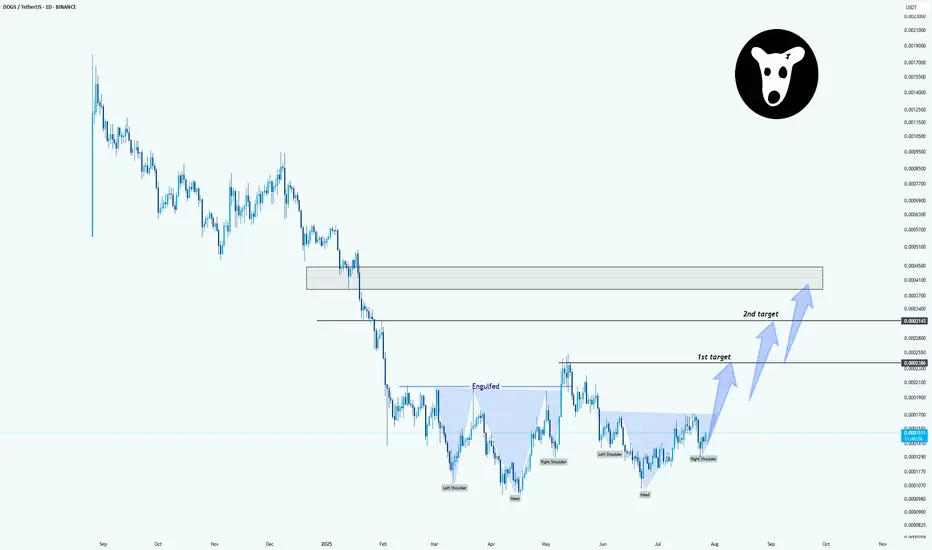
DOGSUSDT: Inverse Head & Shoulders Pattern in PlayHello.
The chart clearly shows an inverse head and shoulders formation. Price has now formed:
Left Shoulder
Head
Right Shoulder (recently completed)
The neckline was engulfed after a strong move, which adds confidence to the breakout potential. If the price continues to hold above the right shoul
Related pairs
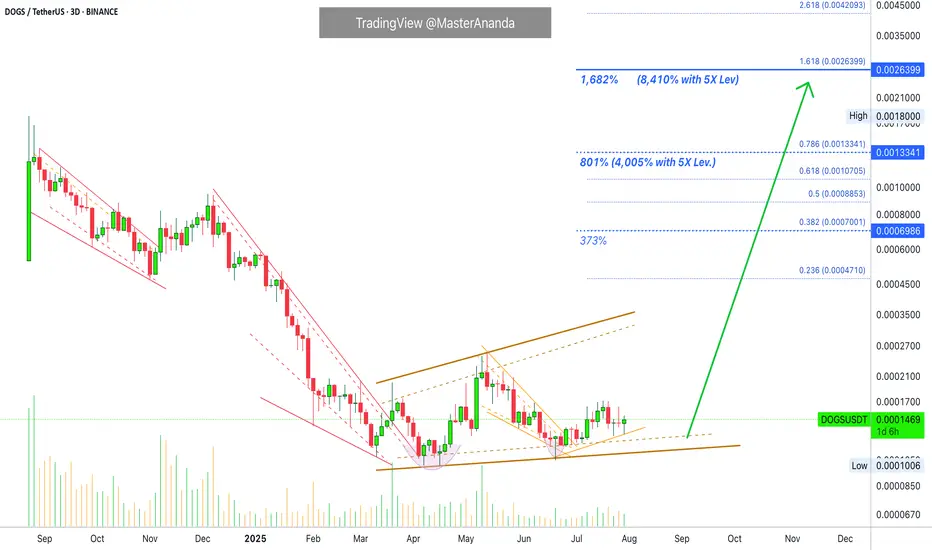
Dogs 5X Leveraged Trade-Setup (8,410% Profits Potential)Dogs continues to consolidation at bottom prices producing higher lows. With each passing day/session and candle, DOGSUSDT gets closer and closer to a strong bullish breakout. If you remember recently this pair produced for us more than 800% profits with 7X, the entire move was about 150% strong, be
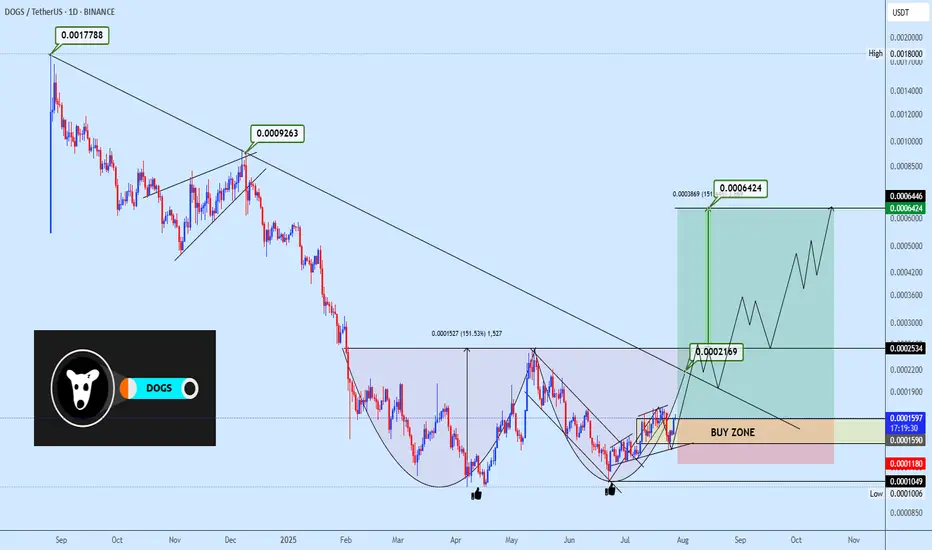
Dogsusdt double bottom formationDOGSUSDT is exhibiting a micro double bottom formation, with price rebounding from a previous support zone. The strategy is to accumulate within the highlighted area and monitor the neckline reaction around 0.0002534. A breakout above this level would validate the entire double bottom structure and
#DOGS/USDT#DOGS
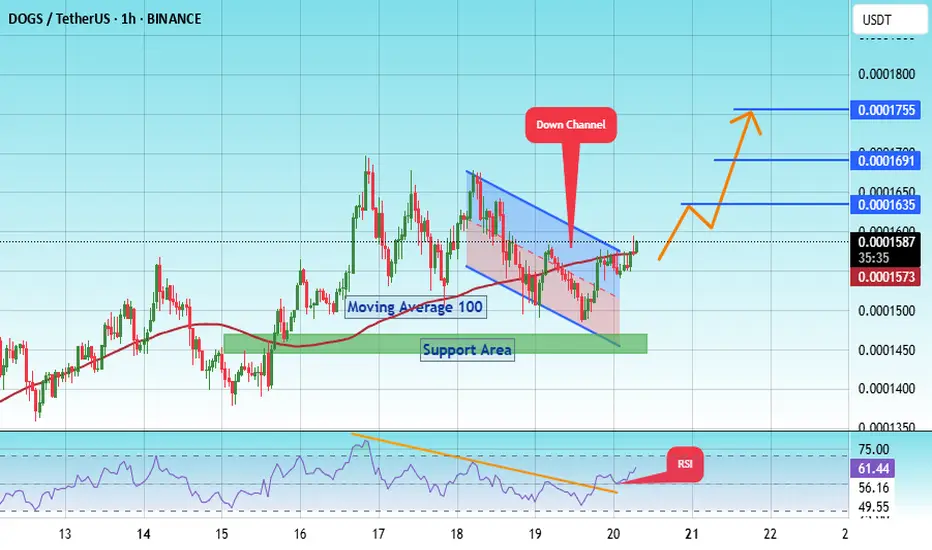
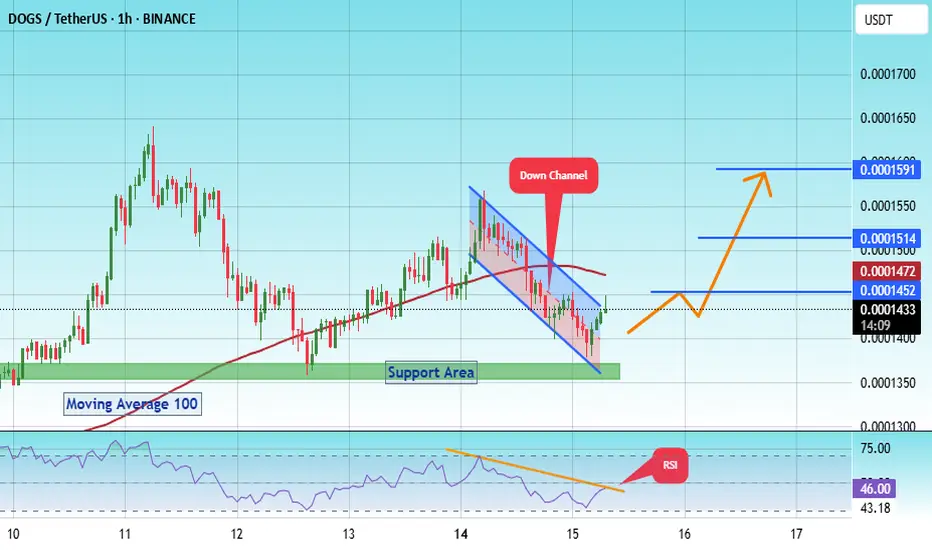
The price is moving within a descending channel on the 1-hour frame, adhering well to it, and is poised to break it strongly upwards and retest it.
We have support from the lower boundary of the descending channel, at 0.0001432.
We have a downtrend on the RSI indicator that is about to break

$DOGS Bite???How sweet of a trade here on BYBIT:DOGSUSDT.P 🤩🤩🤩
Running as fast. who released the SEED_ALEXDRAYM_SHORTINTEREST1:DOGS ?
I'm not chasing them, they should run their fastest.
Sipping my juice🥤
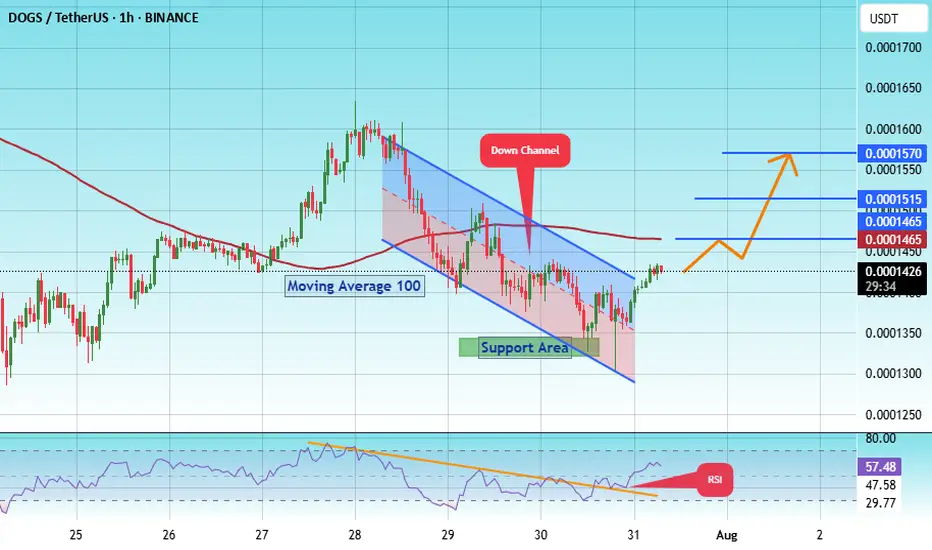
#DOGS/USDT#DOGS
The price is moving within a descending channel on the 1-hour frame, adhering well to it, and is poised to break it strongly upwards and retest it.
We have support from the lower boundary of the descending channel, at 0.0001485.
We have a downtrend on the RSI indicator that is about to break
#DOGS/USDT – Launchpad or Breakdown?#DOGS
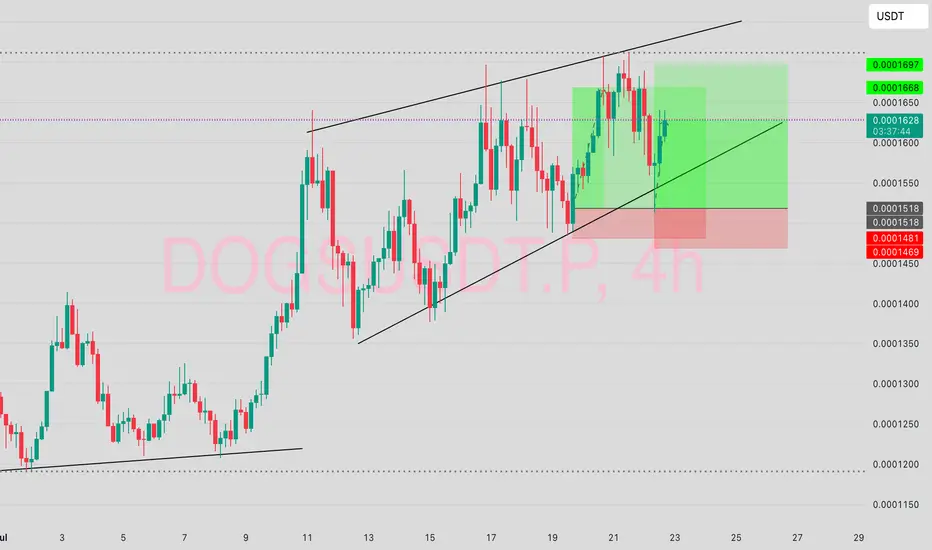
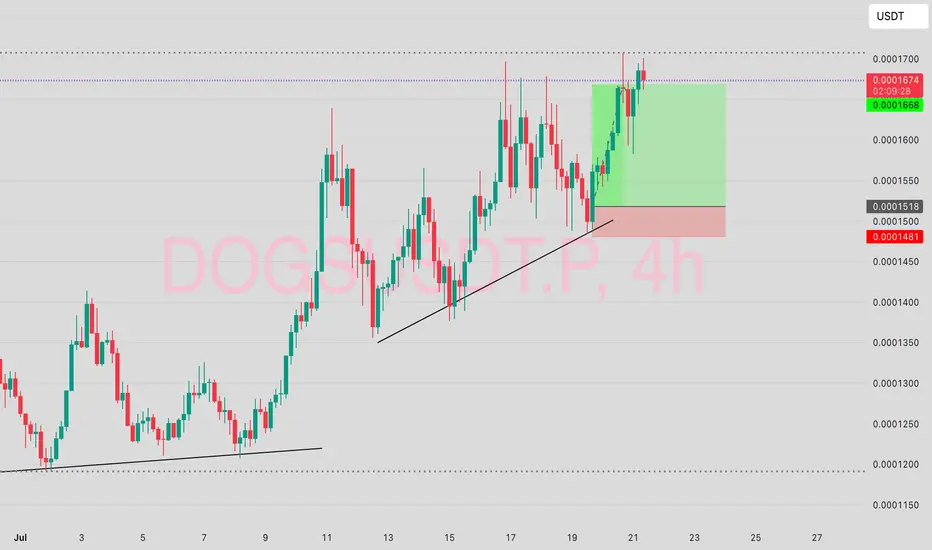
The price is moving within an ascending channel on the 1-hour frame, adhering well to it, and is poised to break it strongly upwards and retest it.
We have support from the lower boundary of the ascending channel, at 0.0001300.
We have a downtrend on the RSI indicator that is about to break
$DOGSHere's my BYBIT:DOGSUSDT.P
My regard to my SEED_ALEXDRAYM_SHORTINTEREST1:DOGS for the 1:4RR
Every weekend should be like this, don’t you think say?
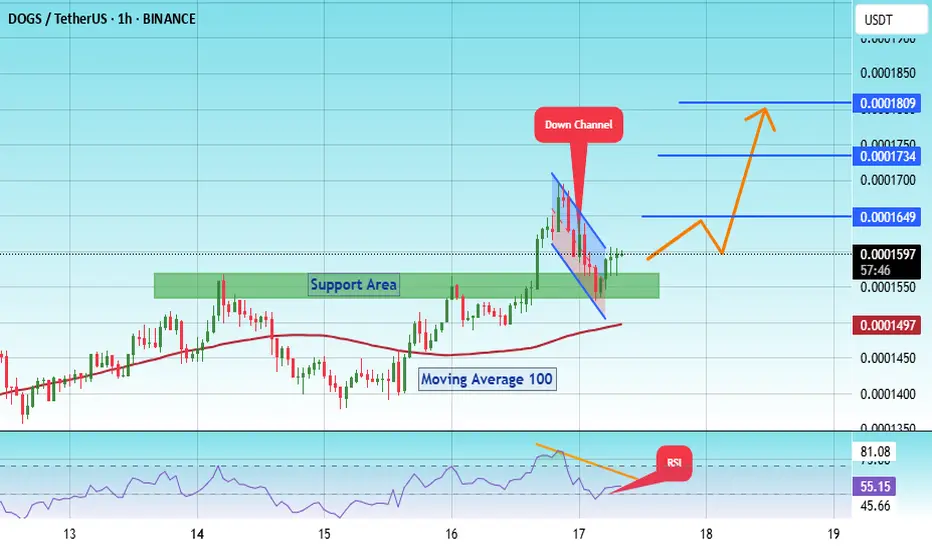
#DOGS/USDT – Launchpad or Breakdown?#DOGS
The price is moving within a descending channel on the 1-hour frame, adhering well to it, and is on its way to breaking it strongly upwards and retesting it.
We have a bounce from the lower boundary of the descending channel. This support is at 0.0001500.
We have a downtrend on the RSI indic
#DOGS/USDT – Launchpad or Breakdown?#DOGS
The price is moving within a descending channel on the 1-hour frame, adhering well to it, and is on its way to breaking it strongly upwards and retesting it.
We have a bounce from the lower boundary of the descending channel. This support is at 0.0001385.
We have a downtrend on the RSI indic
See all ideas
Summarizing what the indicators are suggesting.
Oscillators
Neutral
SellBuy
Strong sellStrong buy
Strong sellSellNeutralBuyStrong buy
Oscillators
Neutral
SellBuy
Strong sellStrong buy
Strong sellSellNeutralBuyStrong buy
Summary
Neutral
SellBuy
Strong sellStrong buy
Strong sellSellNeutralBuyStrong buy
Summary
Neutral
SellBuy
Strong sellStrong buy
Strong sellSellNeutralBuyStrong buy
Summary
Neutral
SellBuy
Strong sellStrong buy
Strong sellSellNeutralBuyStrong buy
Moving Averages
Neutral
SellBuy
Strong sellStrong buy
Strong sellSellNeutralBuyStrong buy
Moving Averages
Neutral
SellBuy
Strong sellStrong buy
Strong sellSellNeutralBuyStrong buy
Displays a symbol's price movements over previous years to identify recurring trends.
Frequently Asked Questions
The current price of DOGS / TetherUS (DOGS) is 0.0001384 USDT — it has fallen −1.46% in the past 24 hours. Try placing this info into the context by checking out what coins are also gaining and losing at the moment and seeing DOGS price chart.
DOGS / TetherUS price has fallen by −1.02% over the last week, its month performance shows a 12.19% increase, and as for the last year, DOGS / TetherUS has decreased by −74.62%. See more dynamics on DOGS price chart.
Keep track of coins' changes with our Crypto Coins Heatmap.
Keep track of coins' changes with our Crypto Coins Heatmap.
DOGS / TetherUS (DOGS) reached its highest price on Aug 26, 2024 — it amounted to 0.0018000 USDT. Find more insights on the DOGS price chart.
See the list of crypto gainers and choose what best fits your strategy.
See the list of crypto gainers and choose what best fits your strategy.
DOGS / TetherUS (DOGS) reached the lowest price of 0.0001006 USDT on Apr 7, 2025. View more DOGS / TetherUS dynamics on the price chart.
See the list of crypto losers to find unexpected opportunities.
See the list of crypto losers to find unexpected opportunities.
The safest choice when buying DOGS is to go to a well-known crypto exchange. Some of the popular names are Binance, Coinbase, Kraken. But you'll have to find a reliable broker and create an account first. You can trade DOGS right from TradingView charts — just choose a broker and connect to your account.
Crypto markets are famous for their volatility, so one should study all the available stats before adding crypto assets to their portfolio. Very often it's technical analysis that comes in handy. We prepared technical ratings for DOGS / TetherUS (DOGS): today its technical analysis shows the sell signal, and according to the 1 week rating DOGS shows the sell signal. And you'd better dig deeper and study 1 month rating too — it's buy. Find inspiration in DOGS / TetherUS trading ideas and keep track of what's moving crypto markets with our crypto news feed.
DOGS / TetherUS (DOGS) is just as reliable as any other crypto asset — this corner of the world market is highly volatile. Today, for instance, DOGS / TetherUS is estimated as 4.01% volatile. The only thing it means is that you must prepare and examine all available information before making a decision. And if you're not sure about DOGS / TetherUS, you can find more inspiration in our curated watchlists.
You can discuss DOGS / TetherUS (DOGS) with other users in our public chats, Minds or in the comments to Ideas.