#DOGS/USDT#DOGS
The price is moving within a descending channel on the 1-hour frame, adhering well to it, and is heading toward a strong breakout and retest.
We are experiencing a rebound from the lower boundary of the descending channel. This support is at 0.0001608.
We are experiencing a downtrend on the
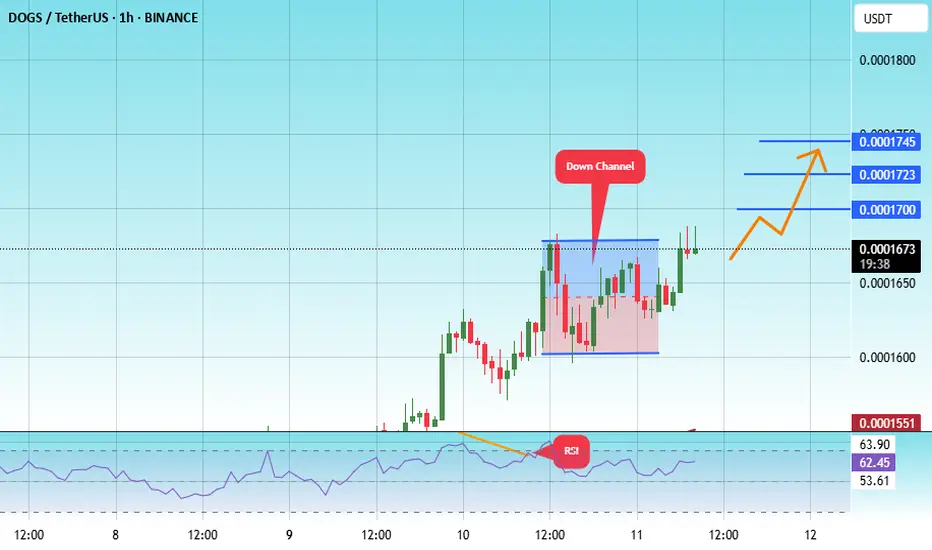
DOGS cryptocurrency analysis within the highlighted rangeAccording to the DOGS cryptocurrency chart, if the candle closes above the highlighted range, an upward trend can be expected. However, if it closes below the range, a further downward movement is likely
DOGS cryptocurrency analysis within the highlighted range.”According to the DOGS cryptocurrency chart, if the candle closes above the highlighted range, an upward trend can be expected. However, if it closes below the range, a further downward movement is likely.

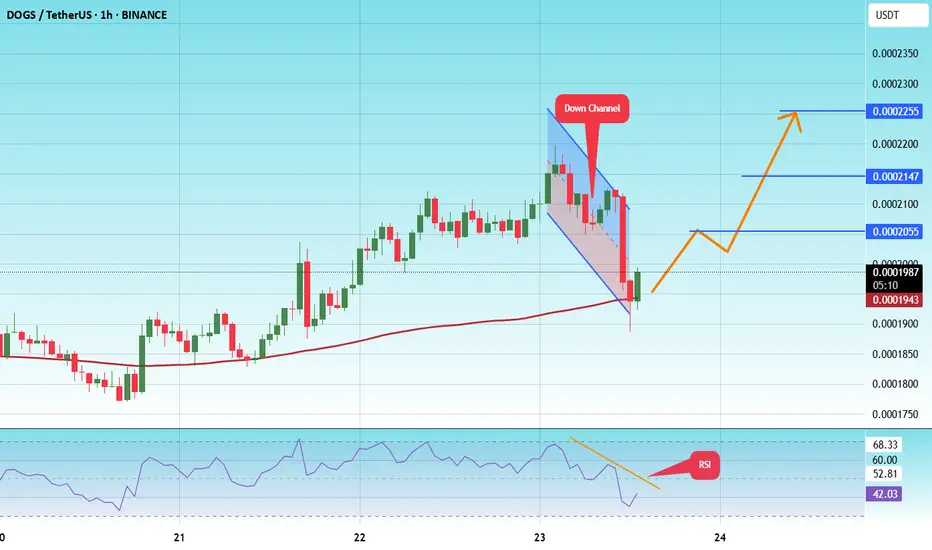
#DOGS/USDT#DOGS
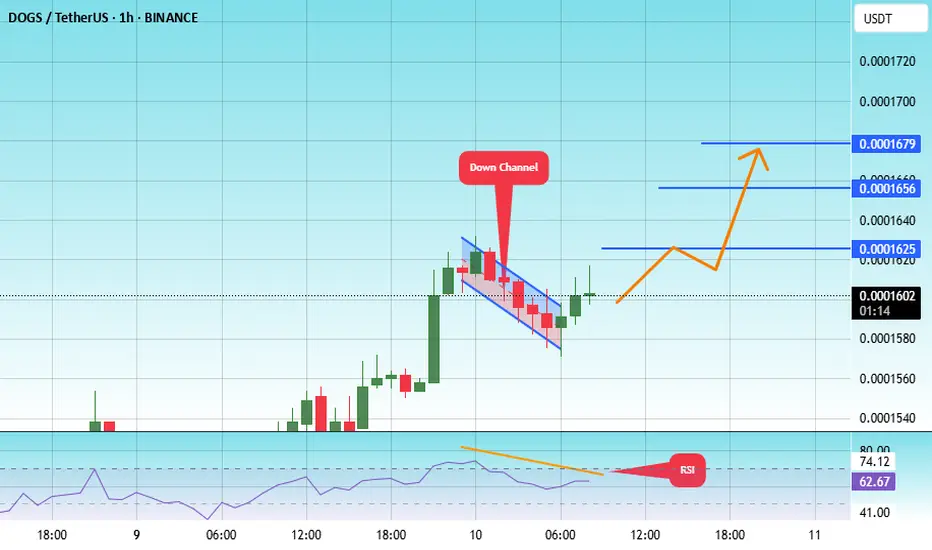
The price is moving within a descending channel on the 1-hour frame and is expected to break and continue upward.
We have a trend to stabilize above the 100 moving average once again.
We have a downtrend on the RSI indicator that supports the upward move with a breakout.
We have a support
#DOGS/USDT#DOGS
The price is moving within a descending channel on the 1-hour frame, adhering well to it, and is heading for a strong breakout and retest.
We are experiencing a rebound from the lower boundary of the descending channel. This support is at 0.0001575.
We are experiencing a downtrend on the RSI
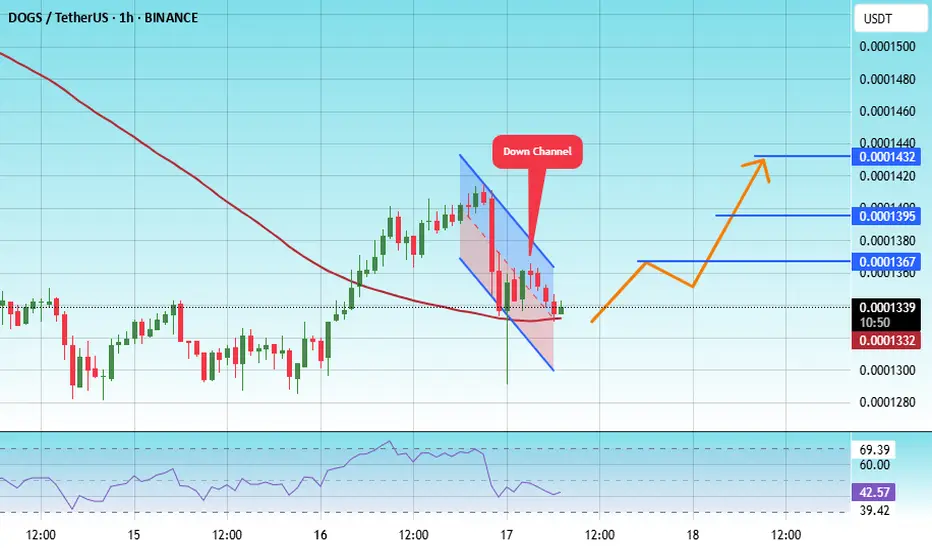
#DOGS/USDT#DOGS
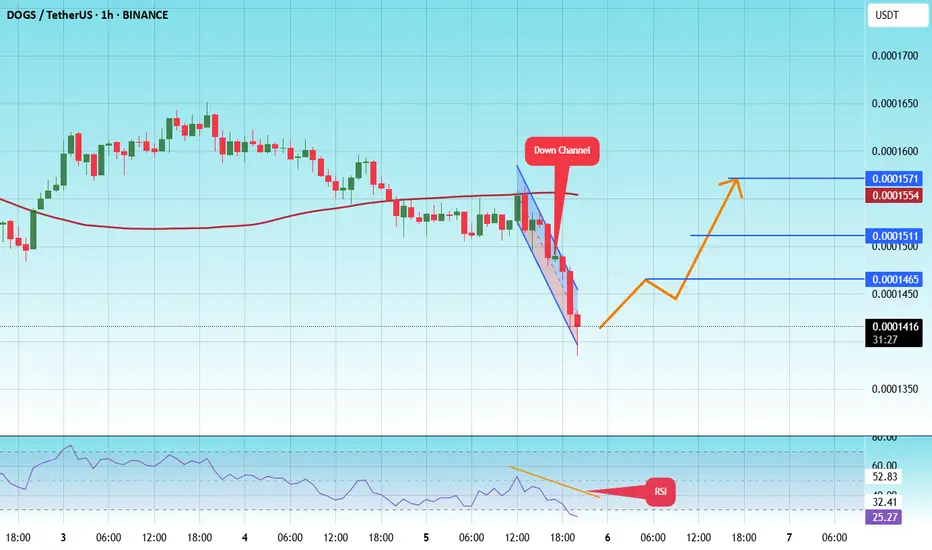
The price is moving within a descending channel on the 1-hour frame, adhering well to it, and is on its way to breaking it strongly upwards and retesting it.
We are seeing a bounce from the lower boundary of the descending channel. This support is at 0.0001311.
We have a downtrend on the RS
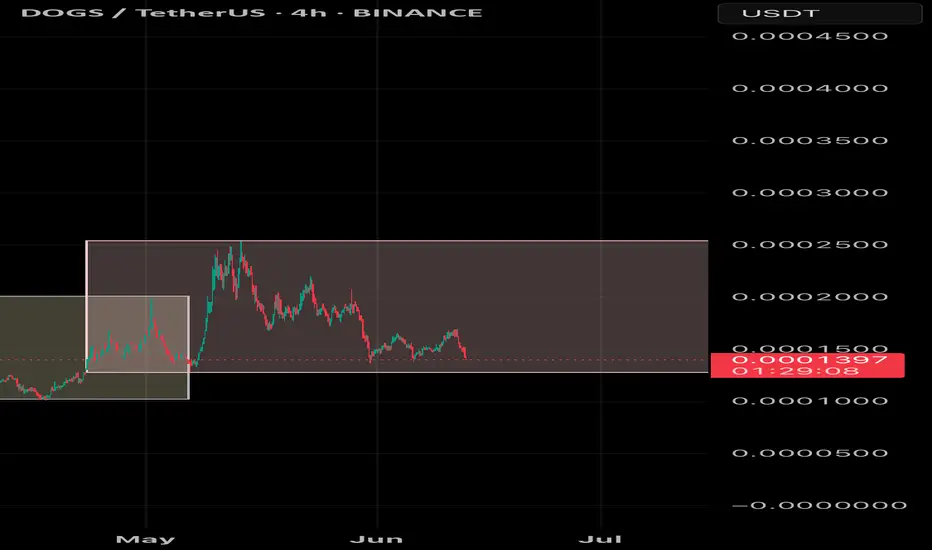
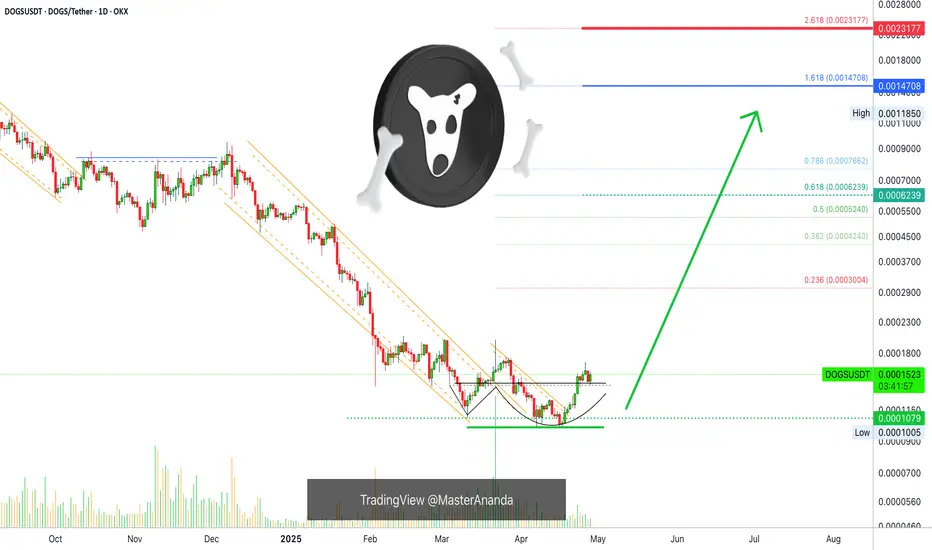
Dogs 4X Lev. Full PREMIUM Trade-Numbers (PP: 1608%)Dogs bottom is now confirmed and this is a chart setup with low risk vs a high potential for reward.
The bottom signal comes from a pattern, the breakdown of the downtrend, high volume after the first main low and current price action as well as marketwide action and Bitcoin being strong. These are
#DOGS/USDT#DOGS
The price is moving within a descending channel on the 1-hour frame and is expected to break and continue upward.
We have a trend to stabilize above the 100 moving average once again.
We have a downtrend on the RSI indicator that supports the upward move with a breakout.
We have a support
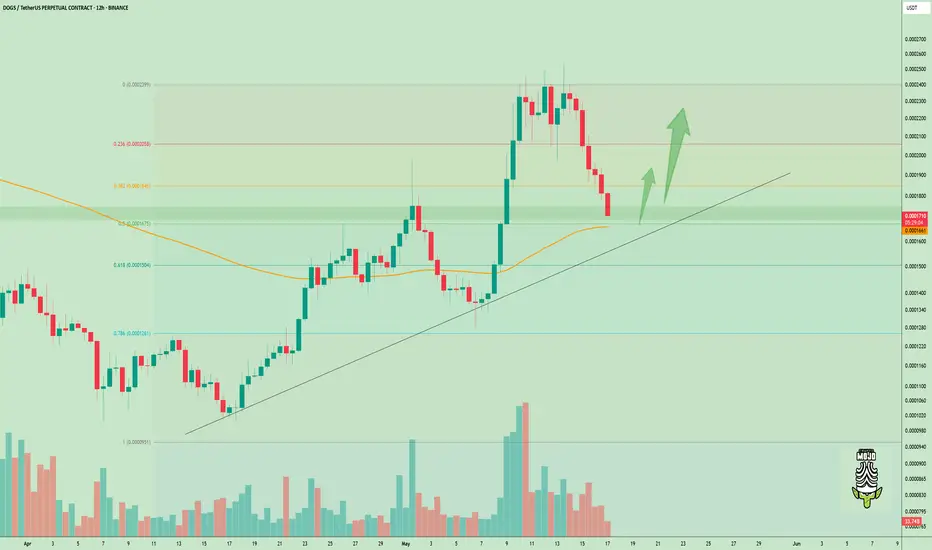
DOGS : be carefulHello friends
As you can see, after the price growth we had, the price has fallen. Given the severity of the fall, we recommend that you buy in stages, manage your risk and capital, and move with it to the specified goals.
*Trade safely with us*

Critical Test for $DOGS – Launchpad or Breakdown?SEED_ALEXDRAYM_SHORTINTEREST1:DOGS Update
SEED_ALEXDRAYM_SHORTINTEREST1:DOGS is heading towards an important confluence support area resting precisely at the 0.382 Fib (~0.0000184), the rising trendline, and the 50EMA on the 12H chart.
This area has maintained support in the last rally and may
See all ideas
Summarizing what the indicators are suggesting.
Oscillators
Neutral
SellBuy
Strong sellStrong buy
Strong sellSellNeutralBuyStrong buy
Oscillators
Neutral
SellBuy
Strong sellStrong buy
Strong sellSellNeutralBuyStrong buy
Summary
Neutral
SellBuy
Strong sellStrong buy
Strong sellSellNeutralBuyStrong buy
Summary
Neutral
SellBuy
Strong sellStrong buy
Strong sellSellNeutralBuyStrong buy
Summary
Neutral
SellBuy
Strong sellStrong buy
Strong sellSellNeutralBuyStrong buy
Moving Averages
Neutral
SellBuy
Strong sellStrong buy
Strong sellSellNeutralBuyStrong buy
Moving Averages
Neutral
SellBuy
Strong sellStrong buy
Strong sellSellNeutralBuyStrong buy
Displays a symbol's price movements over previous years to identify recurring trends.