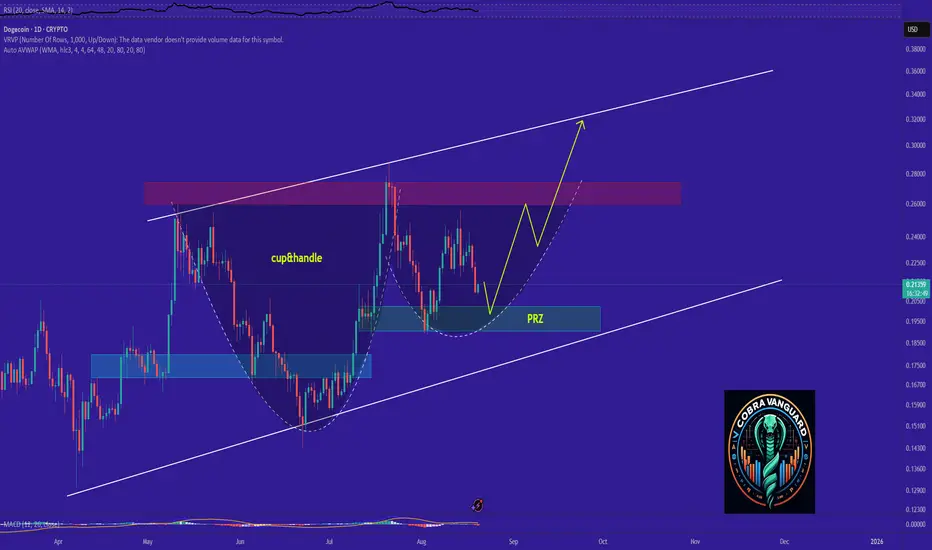
DOGE's Situation, A Comprehensive Analysis !!!It appears that the price is forming a cup and handle pattern, and if this occurs, it could push the price above $0.30 & reach to top of the channel.
Best regards CobraVanguard.💚
DOGUSD trade ideas
Dogecoin - The all time high will follow!🎁Dogecoin ( CRYPTO:DOGEUSD ) prepares new all time highs:
🔎Analysis summary:
Dogecoin has been creating bullish cycles for the past decade. Following these cycles, it is quite likely that Dogecoin will break the previous all time high soon. And with the recent bullish break and retest, bulls are picking up momentum for the next bullish cycle to continue.
📝Levels to watch:
$0.4
SwingTraderPhil
SwingTrading.Simplified. | Investing.Simplified. | #LONGTERMVISION

Doge - launch sequence?Hello!
The yellow and purple traces are today’s look at the bullish launch sequences that we may be feeling the effects of.
Yellow shows $0.32 on this next move for Doge. Purple is fractaling out … it goes big. Over a dollar.
This could also the a head and shoulders having just completed on the hourly view. That would make this the right shoulder on tehlonge range view also… nested H& S? That can trigger big moves.
RSI and MACD jsut reset on the 4H candle. Love that position for a bounce!
Go Doge Go!
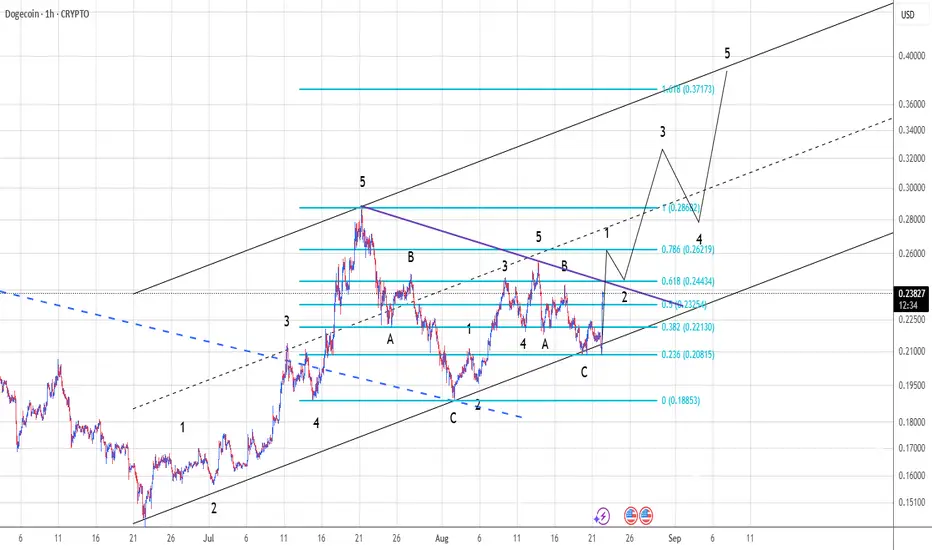
Doge to .40c?I think there is a strong possibility we will see Doge hit near .40c. If it breaks above trendline I will buy on pullback and ride wave 3 up.
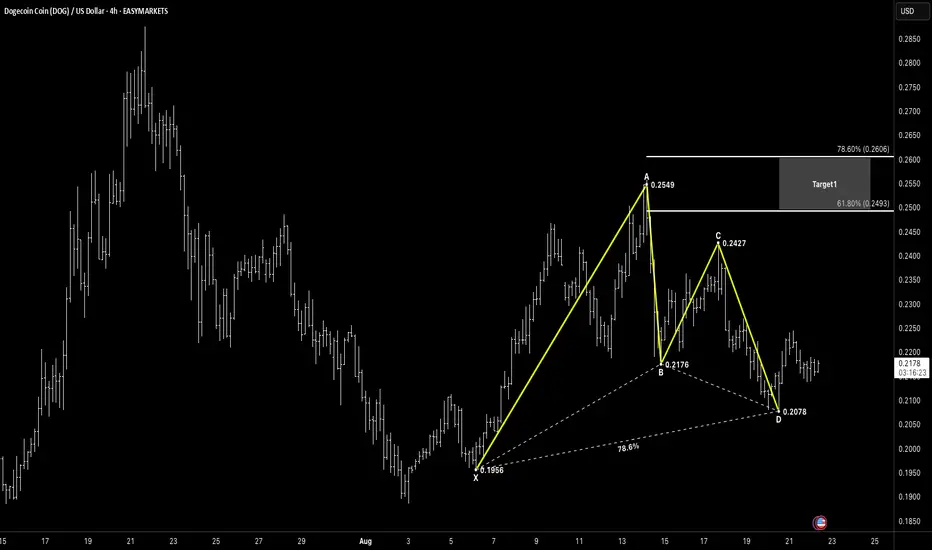
GARTLEYDOGE/USD (4H) – Bullish Gartley at D (Reversal → T1/T2)
Quick summer check-in while I sneak some downtime: DOGE just printed a clean Gartley-style completion and buyers are reacting at D.
📌 Pattern Overview
Pattern: Gartley (Bullish)
Asset: Dogecoin / USD
Timeframe: 4H
Bias: Long from D/PRZ on confirmation and structure reclaim
🔑 Key Levels
X: 0.1956
A: 0.2549
B: 0.2176 (shallow retrace of XA)
C: 0.2427
D (PRZ): 0.2078 (confluence with XA fib + AB=CD symmetry)
Target 1: 0.2493 – 0.2606 (≈ 61.8%–78.6% of AD)
Target 2: 0.2933 – 0.3165 (≈ 127.2%–161.8% extension)
📐 Technical Confirmation
BC retrace ≈ 67% of AB, CD ≈ 1.27–1.41 × BC into D.
Confluence at 0.207–0.210 forms the PRZ; first bullish reaction printed.
Structure pivot to watch: 0.224–0.226 (break/hold confirms momentum).
⚡️ Price Action & Trade Setup
Plan A (confirmation): Wait for a close above 0.224–0.226, buy the retest → T1, trail remainder toward T2.
Plan B (PRZ fade): Scale in small on holds within 0.208–0.212 with a tight stop; add on higher-low + pivot reclaim.
🧠 Market Sentiment
Choppy, but dip-buyers active near structure lows; holding above D keeps the recovery path open.
📊 Next Potential Movements
Upside path: 0.226 → 0.235 → 0.249–0.261 (T1), extension toward 0.293–0.317 (T2) if momentum broadens.
Pullbacks: 0.214 / 0.210 are spots to defend for higher-low continuation.
🛡 Risk Management
Invalidation: clean close below 0.2078 (D); conservative invalidation below 0.1956 (X).
Stops: just under 0.205 (aggressive) or < 0.195 (structure).
TP: scale at T1, trail to T2; move stop to BE after ~1R.
🚀 Conclusion
Gartley completion at D is holding. A firm 0.224–0.226 reclaim unlocks T1 (0.249–0.261), with room toward T2 (0.293–0.317) if buyers keep control.
“Patterns set the map — discipline drives the journey.”
@TRADECHARTPATTERNSLIKETHEPROS.
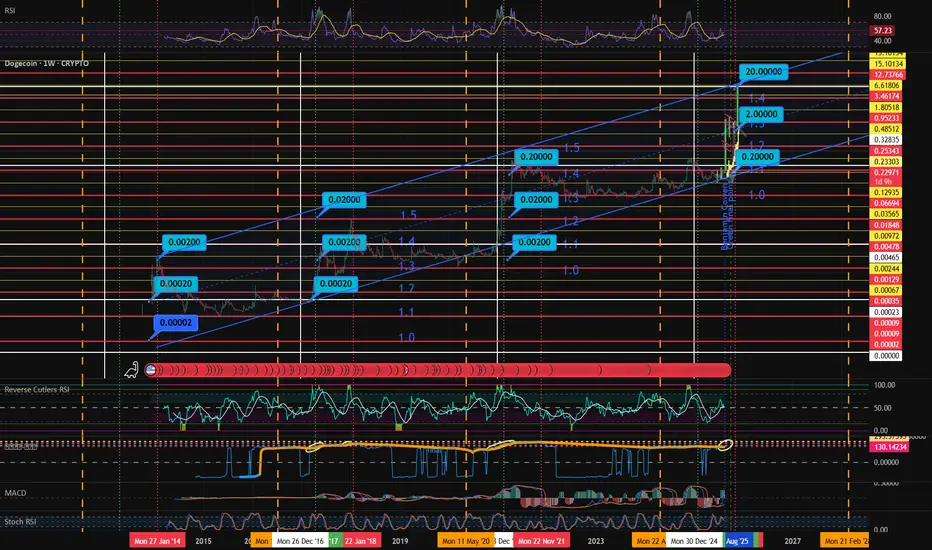
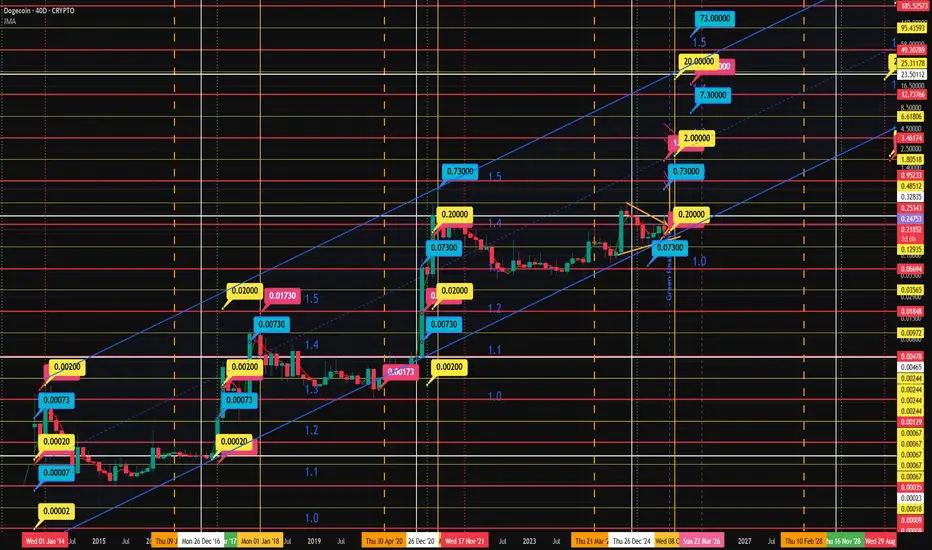
The only chart you need for DOGEUSD This chart displays Dogecoin (DOGE/USDT) on a weekly timeframe, highlighting its long-term price trend within an ascending channel since 2014. Key historical breakout levels are marked (e.g., $0.00002, $0.002, $0.02, $0.20, $2, and a projected $20 target), showing the repeating exponential growth cycles. The chart is overlaid with support and resistance zones, Fibonacci-like levels, and trend channels (1.0, 1.1, 1.2, 1.5). Vertical dotted and dashed lines mark important cycle dates and potential turning points. Current price action is consolidating near $0.23, with future targets extending to $2 and potentially $20 if the channel pattern continues.
Dogecoin: A Technical & Macro ConvergenceThis logarithmic Dogecoin chart combines three distinct analytical tools to paint a compelling picture for what might be next for Elon’s favorite crypto.
1. The Power of Triangles
Over the years, Dogecoin has formed three large triangle patterns on its chart. In the past, once price broke out of these consolidations, it expanded dramatically before reaching a cycle top. We’re now inside the third triangle — and price action suggests it’s approaching another breakout.
2. Liquidity as the Hidden Driver
Overlaying global M2 (the broad measure of money supply) reveals that Dogecoin’s price tends to follow it with about an 11-week lag. Liquidity growth has been picking up, and historically, that has provided the fuel for Doge rallies. If the pattern holds, the odds of breaking out of the current triangle rise significantly.
3. Linear Regression Targets
The standard linear regression channel helps us frame potential price targets. Dogecoin currently trades around $0.233. If it reaches the upper band of this regression channel — as it has in previous strong uptrends — the model suggests a potential target near $5, which would represent roughly a 2,045% gain from current levels.
Why This Matters
This chart doesn’t guarantee a repeat of history — but it combines pattern structure, macro liquidity trends, and statistical price channels into one clear roadmap. If global liquidity keeps expanding, and history rhymes, Dogecoin could be setting up for another explosive leg.
Not financial advice. Do your own research.
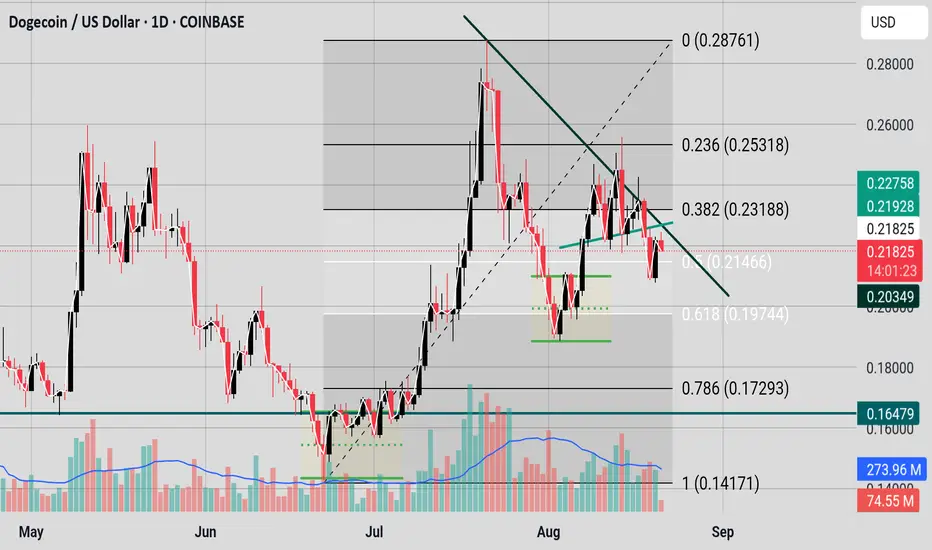
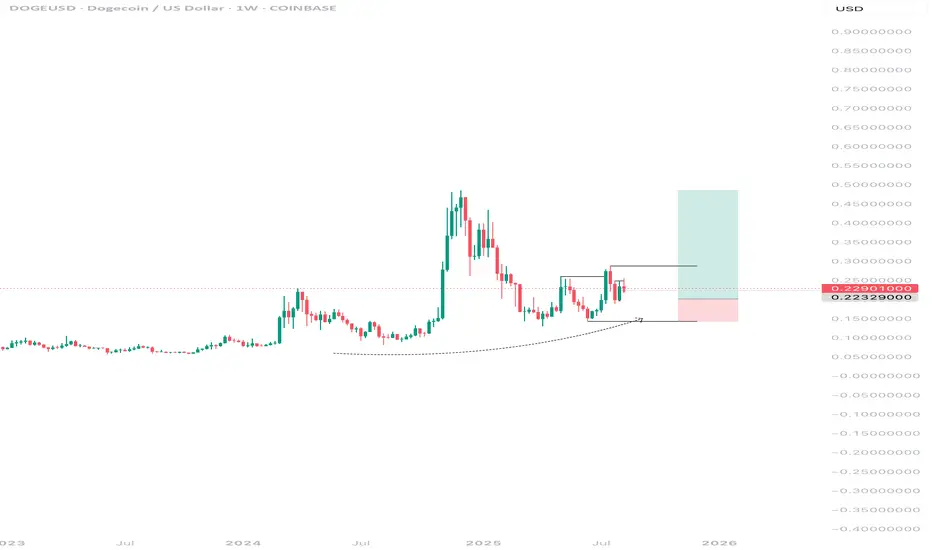
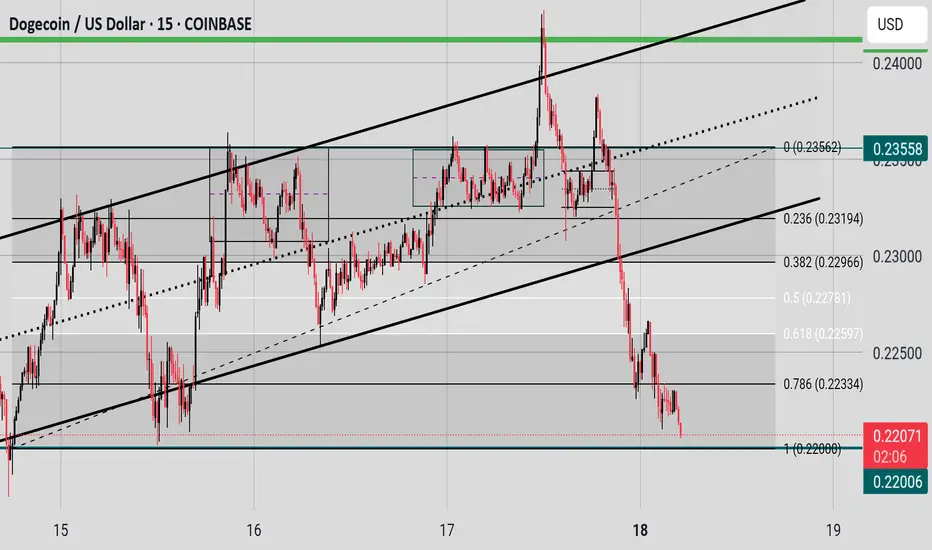
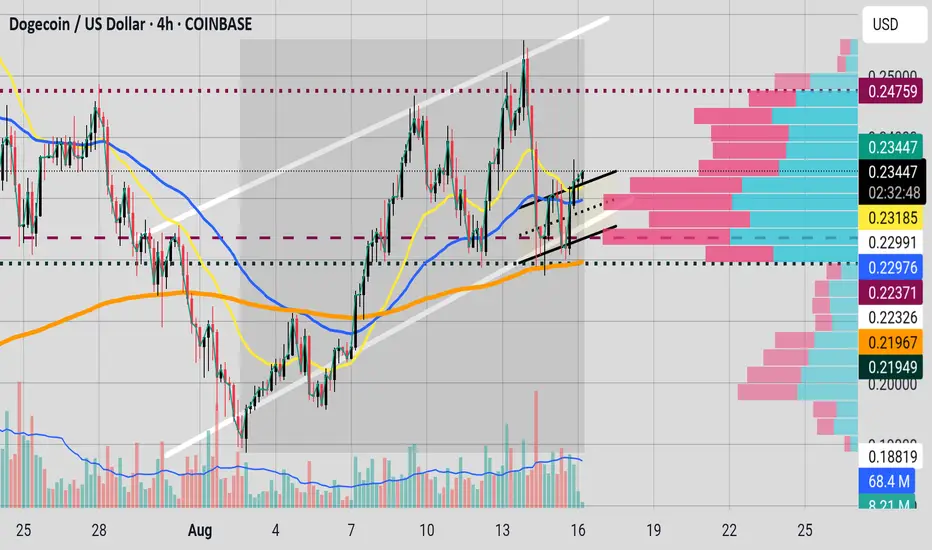
Reunion at the TrendlineThe Bulls had a double bottom.
Then the Bears had a head and shoulders.
Now both are facing off at the downward trendline.
Price is again at the golden zone.
Bulls need price to break the trendline and then reclaim the 0.23188 cents level.
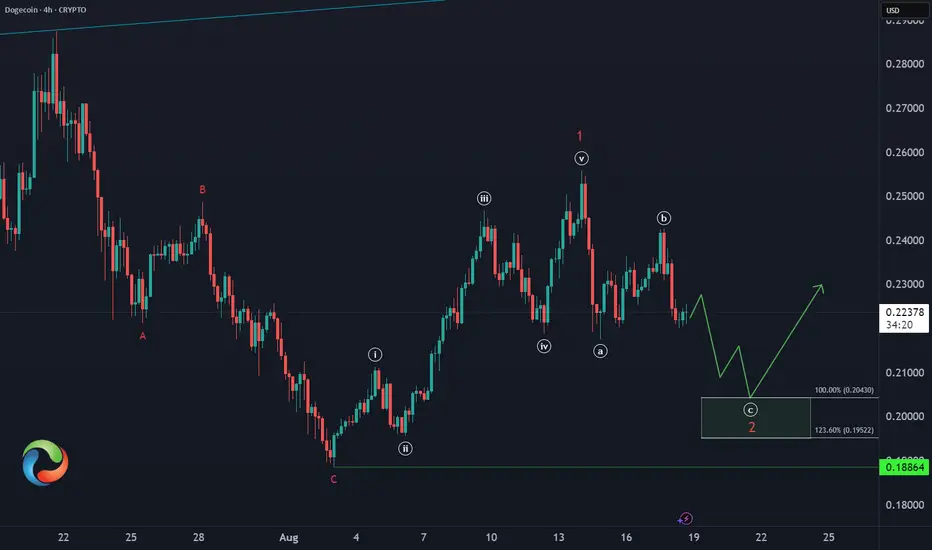
Dogecoin Correction Going According to Plan🐶 CRYPTO:DOGEUSD is unfolding a 3-wave pullback, with the equal legs zone at $0.204–$0.195 acting as the next key support.
📈 A bullish reaction is expected from this area as the structure completes.
Will Dogecoin Hold the August Low at $0.18?
Are you ready to load your bags when it matters most?
🎯 Smart money waits for structure.
Bears at the ReadyPrice is currently testing a downward trendline and possibly forming and Head and Shoulders at the trendline. The Bulls need to push price above the 21 EMA( in yellow 0.22378$) to avoid a highly probable bearish movement.

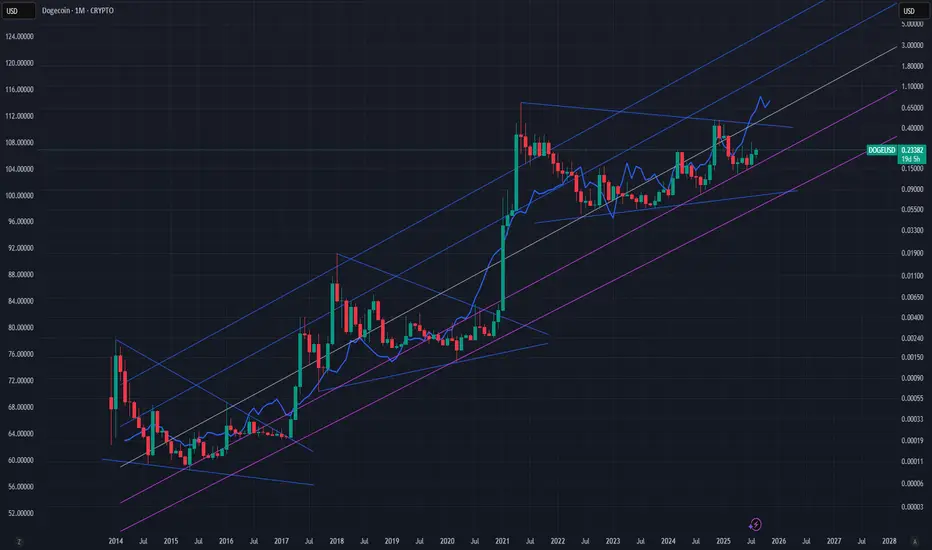
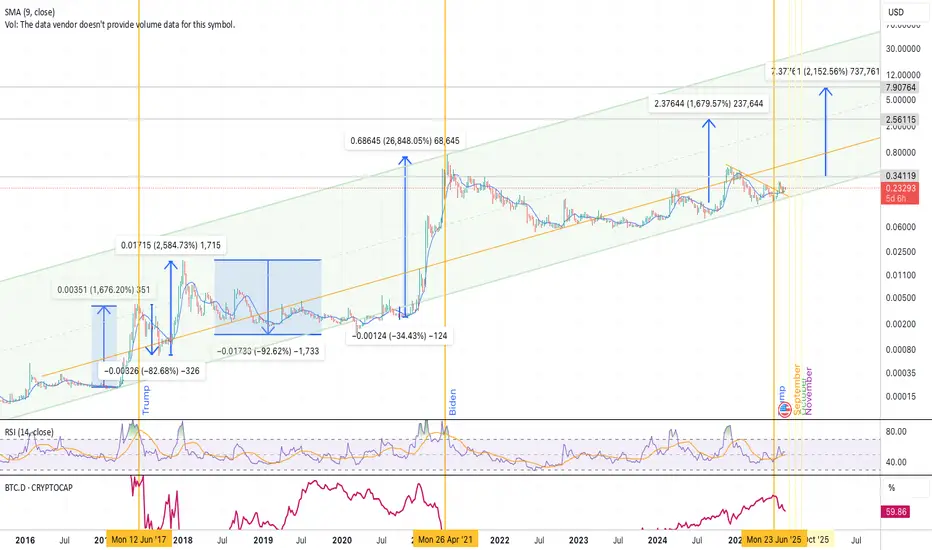
DOGE Bubble Cycle PatternBy merging both bubble charts (Yellow/Blue/Pink and Blue/Pink only), a clear fractal sequence emerges:
🔎 Step 1 – Cycle Sequences
Cycle 1 (2014–2016): Y (0.0002) → B (0.00073) → P (0.00173)
Cycle 2 (2017–2020): Y (0.0020) → B (0.0073) → P (0.0173)
Cycle 3 (2020–2022): Y (0.0200) → B (0.0730) → P (0.1730)
Cycle 4 (2025–2026, in progress): Y (2.0000) → B (7.3000) → P (17.3000 projected)
📌 Step 2 – Sequence Pattern
When overlaps are removed, each cycle follows the same strict order:
➡️ Yellow → Blue → Pink
This structure has repeated across 3 full historical cycles and is unfolding again in Cycle 4.
🧩 Step 3 – Cycle Rule
Yellow = Macro cycle anchor (start of each set).
Blue = Impulse peak within the cycle.
Pink = Correction pivot before reset.
The cycle then resets with a new Yellow and repeats.
So the long-term repeating loop is:
(Y → B → P) → (Y → B → P) → (Y → B → P) …
✅ Conclusion: DOGE’s bubble cycles are fractal, color-coded, and consistent. Currently, Cycle 4 has completed Yellow & Blue and is moving toward the Pink bubble (~17.3) before the next reset begins.
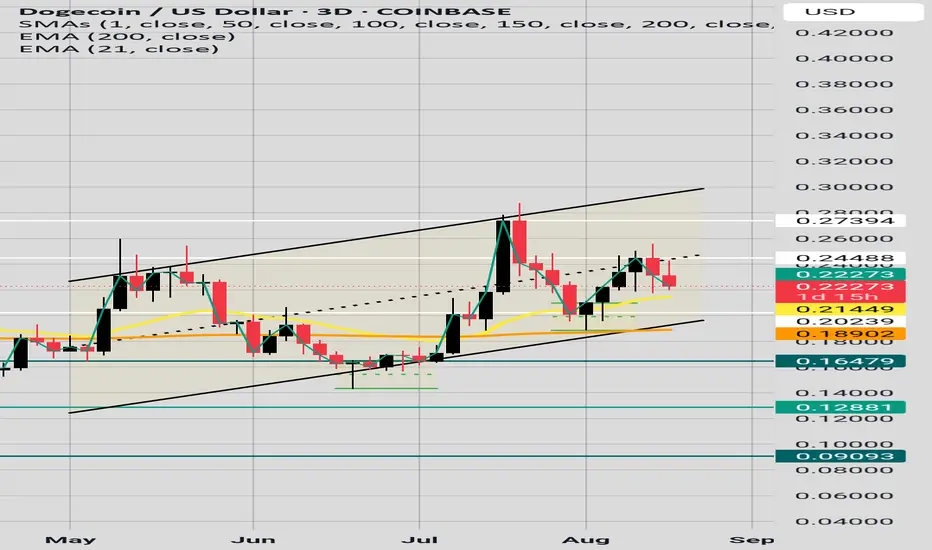
MidpointIt seems on the 3 DAY chart price was cycling up in the parallel channel but faced rejection at the midpoint. Price needs to make HH and HL from 21EMA(in yellow) 0.21448 area and clear the midpoint (the 24 cents) area to cycle back to the top of the channel; if not price can drop to the 19 cents region(200 EMA) in orange.
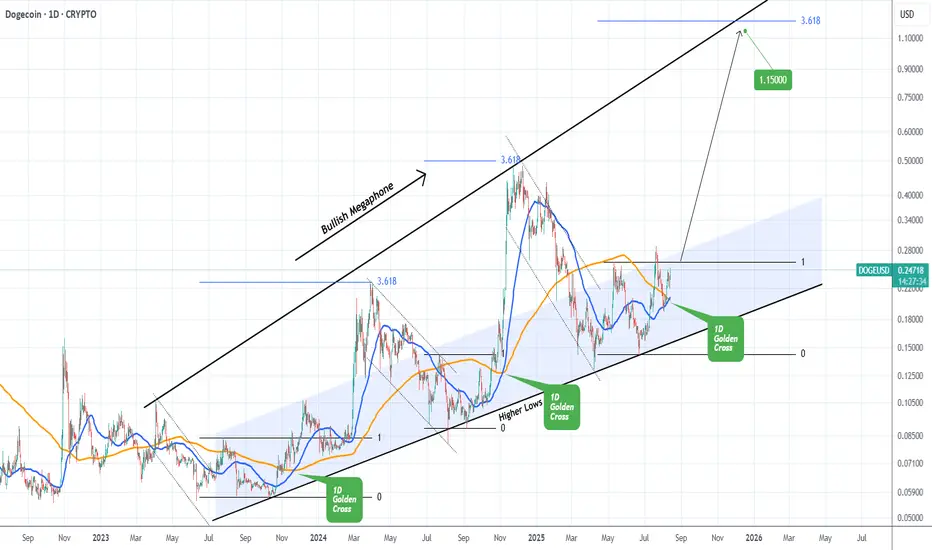
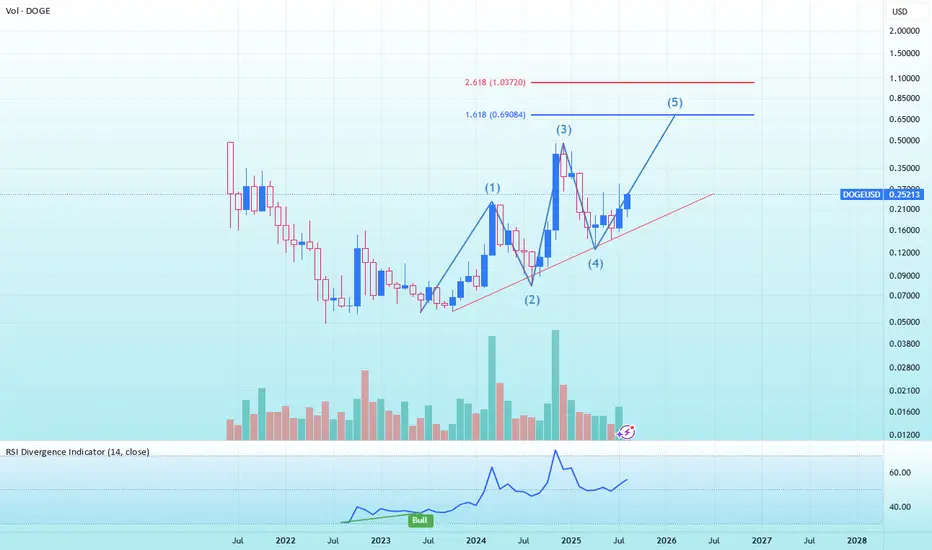
DOGE Can its 1st 1D Golden Cross in 9 months make it skyrocket?Dogecoin (DOGEUSD) just completed yesterday its first 1D Golden Cross formation in 9 months! The last one (November 05 2024), was right before the previous Bullish Leg of the 2-year Bullish Megaphone exploded.
As you can see on the chart, both previous Bullish Legs peaked on the 3.618 Fibonacci extension from their respective bottoms. Those were the pattern's Higher Highs.
If this is repeated, we can expect Doge to touch $1.1500 (as close to Fib 3.618 as possible), even by the end of this year.
-------------------------------------------------------------------------------
** Please LIKE 👍, FOLLOW ✅, SHARE 🙌 and COMMENT ✍ if you enjoy this idea! Also share your ideas and charts in the comments section below! This is best way to keep it relevant, support us, keep the content here free and allow the idea to reach as many people as possible. **
-------------------------------------------------------------------------------
💸💸💸💸💸💸
👇 👇 👇 👇 👇 👇
DOGE Pattern 2025No changes since the previous channel I published. DOGE is still going to hit half of the channel (around $2) for its first ATH and cool down for its next target following the second ATH in 2026 (around $7). It is just my opinion. Not a financial advise!
BreakBulls had a sever break of structure of the upward parallel channel and a big drop with no retest. If bulls don't support the .22 cents area price can drop to the 21 cents area.
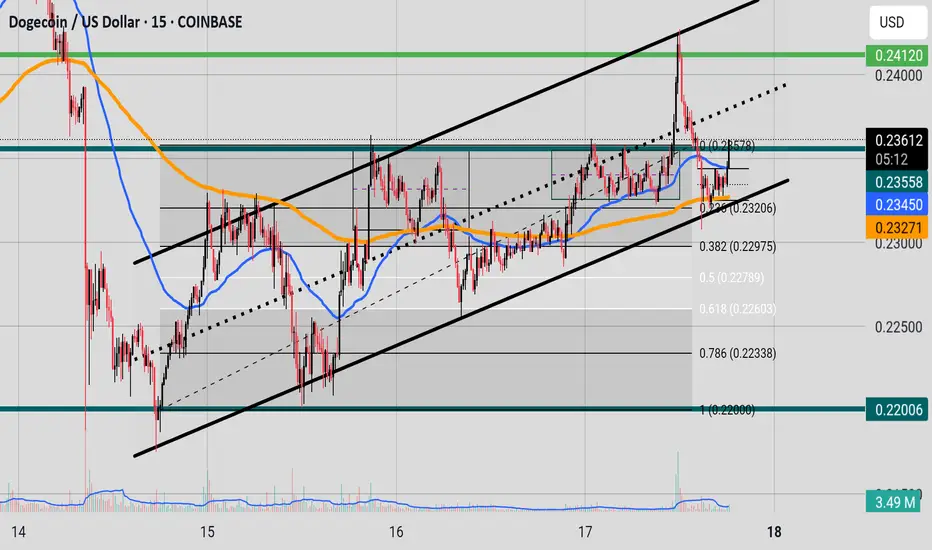
Parallel Channel and 50 EMAIt seems that DOGE tested the the 200 EMA in orange and passed and we are waiting for price to close above the 50 EMA in blue, and hopefully price can cycle through the resistance and move upward in the channel. Price needs to clear 0.23449 the 50 EMA and then 0.23578 resistance.
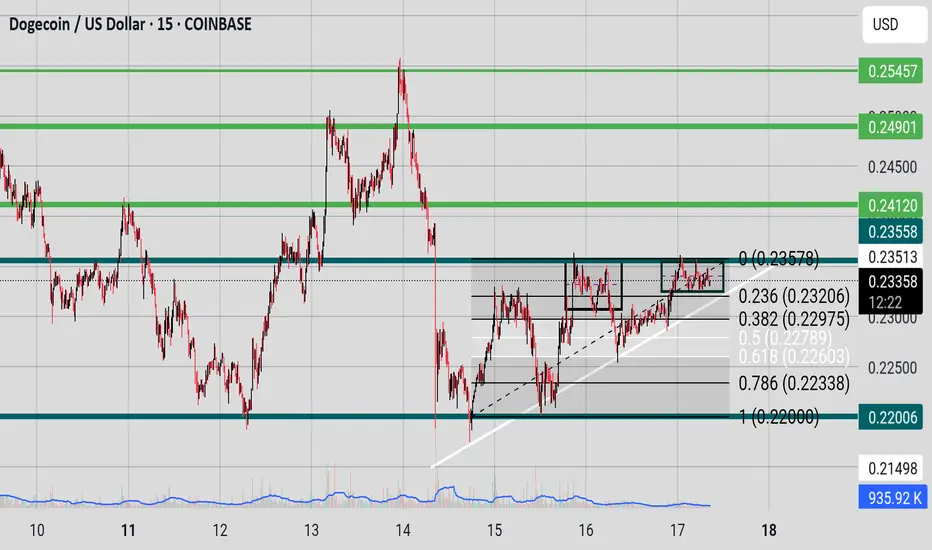
Bulls are tryingDOGE on the 15 min chart is forming and ascending triangle. With a strong resistance around 0.23578. Please observe Chart for key levels.
Double BottomDouble bottom forming on support of upward parallel Channel, Bulls need a clear break from the 21 EMA in yellow ( 0.23184).
DOGE Whales Are Back! $500M Buy Triggers Bullish BreakoutDogecoin CRYPTOCAP:DOGE is now again on the rise, thanks to a large increase in accumulation by whales. In the last week, addresses with 100 million to 1 billion DOGE boosted their holdings by 2 billion DOGE (roughly USD 500 million), indicating high confidence among major holders in the meme coin's long-term prospects.
Technical analysis on the monthly period shows that Dogecoin has the potential to maintain its bullish trend as long as the price stays above the lower trendline level around $0.15678. The movement's initial goal is classic resistance at $0.4688, with the possibility of further increases to the all-time high around $1.03 if strong momentum continues.
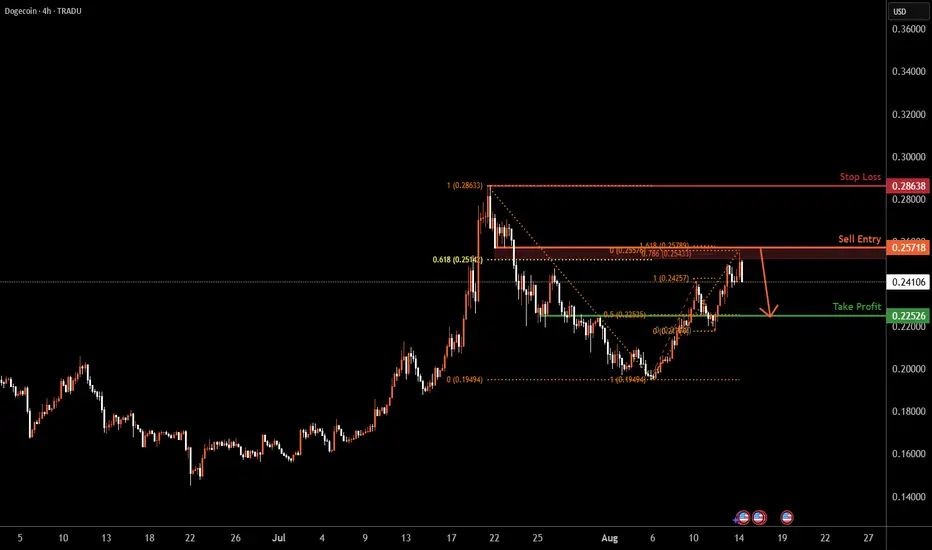
DOGEUSD H4 | Bearish reversal off Fibonacci confluenceDOGE/USD is rising towards the sell entry which is a pullback resistance that aligns with the 161.8% Fibonacci extension and the 78.6% Fibonacci projection, and could reverse from this level to the downside.
Sell entry is at 0.25718, which is a pullback resistance that aligns with the 161.8% Fibonacci extension and the 78.6% Fibonacci projection.
Take profit is at 0.2256, which is an overlap support that aligns with the 50% Fibonacci retracement.
High Risk Investment Warning
Trading Forex/CFDs on margin carries a high level of risk and may not be suitable for all investors. Leverage can work against you.
Stratos Markets Limited (tradu.com ):
CFDs are complex instruments and come with a high risk of losing money rapidly due to leverage. 65% of retail investor accounts lose money when trading CFDs with this provider. You should consider whether you understand how CFDs work and whether you can afford to take the high risk of losing your money.
Stratos Europe Ltd (tradu.com ):
CFDs are complex instruments and come with a high risk of losing money rapidly due to leverage. 66% of retail investor accounts lose money when trading CFDs with this provider. You should consider whether you understand how CFDs work and whether you can afford to take the high risk of losing your money.
Stratos Global LLC (tradu.com ):
Losses can exceed deposits.
Please be advised that the information presented on TradingView is provided to Tradu (‘Company’, ‘we’) by a third-party provider (‘TFA Global Pte Ltd’). Please be reminded that you are solely responsible for the trading decisions on your account. There is a very high degree of risk involved in trading. Any information and/or content is intended entirely for research, educational and informational purposes only and does not constitute investment or consultation advice or investment strategy. The information is not tailored to the investment needs of any specific person and therefore does not involve a consideration of any of the investment objectives, financial situation or needs of any viewer that may receive it. Kindly also note that past performance is not a reliable indicator of future results. Actual results may differ materially from those anticipated in forward-looking or past performance statements. We assume no liability as to the accuracy or completeness of any of the information and/or content provided herein and the Company cannot be held responsible for any omission, mistake nor for any loss or damage including without limitation to any loss of profit which may arise from reliance on any information supplied by TFA Global Pte Ltd.
The speaker(s) is neither an employee, agent nor representative of Tradu and is therefore acting independently. The opinions given are their own, constitute general market commentary, and do not constitute the opinion or advice of Tradu or any form of personal or investment advice. Tradu neither endorses nor guarantees offerings of third-party speakers, nor is Tradu responsible for the content, veracity or opinions of third-party speakers, presenters or participants.
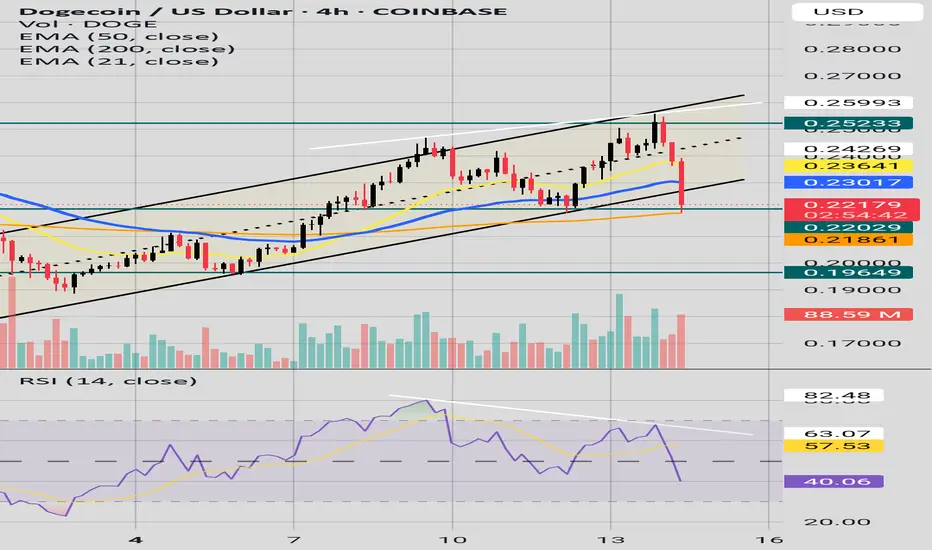
StructureDoge is in an upward parallel channel.
It must maintain structure and price must close inside the channel; price recently tapped the 200 EMA and is currently hovering around the support of the channel. There is also a strong bearish RSI divergence.
Doge Coin Inverse H&SCrypto loves these types of patterns and the indicators are lining up to support this move. Target .30+
