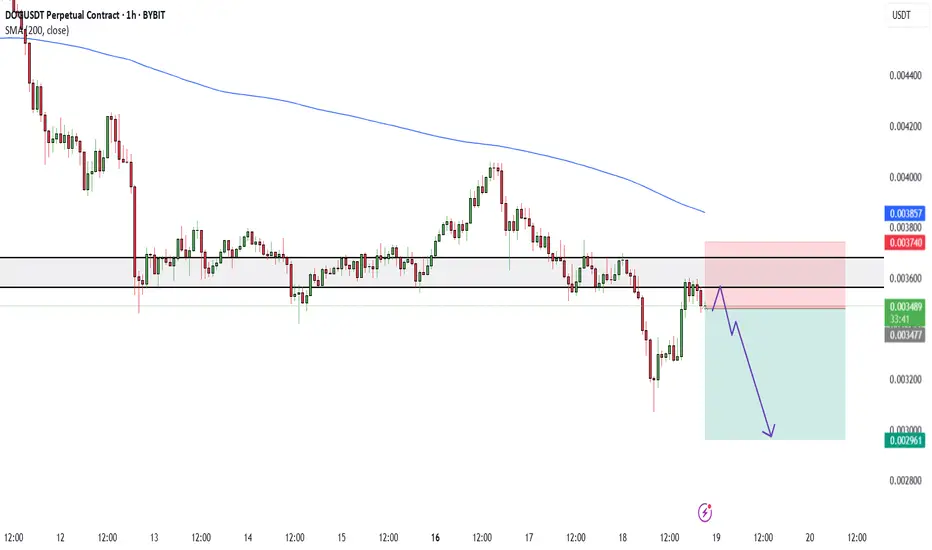
DOGUSDT Bearish signalDOGUSDT is creating lower lows and lower highs and the 0.003565 level is serving as resistance. A bearish continuation has the most probability in this setup...
TARGET 0.00269
SL 0.003740
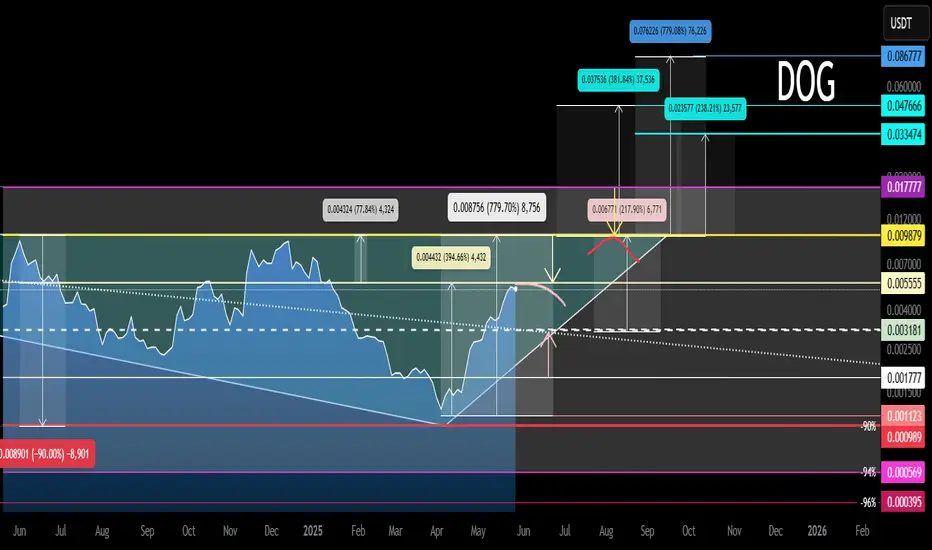
DOG Main Trend. Reversal Zones 05/29/2025Logarithm. Time frame 3 days. The chart shows key reversal zones in the horizontal channel, and when exiting it. For clarity, percentages are shown from the skin reversal zone. This is convenient for understanding the risk and potential profit in long and short work. You can also work in spot from l
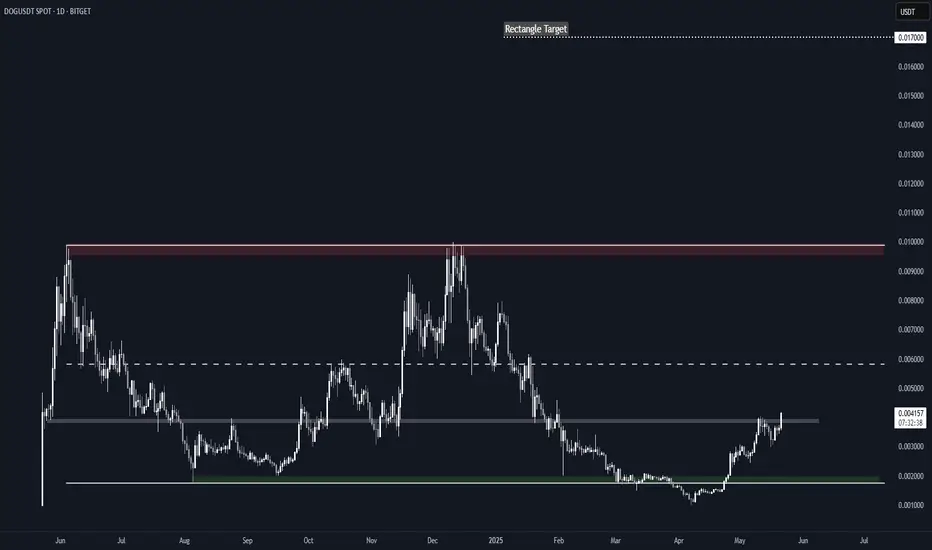
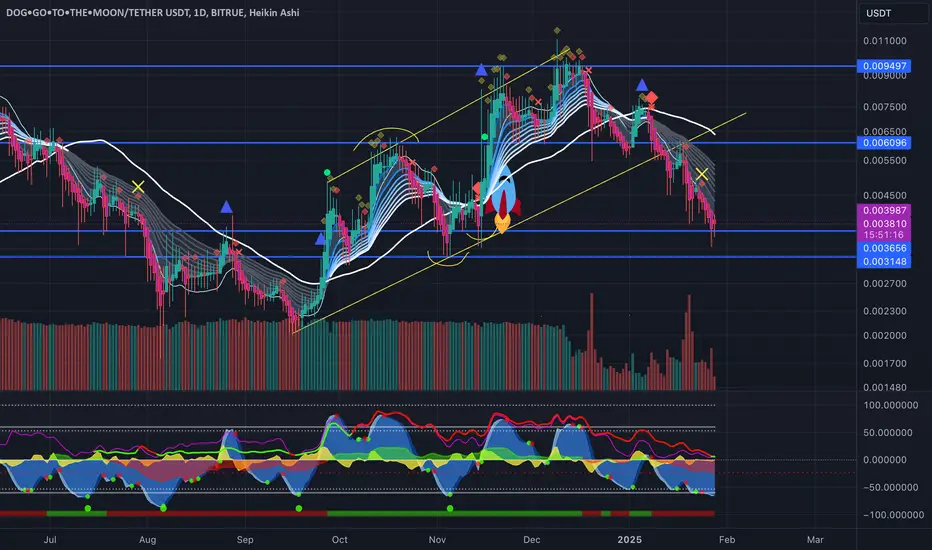
DOG Rectangle + Structure AnalysisBITGET:DOGUSDT has been trading in a rectangle since June 2024, with well-defined boundaries.
After a downside deviation in March, it managed to reclaim the range and it's now attempting to break above $0.0040, a key S/R throughout its price history.
Key Levels to Watch
• $0.0018-$0.0020: Main d
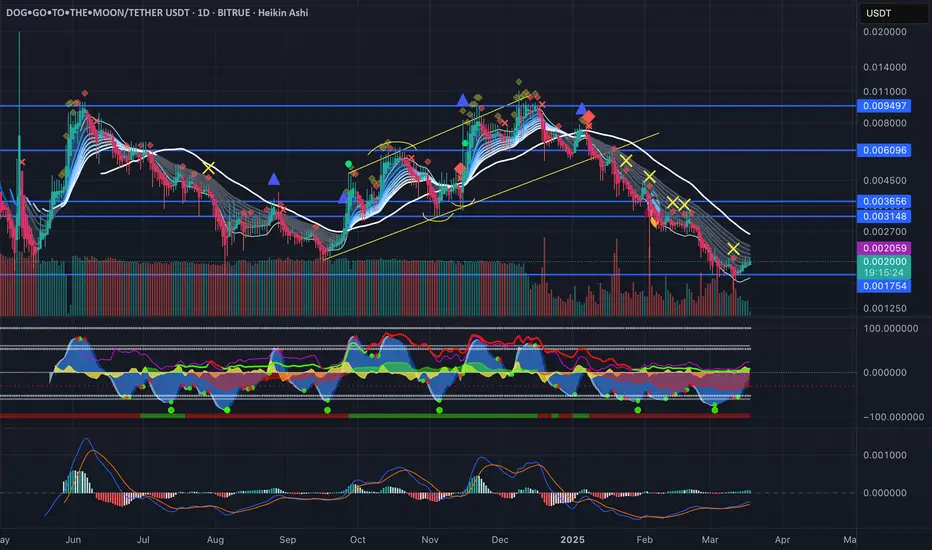
Dog Go To The MoonDog is poised to recover well from the bottom. It was way over sold. At this pace it'll naturally run into the weekly basis or mid BB Band, which I estimate is around May. If you bought around the range where the buy signal is, you'll probably be all right to Hodl long term. However, without a Tier

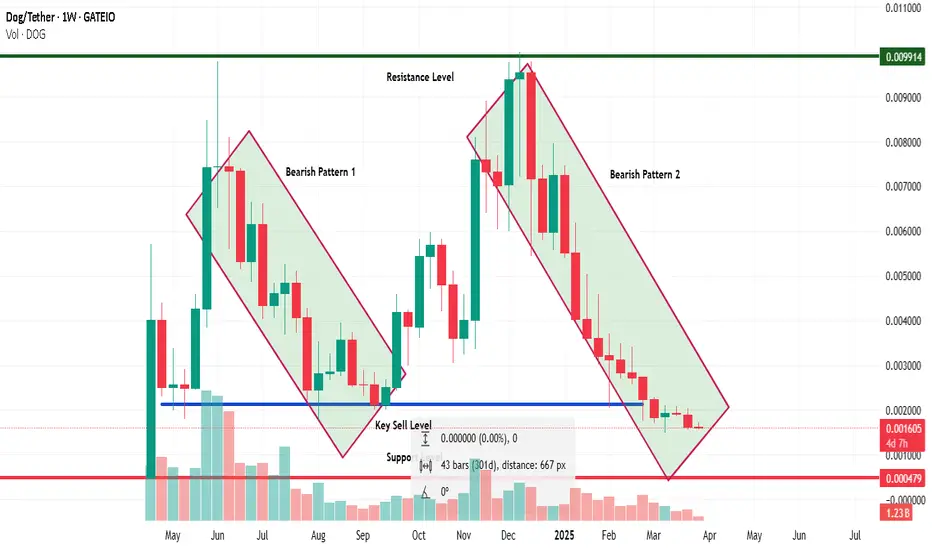
$DOG broke down major support levels After a double bottom DOG broke down the major support level of $0.002 hitting an ATL of $0.001
DOG is heavily being manipulated by the same wallets on Magic Eden (CEX) that keep selling.
RSI shows signs of DOG being heavily oversold.
If DOG loses $0.001 we could go all the way down to $0.005 a
DOG (Bitcoin) Technical Analysis: Bearish Momentum ExpectedDOG, the decentralized meme coin built on Bitcoin’s Runes protocol, is displaying strong bearish signals as it repeats a previously observed downward trend. The price is currently at $0.001641, having recently broken down from the key support level of $0.002121. Given the repeated bearish pattern, D
DOGDog finding support at these levels are supper bullish. SEED_ALEXDRAYM_SHORTINTEREST1:DOGS MC at these levels is a great time DCA into a position. With still no CEX listings DOG has so much attention on X as BTCs number one memecoin. Short term we'll most like see more CHOP over all in the market,
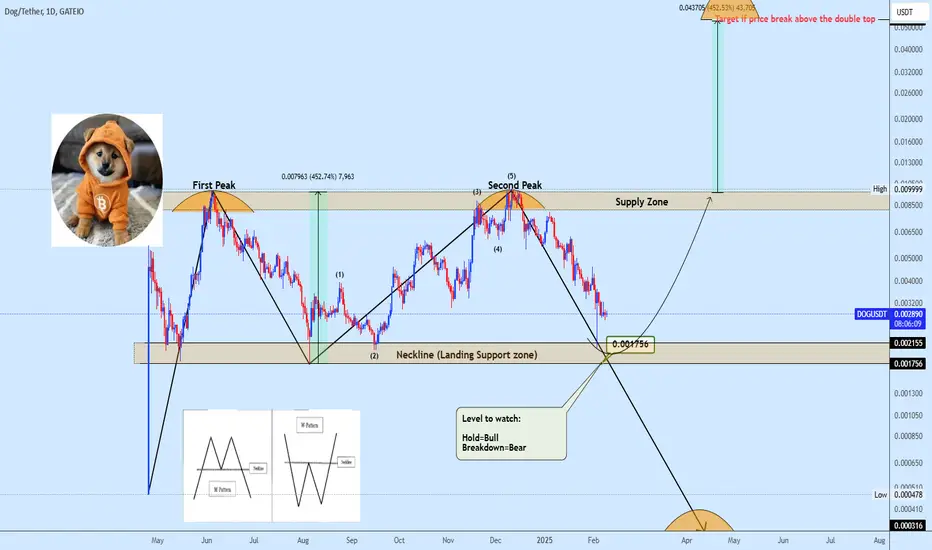
Dogusdt Double top: Will this breakdown or Hold? DOGUSDT is forming a potential double-top pattern, with price approaching the neckline zone, a critical level that will determine whether the pattern confirms or invalidates. The reaction at this level is key, as a strong hold could lead to a range-bound move, while a breakdown would signal further
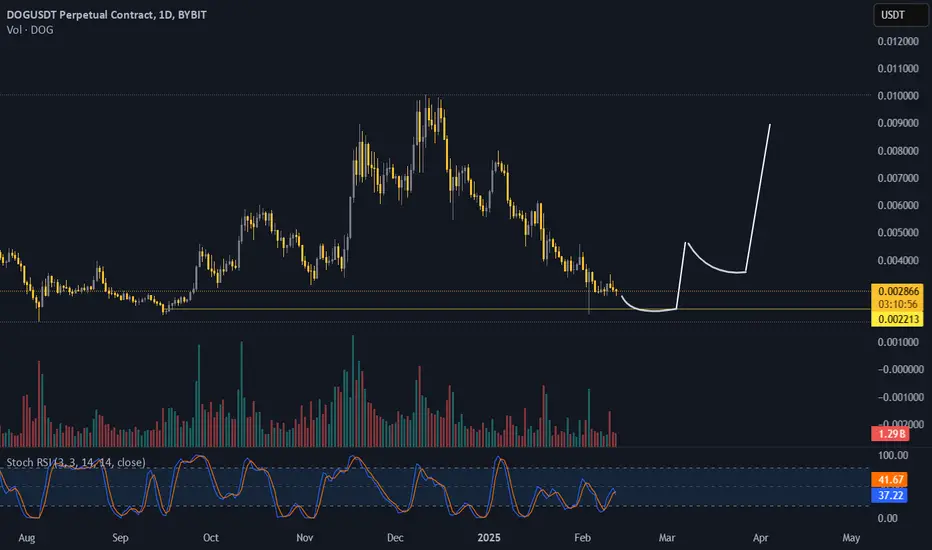
DOGUSDT LOOKING FOR AN UPTRENDAIGHT BYBIT:DOGUSDT.P today.. well when it gets to my alert and shows me signals we will start looking, stay patient keep an eye on this one.
DOGDOGs market cap is almost down to ATLs. These prices to me scream BUY. These are BUY levels. Markets have had nothing but good news in the US, I dont think we will see much more downside from here. Q1 post BTC halving seems to always have a rought january, if BTCs dominance can cool its effing jets,
See all ideas
Summarizing what the indicators are suggesting.
Oscillators
Neutral
SellBuy
Strong sellStrong buy
Strong sellSellNeutralBuyStrong buy
Oscillators
Neutral
SellBuy
Strong sellStrong buy
Strong sellSellNeutralBuyStrong buy
Summary
Neutral
SellBuy
Strong sellStrong buy
Strong sellSellNeutralBuyStrong buy
Summary
Neutral
SellBuy
Strong sellStrong buy
Strong sellSellNeutralBuyStrong buy
Summary
Neutral
SellBuy
Strong sellStrong buy
Strong sellSellNeutralBuyStrong buy
Moving Averages
Neutral
SellBuy
Strong sellStrong buy
Strong sellSellNeutralBuyStrong buy
Moving Averages
Neutral
SellBuy
Strong sellStrong buy
Strong sellSellNeutralBuyStrong buy
Displays a symbol's price movements over previous years to identify recurring trends.