DOTUSD (4H) - Bearish breakoutHi Traders
DOTUSD (4H Timeframe)
The market is in a downtrend and we are waiting for an entry signal to go SHORT below the 5.73 support level. Only the upward break of 6.06 would cancel the bearish scenario.
Trade details
Entry: 5.73
Stop loss: 6.06
Take profit 1: 5.54
Take profit 2: 5.21
Score: 9
Strategy: Bearish breakout
DOTUSD.P trade ideas

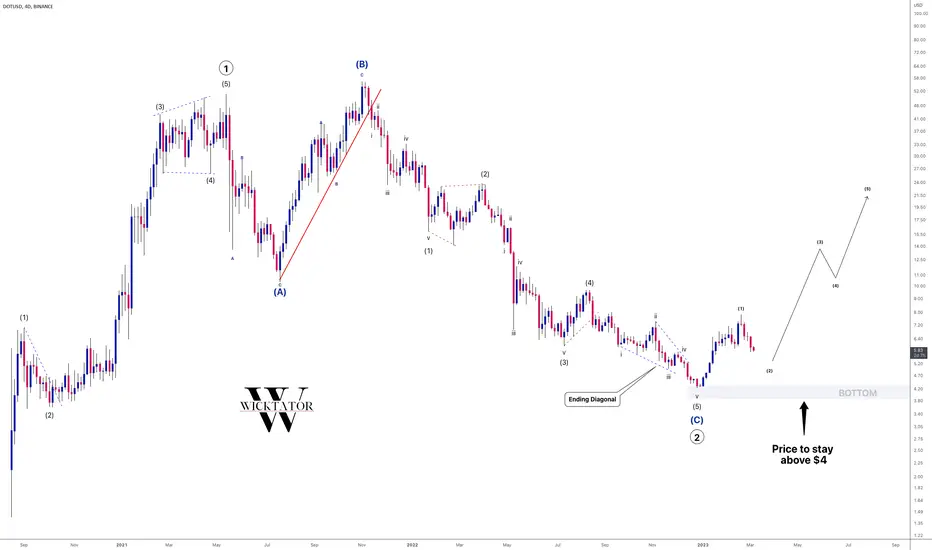
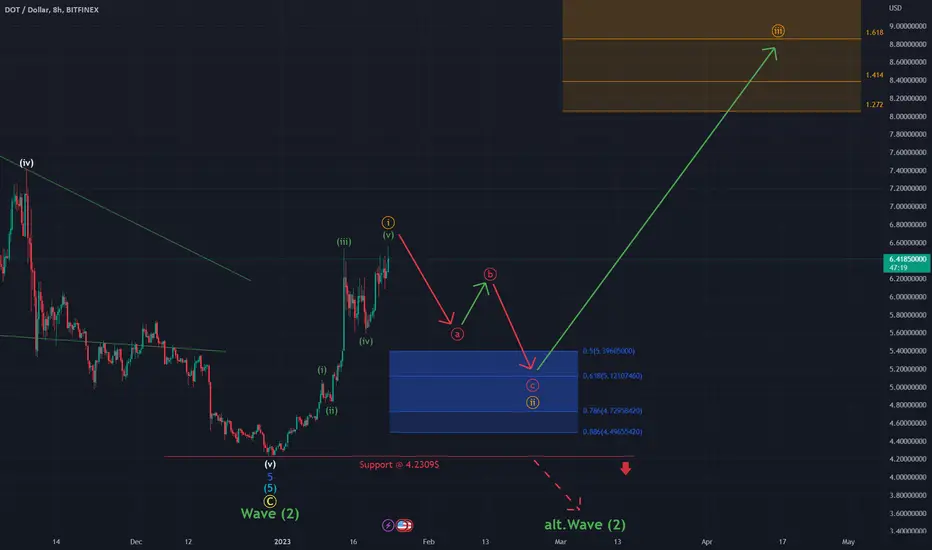
POLKADOT - BOTTOM IS IN!From looking at POLKADOT on a high timeframe, we can see that Polkadot has completed wave 2 PERFECTLY and the bottom is in.
We are now looking to ride wave 3, we made one impulse to the upside and now we are correcting that move.
See lower timeframe analysis for the breakdown.
Trade idea:
- Watch for the completion of the current correction
- Enter at the break of wave 2, stops must be below the bottom
- Targets: 14, 24, 54, HODL the rest
Goodluck and as always, trade safe.
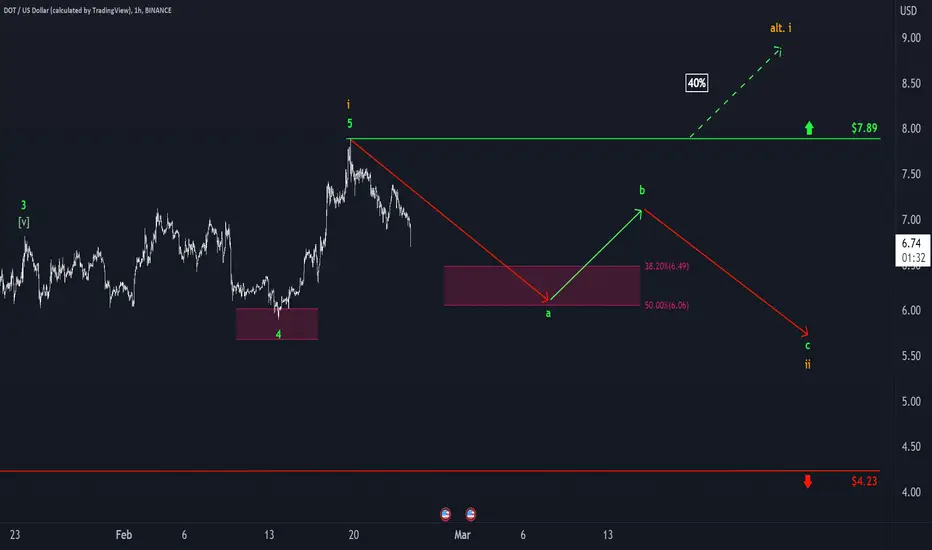
Polkadot: On the Dot ⌚️Polkadot has already made further progress in our primary scenario and should continue the downwards movement. We expect our crypto-friend to arrive in the magenta-colored zone between $6.49 and $6.06 on the dot to finish wave a in green. Then, the altcoin should apply itself to the countermovement of wave b in green, which should lead out of the magenta-colored zone but stop before the resistance at $7.89. Afterwards, Polkadot should take another southwards step by completing wave c in green as well as wave ii in orange. Alternatively, there is a 40% chance that Polkadot could climb above the resistance at $7.89, thus shifting the recent high upwards by developing wave alt.i in orange.
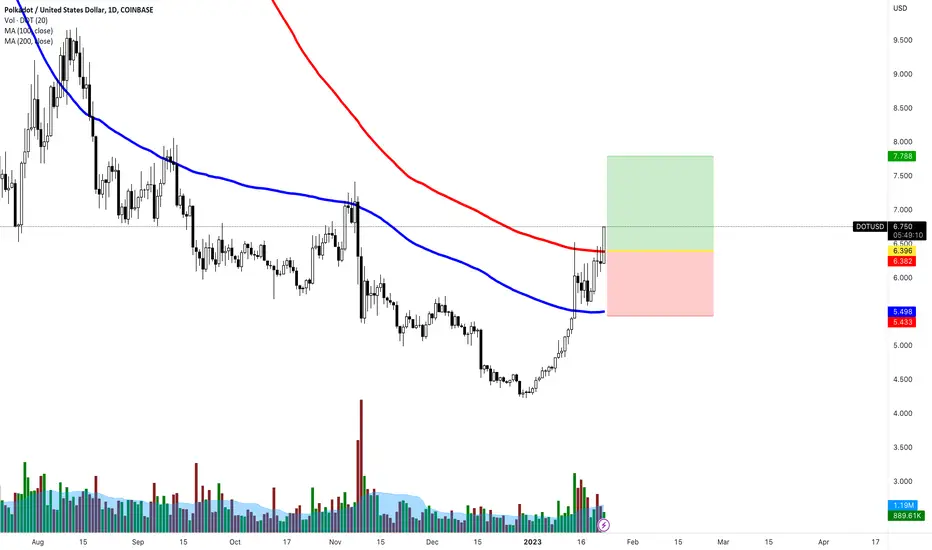
My PolkaDot Buy ZoneOne of these days Dot is going make me some money, not today, but one of these days, maybe..
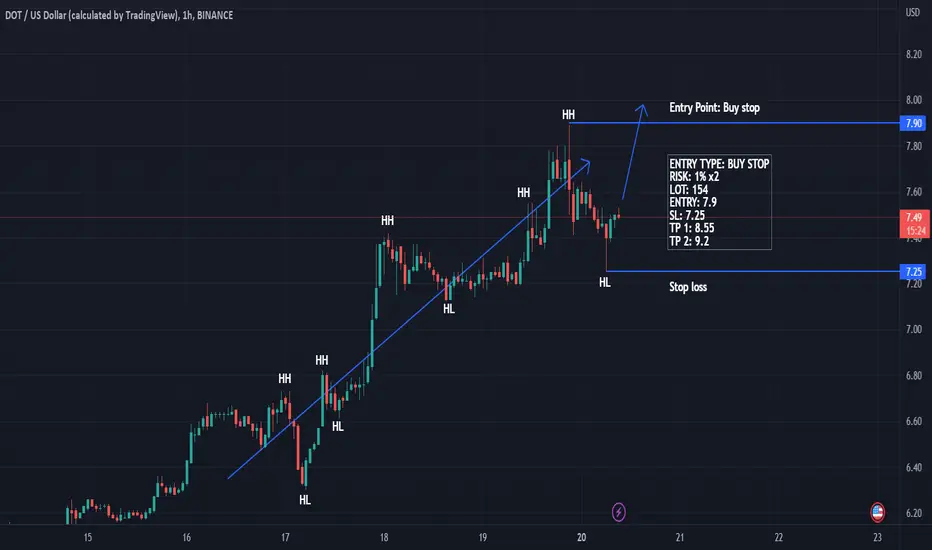
DOTUSD - Crypto | Bullish TrendDOTUSD is a Crypto coin and it is showing a Bullish Trend with HHs and HLs . It is expected that this trend will continue further.
Reinvesting DOT profits JUST CRUSHED a prior trade. TAGGED below! :-)
I'm taking those profits and taking this trade! =-)

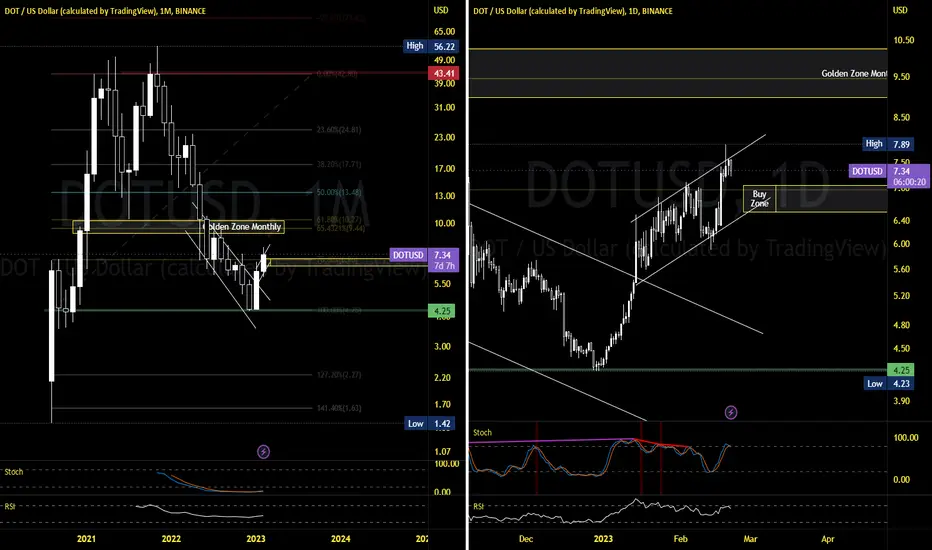
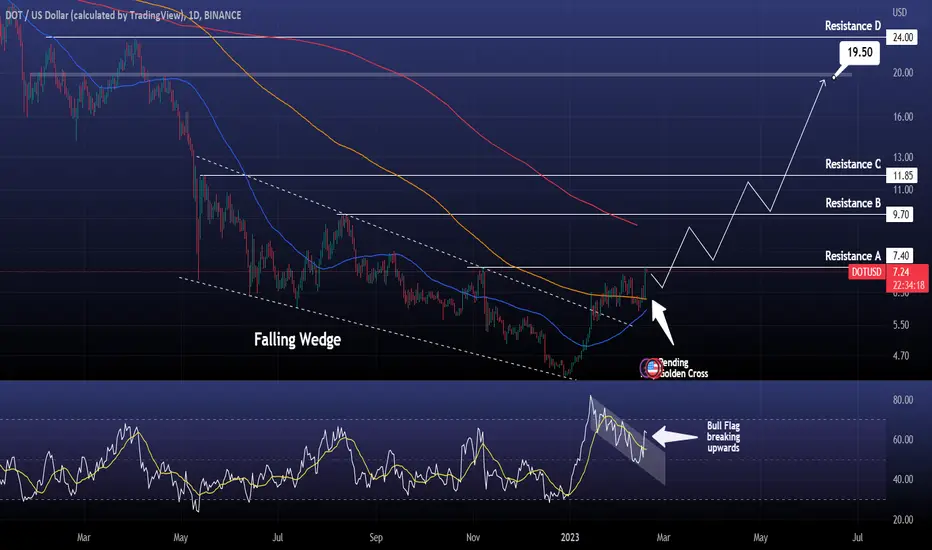
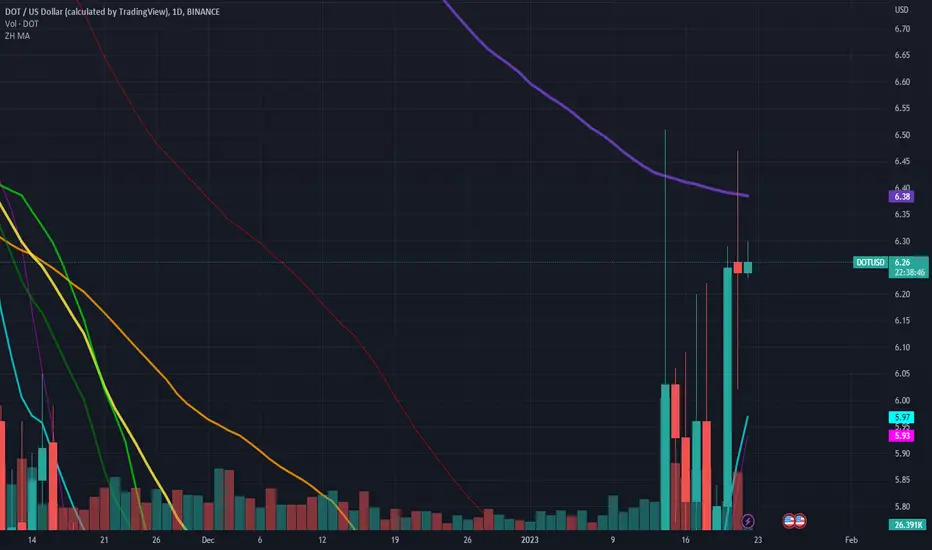
DOTUSD Roadmap to $19.50 - 24.00DOTUSD/ Polkadot hit the 7.40 Resistance A, filling the gap of November 7th. We are about to form a 1day Golden Cross and the next MA Resistance is the 1W MA50 but the gap to fill is on Resistance B at 9.70. We can see a strong bullish wave in the next two months with the 1day MA50 supporting. If Resistance C breaks, a huge bullish leg is expected within 19.50 and 24.00.
Follow us, like the idea and leave a comment below!!
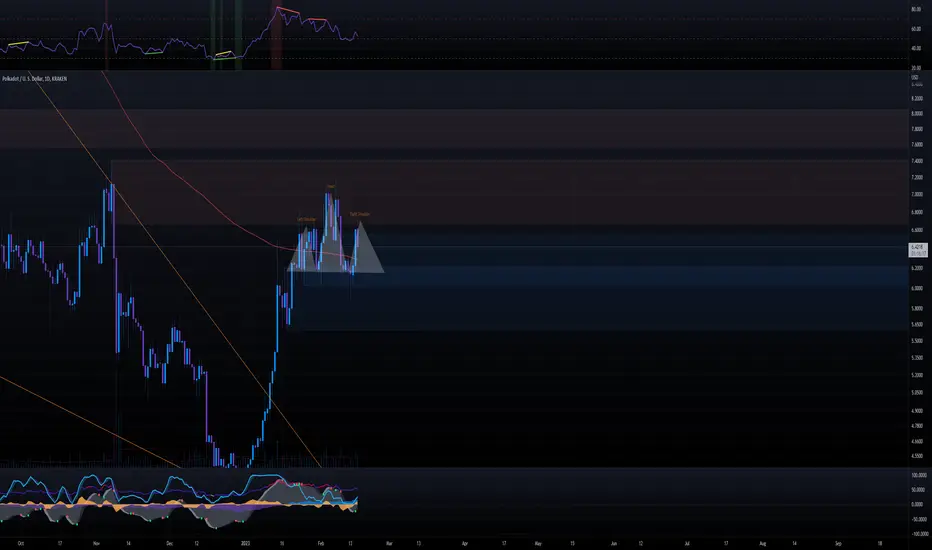
dot dumpdot is forming a head and shoulders on the daily, as the alt cap begins to look week and btc to be rejected at 25k. i expect dot to go under $6. but also look for support around the $6 area. rsi continues to weaken which is another sign
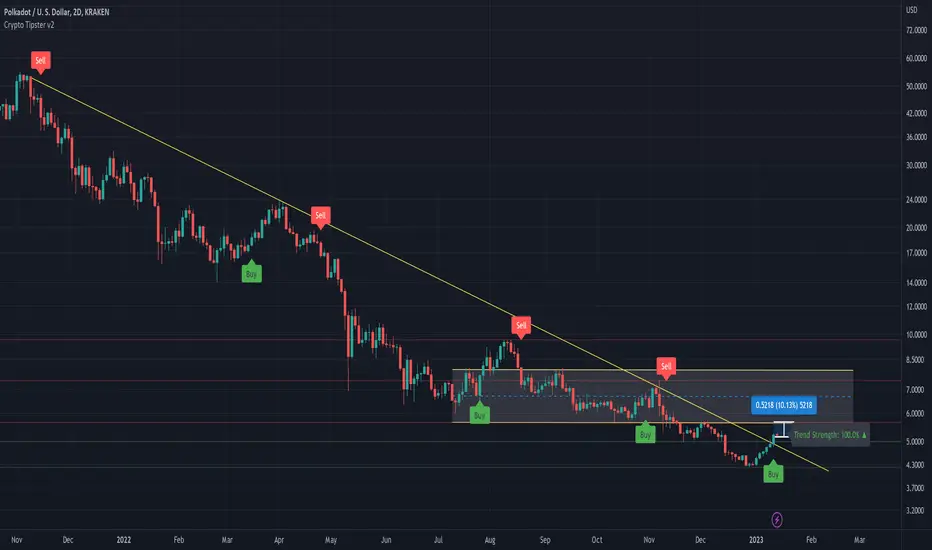
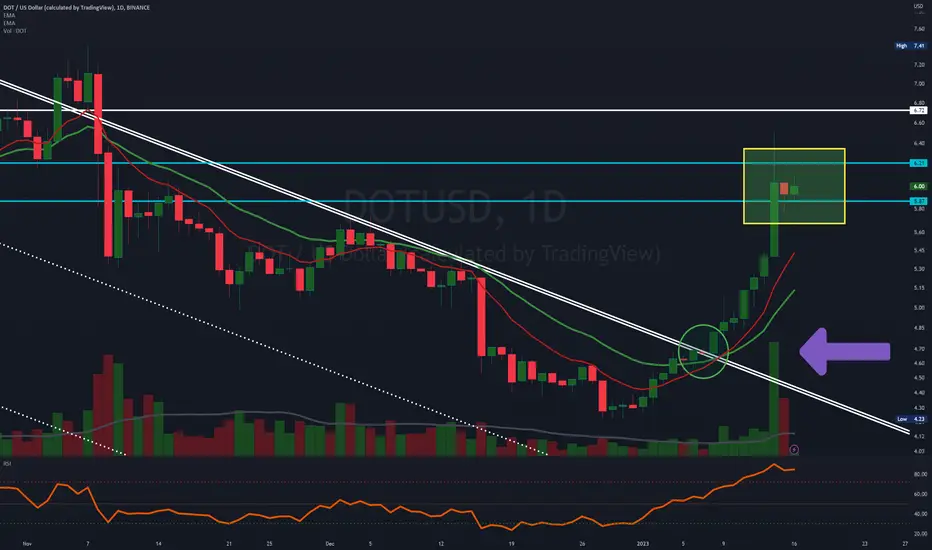
DOTUSD - A Quick 10% Gain After Breaking Trend LinePolkadot seems to have just broken through that long descending trend line after testing this line a few times historically. There's a good area for the price to head to of recent consolidation so we'll be aiming for around 10% gains to reach the bottom edge of this area after a Buy signal from Crypto Tipster v2.
If you enjoyed or agree with this idea - drop us a comment, like & follow! :)
***
DOTUSD Potential for Bullish Continuation| 26th January 2023Looking at the H4 chart, my overall bias for DOTUSD is bullish due to the current price being above the Ichimoku cloud , indicating a bullish market. With price tapping into my buy entry at 6.124, where the overlap support and 23.6% Fibonacci line is, we are looking to take profit at 7.415, where the previous swing high is. Stop loss will be placed at 5.704, where the previous overlap support is.
Any opinions, news, research, analyses, prices, other information, or links to third-party sites contained on this website are provided on an "as-is" basis, as general market commentary, and do not constitute investment advice. The market commentary has not been prepared in accordance with legal requirements designed to promote the independence of investment research, and it is therefore not subject to any prohibition on dealing ahead of dissemination. Although this commentary is not produced by an independent source, FXCM takes all sufficient steps to eliminate or prevent any conflicts of interest arising out of the production and dissemination of this communication. The employees of FXCM commit to acting in the clients' best interests and represent their views without misleading, deceiving, or otherwise impairing the clients' ability to make informed investment decisions. For more information about the FXCM's internal organizational and administrative arrangements for the prevention of conflicts, please refer to the Firms' Managing Conflicts Policy. Please ensure that you read and understand our Full Disclaimer and Liability provision concerning the foregoing Information, which can be accessed on the website.

DOTUSD Potential for Bullish Continuation| 26th January 2023Looking at the H4 chart, my overall bias for DOTUSD is bullish due to the current price being above the Ichimoku cloud, indicating a bullish market. With price tapping into my buy entry at 6.124, where the overlap support and 23.6% Fibonacci line is, we are looking to take profit at 7.415, where the previous swing high is. Stop loss will be placed at 5.704, where the previous overlap support is.
Any opinions, news, research, analyses, prices, other information, or links to third-party sites contained on this website are provided on an "as-is" basis, as general market commentary, and do not constitute investment advice. The market commentary has not been prepared in accordance with legal requirements designed to promote the independence of investment research, and it is therefore not subject to any prohibition on dealing ahead of dissemination. Although this commentary is not produced by an independent source, FXCM takes all sufficient steps to eliminate or prevent any conflicts of interest arising out of the production and dissemination of this communication. The employees of FXCM commit to acting in the clients' best interests and represent their views without misleading, deceiving, or otherwise impairing the clients' ability to make informed investment decisions. For more information about the FXCM's internal organizational and administrative arrangements for the prevention of conflicts, please refer to the Firms' Managing Conflicts Policy. Please ensure that you read and understand our Full Disclaimer and Liability provision concerning the foregoing Information, which can be accessed on the website.

DOT - Upcoming Opportunity 2.0First things first, I had to simplify a lot of counts in Polkadot for this analysis because some of the movements are much more complex than in VeChain or Solana. The Macrocount and especially the large C-Wave (Yellow - 2D Chart) are affected, if someone wants to see the complex version just write me a message.
Polkadot is one of the more interesting projects out there and is one of the few coins that managed to establish an overshooting (B) Wave last November. Additionally, this coin attracted a lot of momentum in the last bullrun and seems to be another candidate who could survive this bear market.
Nevertheless, Polkadot crashed since last November and lost almost 92% of its value, there are coins who suffered even worse but overall, that’s an impressive loss. We choose to share our macrocount in polkadot which is just like I said before a heavily simplified long-term view.
Now to the good news, the coin managed to gain more than +55% in the last weeks and I estimate that we established a well-structured bullish impulse. In the next hours, I anticipate that the price will advance further and should end the whole bullish wave (i) impulse. The trend should shift in the next days, and it’s very likely that the next days or weeks will be dominated by wave (ii).
As in all other coins, I highlighted our blue buy zone on the chart, which ranges from 4.23$ - 6.56$. The price should enter this zone and new investors can take this opportunity to accumulate coins. After this correction, the price has only one goal, to build up massive momentum and break above the last high and finally 8$.
We will continue to build up long positions in the blue Fibonacci zone too!
Same as in Vechain, there is still a chance that Polkadot could expand further to the downside, but this really depends on how Bitcoin and Ethereum behave in the upcoming correction.
Please notice that we are already invested Polkadot since the 29th of July, back then we announced our first positions here on tradingview .
Read the full statement here:
If you should have any questions whatsoever, you can write a comment or contact me directly!
Long Polkadot (DOTUSD)
AVERAGE EXECUTION PRICE: 7.33
STOP-LOSS: NONE
LONG TERM TARGET: 55$ and more!
DOTUSD (4H) - Bearish reversalHi Traders
DOTUSD (4H Timeframe)
Waiting for the downward break of 5.60 support level which will complete a bearish trend reversal pattern to go SHORT. Only the upward break of 6.21 would cancel the bearish scenario.
Trade details
Entry: 5.60
Stop loss: 6.21
Take profit 1: 5.27
Take profit 2: 4.88
Score: 4
Strategy: Bearish reversal

POLKADOT : Approach to important support area in medium termPOLKADOT : Approach to important support area in medium term
Crypto Analysis
Please, support our idea with Comment & Like 💖💖💖

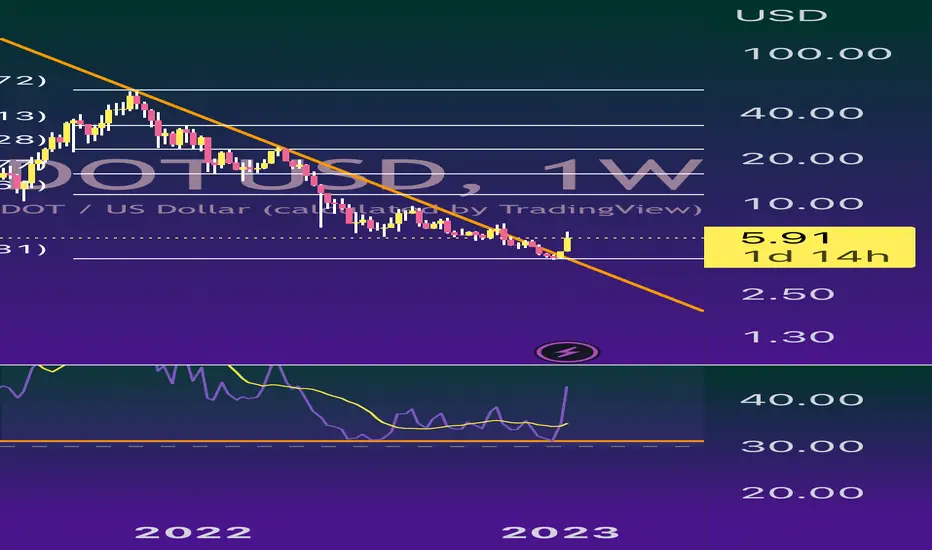
$DOT broke LONG TERM down trendDon't care for $DOT but you can't ignore this
RSI could be better but this looks GOOD
#PolkaDot
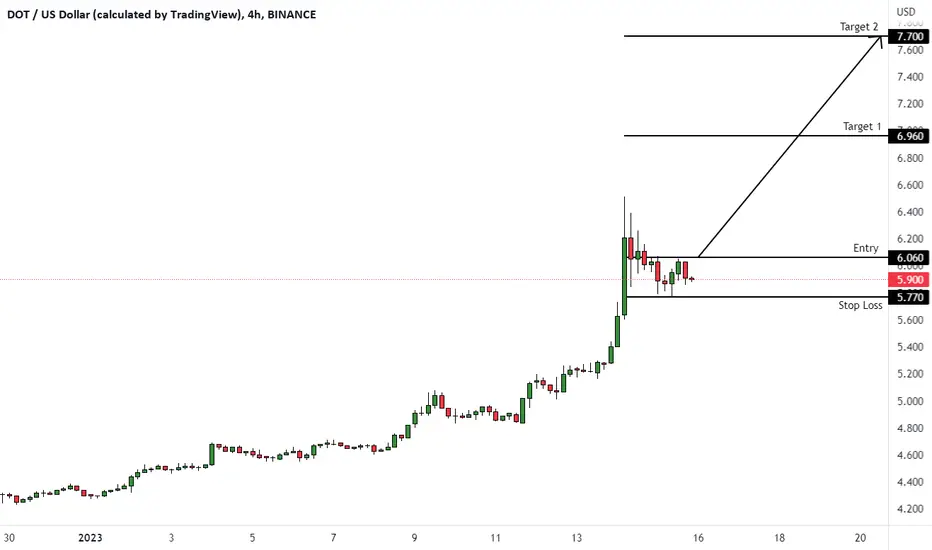
DOTUSD (4H) - Bullish wave We2Hi Traders
DOTUSD (4H Timeframe)
A high probability, entry signal to go LONG will be given with the upward break of 6.060 after the market found support at 5.770. Only the downward break of 5.770 would cancel the bullish scenario.
Trade details
Entry: 6.060
Stop loss: 5.770
Take profit 1: 6.960
Take profit 2: 7.700
Score: 9
Strategy: Bullish wave We2
Polkadot key levels, support and resistance levelsThe primary trend is short. DOT has reached the resistance zone. We are waiting for the secondary trend to break.
Key levels
Supports levels:
4.300
3.800
Resistance levels:
4.700
5.100
5.700

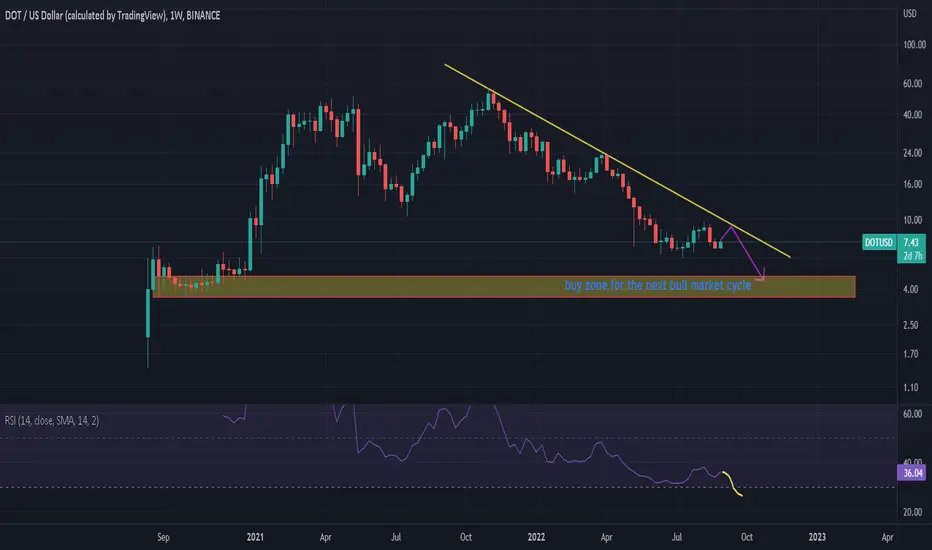
DOTUSD - one more leg down - SHORTDOTUSD remains in the downtrend.
A small pump to get rejected from the downsloping resistance line is still possible, however in our opinion one more leg down is coming. RSI has not been oversold yet.
The buy zone for the next bull market is between $4,70 and $3,50.
Don´t rush to buy.
Patience is a key
DOTy about the coinLooks like the weekly breakout coming with bull div
Targets as marked
Bears will be exterminated but not sure if this is a new cycle for crypto, really depends if dollar is about to crash
Watch the 1.15 EURUSD level
NOT TARDING ADVICE
GRI 2023
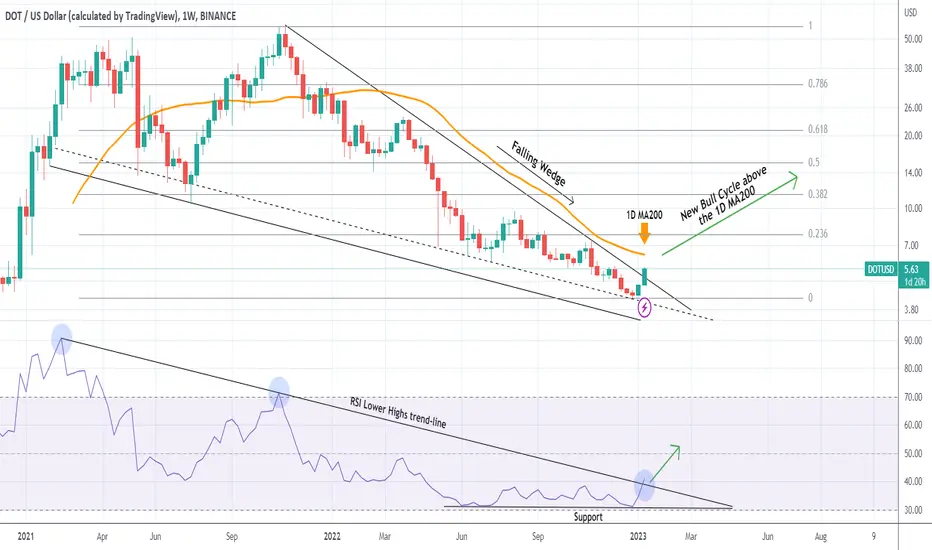
DOTUSD Broke above the 2 year Falling Wedge!Polkadot (DOTUSD) just broke above the Falling Wedge pattern that was in effect since early 2021. This 2-year pattern has been basically dictating the pace of the current Bear Cycle but as you see on this 1W chart, it eventually ran out of room, was trading tightly within its top (Lower Highs trend-line) and bottom (Lower Lows trend-line) in the past 2 months and eventually broke to the upside.
This alone is a major bullish development but we would like to see a closing above the 1D MA200 (orange trend-line) in order to confirm the end of the Bear Cycle. If broken, it will be the first time the price is above the 1D MA200 in more than a year (since January 05 2022). In that case, the Fibonacci retracement levels can be targeted in succession, with the 0.5 (Fib) at 15.50 estimated to get reached by August 2023.
A strong sign that shows that the market has priced its bottom is the 1W RSI, which has been flat on its Support since June 2022 and also broke above the Lower Highs trend-line that started all the way back to the February 2021 High.
-------------------------------------------------------------------------------
** Please LIKE 👍, FOLLOW ✅, SHARE 🙌 and COMMENT ✍ if you enjoy this idea! Also share your ideas and charts in the comments section below! **
-------------------------------------------------------------------------------
💸💸💸💸💸💸
👇 👇 👇 👇 👇 👇
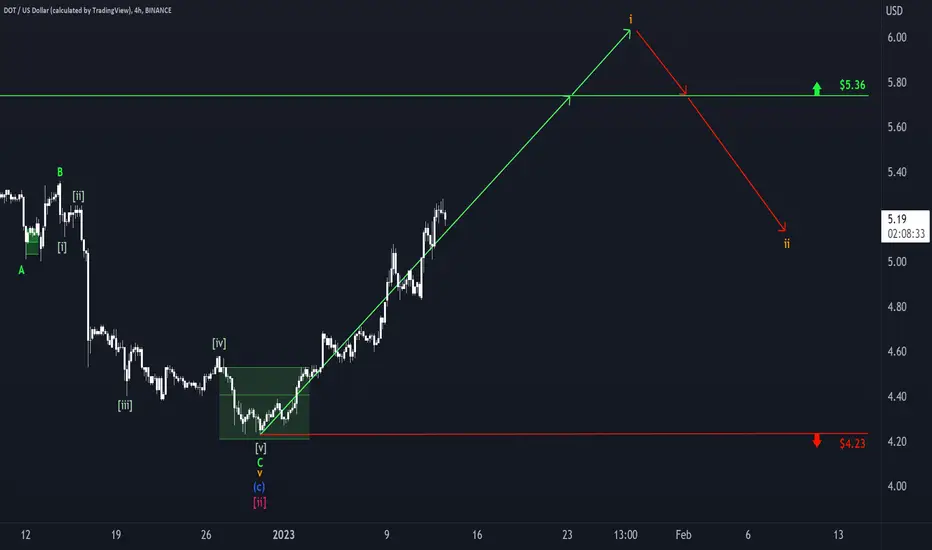
Polkadot: Lucky Day! 🍀The date may write Friday the 13th, but we're feeling pretty lucky. Polkadot continues to rise and should climb above the resistance line at $5.36 to finish the yellow wave i. After completion, the coin should fall into a correction and end the orange wave ii below the $5.36-mark.