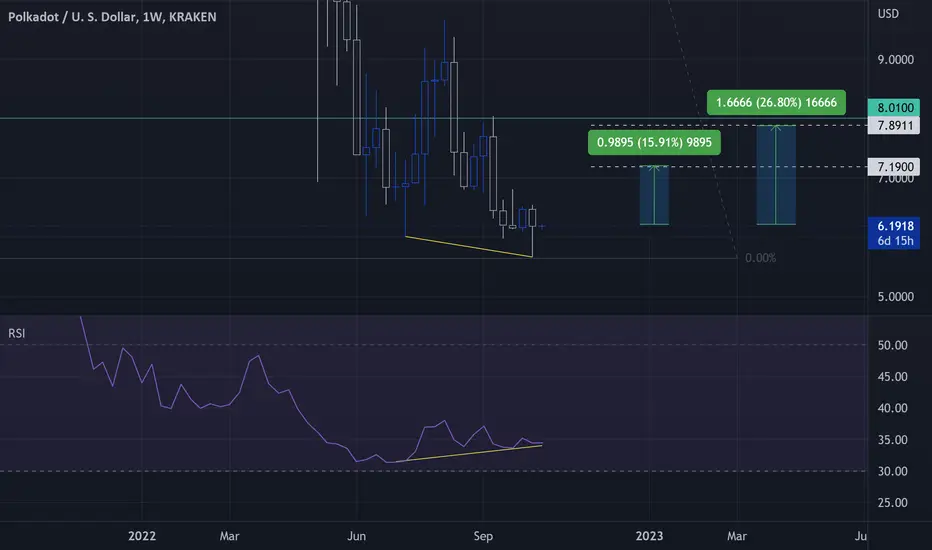
Polkadot Black Friday- Everything is in graph.
- Weekly predominant bullish divergence on RSI.
----------------------------------------------------------------------
- i won't speak "Price to Buy", but WHEN to buy :
----------------------------------------------------------------------
- Buy a Dip and wait for the end of this triangle.
or
- Buy a Breakout from the same triangle.
----------------------------------------------------------------------
- Black Friday is Real.
Happy Tr4Ding !
DOTUSD.P trade ideas
DOT/USDT 1DAY UPDATE BY CRYPTO SANDERS !!Hello, welcome to this DOT/USDT 1DAY chart update by CRYPTOSANDERS.
I have tried to bring the best possible outcome to this chart.
Show some support, hit the like button, and follow and comment in the comment section. this motivates me to bring this kind of chart analysis on a regular basis.
CHART ANALYSIS:-Polkadot (DOT), was another big gainer in today’s session, with prices moving closer to a four-week high.
Following a low of $4.84, DOT/USD managed to reach an intraday high of $5.16 earlier on Thursday.
As a result of this move, DOT broke out of a key resistance level of $5.15, hitting its strongest point since December 16 in the process.
As can be seen from the chart, the 14-day RSI has failed to move beyond its long-term ceiling of 68.00 and has since slipped lower.
Price strength is now tracking at 63.10, with DOT declining from its earlier peak, and the asset is trading at $5.09.
In order for the token to continue to move higher, there will first need to be a rally above its 68.00 points on the RSI.
This is not a piece of financial advice.
Hit the like button if you like it and share your charts in the comments section.
Thank you

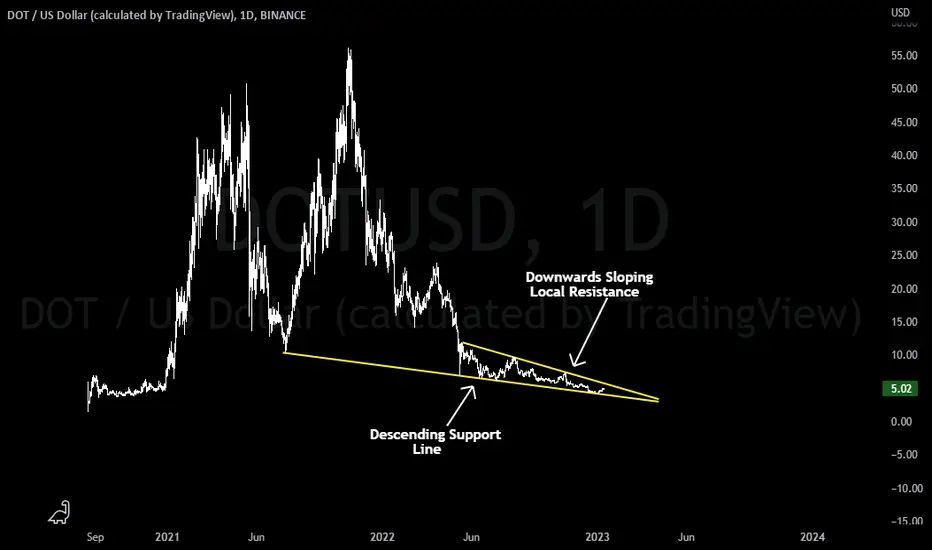
DOT Zones: Falling Wedge Breakout Incoming? Here we are looking at DOTUSD on the Daily TF…
For this analysis, we will keep it brief as the chart here is very simple.
As you can see we are in a falling wedge which consists of downwards sloping resistance and a descending line of support. The descending line of support stretches all the way to the lows (at the time) made back in July of 2021. Every time DOT has tested this line, it has bounced (so far), but we will continue to monitor the charts as the space between support and resistance continue to squeeze closer.
What do you think DOTUSD will do next? Let me know in the comments!
Cheers!

Cup and Handle Potential Bullish move on $DOT Cup and handle formation appears to be forming - if break out then resistance at trend line thats held since peak at NOV 2021

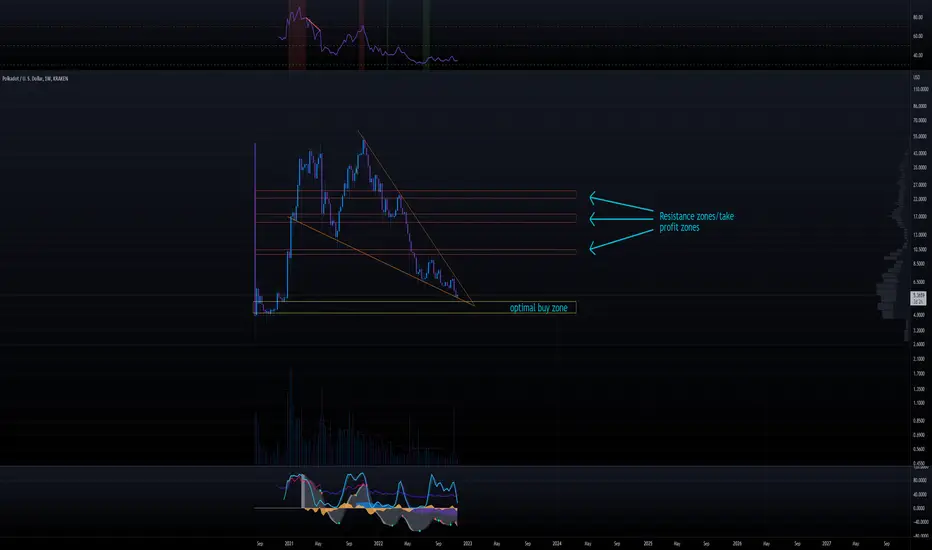
optimal buy for dotand we have finally made it to the optimal buy zone. we could always go lower but this chart is looking beautiful at the end of the massive falling wedge as well. this is a weekly chart so could take months for something to happen.

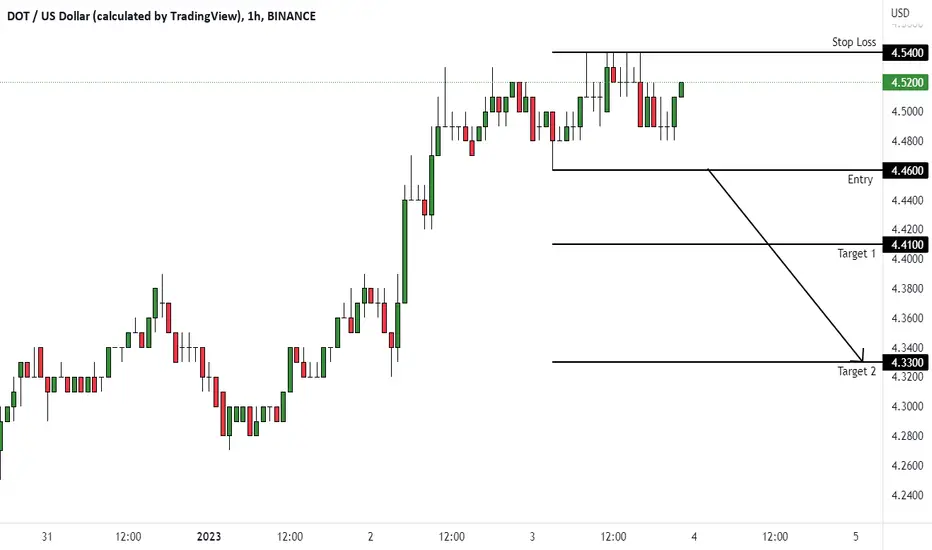
DOTUSD (1H) - Bearish reversalHi Traders
DOTUSD (1H Timeframe)
Waiting for the downward break of 4.46 support level which will complete a bearish trend reversal pattern to go SHORT. Only the upward break of 4.54 would cancel the bearish scenario.
Trade details
Entry: 4.46
Stop loss: 4.54
Take profit 1: 4.41
Take profit 2: 4.33
Score: 6
Strategy: Bearish reversal
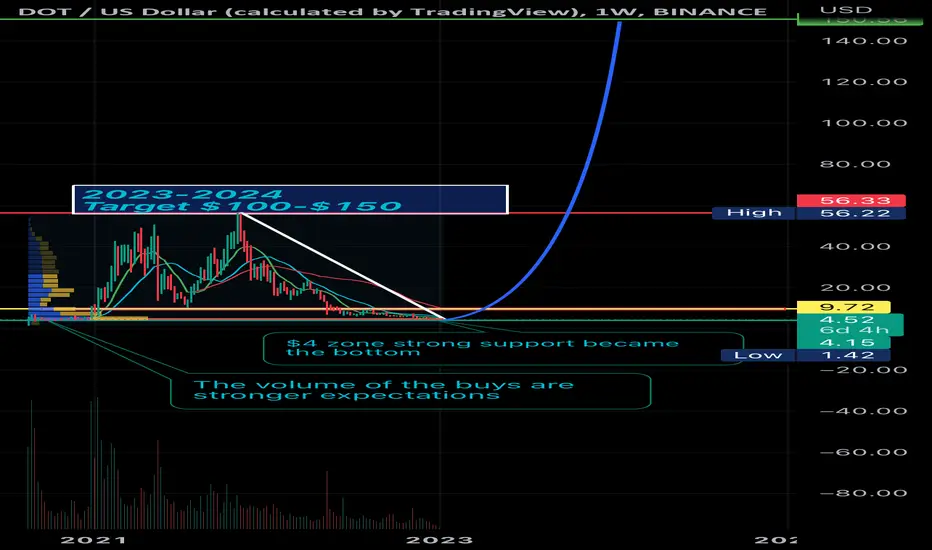
$4 zone became the bottom for Polkadot$4 are very cheapest
Can’t go lower than that. The buys volume are expected huge that buyers bought the dip and Dot has bottomed.
100 to 150$ is the target high. Good luck y’all
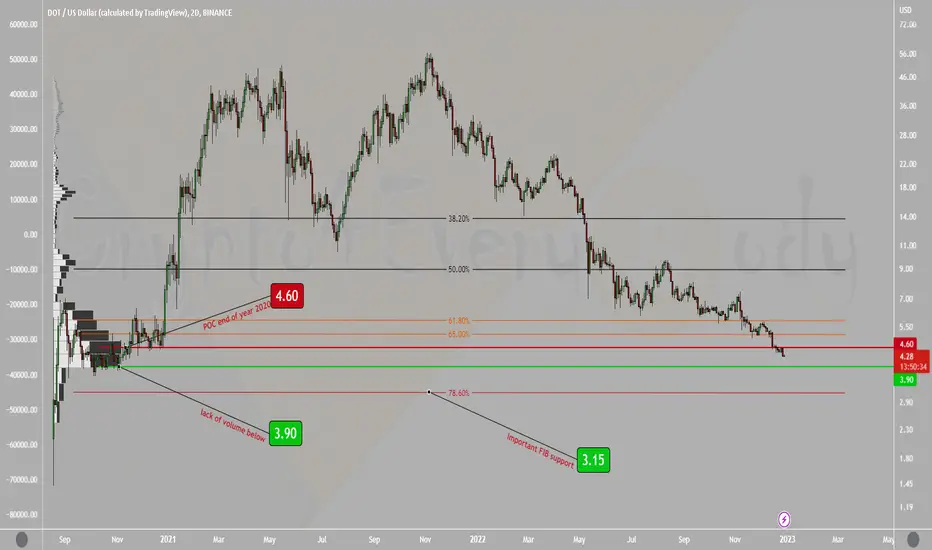
Polkadot - DOT lost important volume profile support at $4.60👀PolkaDot lost important volume profile support at $4.60👀
Next lower volume support at $3.90 - if it breaks a lack of volume will lead DOT to $3.15 - logFIB 78.60%
First bullish signs for DOT after breaking above $4.60 and logFIB golden pocket again.
Let me know your thoughts in the comments🤗
⬇️⬇️⬇️
Likes and Follow for updates appreciated🤗
Disclaimer:
Not financial advice
Do your own research before investing
The content shared is for educational purposes only and is my personal opinion
PolkaDot on the 1.6iv Fibo levelshark harmonic pattern:
1.61 iv=4.47
1.61 BC=3.6 and the price action level
the target of (4) wave:
2.24 iv-v=24

DOT Slow BleedI don't really see support until around $3.50. DOT just keeps putting in new lows, contrary to the market. Short the relative weakness until it regains the EMA 8 in a substantial way or another MA.

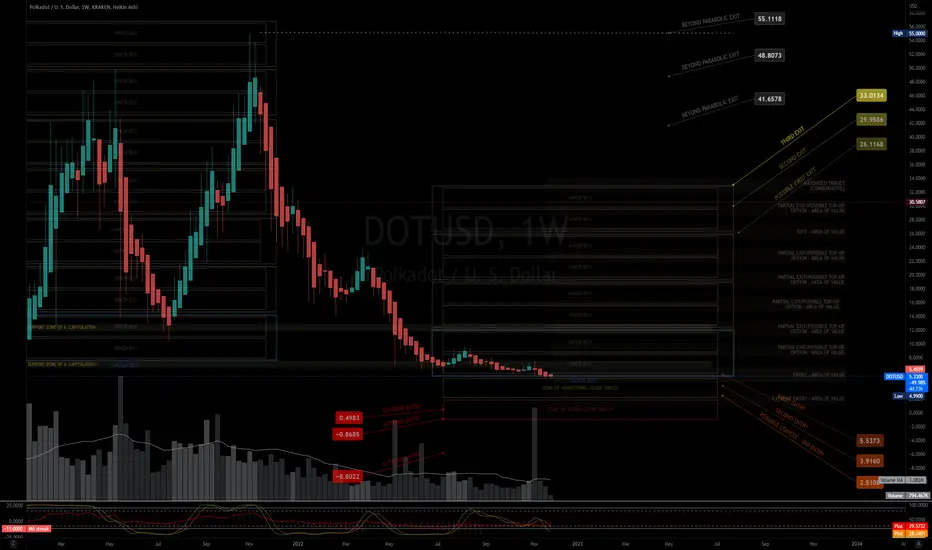
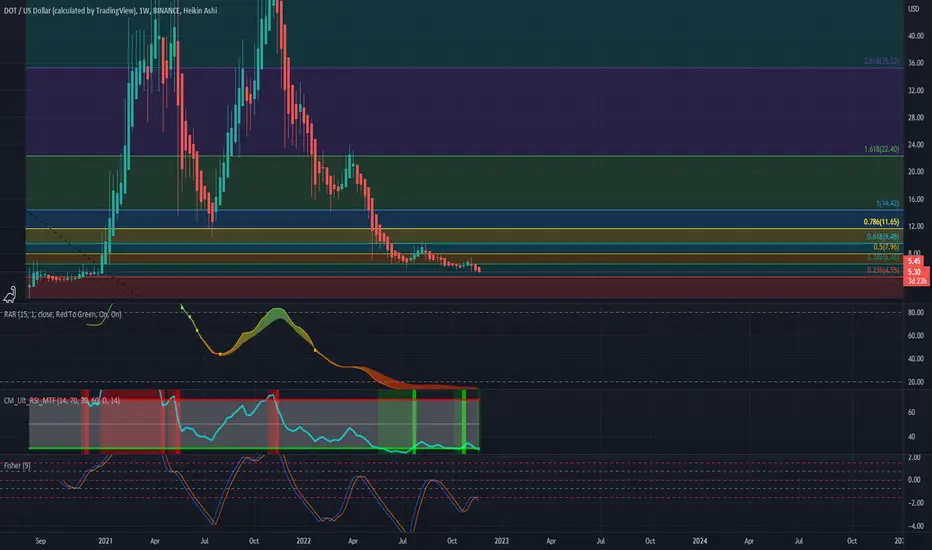
$DOT : POLKADOT Road Map$DOT
On a Weekly Chart
LONG POSITION -MOMENTUM STRATEGY - SWING
11.30.22
0913H +8 SINGAPORE
Disclaimer:
The findings of the following analysis are the sole opinions of the publisher of this idea and should not be taken as a piece of investment advice.
My Published Ideas are not 100% Accurate. There are many factors at a given time that can change the forecast.
ALERT:
Forecast Entries for a BULL SWING.
Smart money wants a REBOOT of 2018 and all is possible for the forecasted entries based on numbers and the character of the market Let us see how price action reacts on a DAILY chart .
Hoping that this BENTO BOX CHART ANALYSIS will efficiently help you with your DYOR as we Enter a NEW SWING CYCLE for LONG positions, either short, mid, or long term.
INSTRUCTIONS:
HOW TO USE THIS MINIMALIST CHART a.k.a (Bento Box)
"Follow the white rabbit!"
Just Follow the TOPS and BOTTOMS of the BOXES as a GUIDE to where the MARKET will take you.
If it cannot break a TOP or BOTTOM of a BOX, It signifies a reversal.
TARGET ZONE IDENTIFICATION:
The LARGE BOXES (Tops and Bottoms) are MAJOR turning points that will occur sometime in the future. While the SMALL BOXES (Tops and Bottoms) are MINOR turning points.
These can be entries to a BUY/ SELL POSITION, EXIT/PARTIAL EXIT/TOP-UP AREAS, as well as Support and resistance levels
Also includes MAXIMUM TARGET EXIT AREA OF VALUE - CONSERVATIVE (If price action conditions are right at that given moment.)
NOTE:
1. That PRICE TARGETS for ENTRY and EXITS are DYNAMIC and can CHANGE from time to time.
2. Created using data on a MONTHLY, WEEKLY & DAILY Analysis of a MARKET'S CHARACTER.
3. My BENTO BOXES are designed for SWING TRADES at the LOWEST or START of a SWING CYCLE.
4. At times I will include a WAY BEYOND PARABOLIC PRICE TARGET, depending on The Character of the Market (CRYPTOS ONLY).
5. DYOR for your Fundamentals, Volume , Chart Patterns, Candlestick Math, FIB COILS ( ABC ), Price Action, FIB LEVELS, Market Dynamics, AB=CD Pattern especially institutional and retailer trading psychology .
Wishing you all The Best Trades and Thank you all for your Appreciation and Support of My Work.
Much thanks to My 3 Mentors. They are so much of a Blessing that I also wish to share my knowledge.
Vive Le Autist!
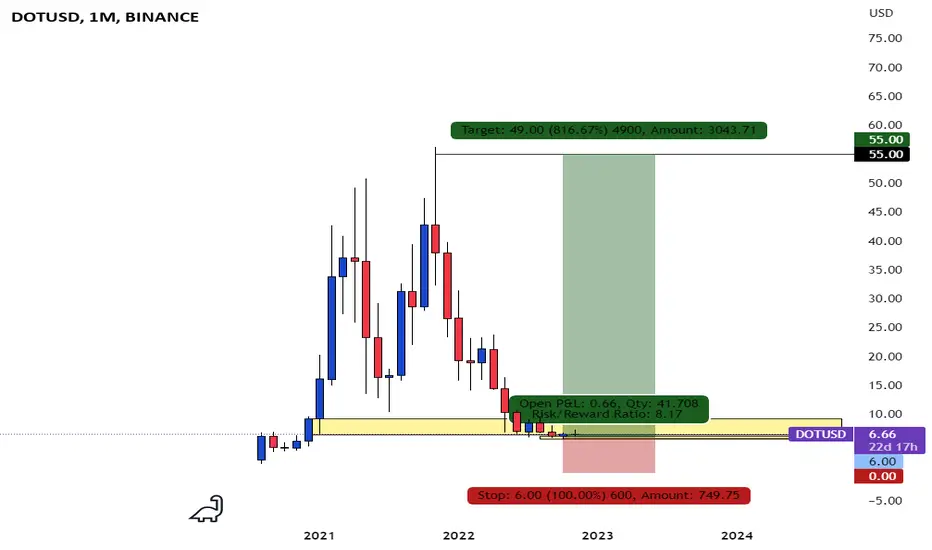
DOTUSD [Engulfing Candlestick] Target Price is 5.5220. Engulfing Candlestick formed at Pivot Point at price level 5.2538.

dot looking like a good buythis is my long term dot strat, this is a weekly tf so this could take a very long time to play out. but dot and its eco system is so oversold and looking like some really good buys now in the the short term. been in a falling wedge for quite some time now. im a buyer anywhere from $4 to $5. not financial advice im willing to accumulate dot all next year if needed. this may not be quite the bottom yet be we are very close.
DOTUSD Accumulation . 6 months+ - 1year+ HOLDDOTUSD Buy : 5.5$
DCA : 4.8$ , 3.8$
Hold 6months - 1.5 years
3xbuy signals
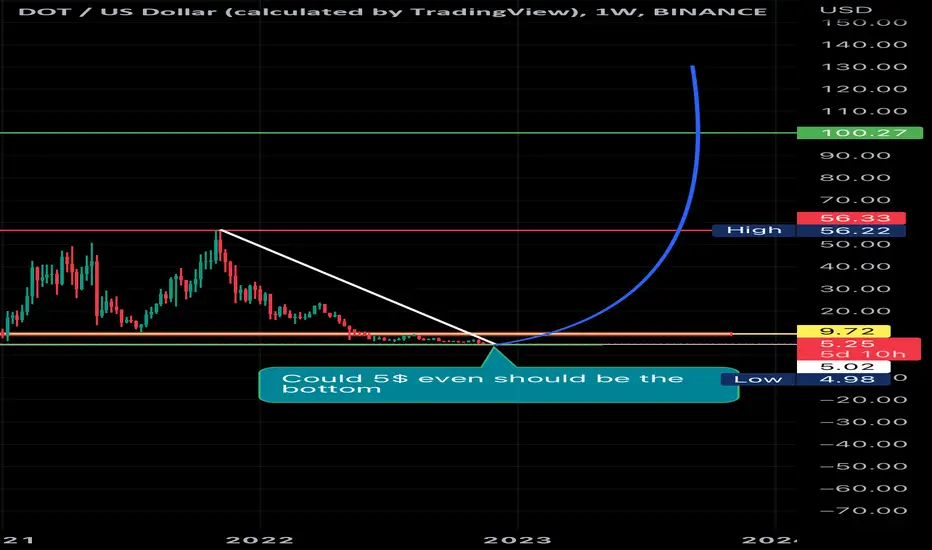
DOTUSD SHOULD BE BOTTOMED NOW Dip under 5$ ended up with a bullish dragonfly doji.
And we are up up.
We are bottomed.. buy and hold.
Target is over 100$ for ATH

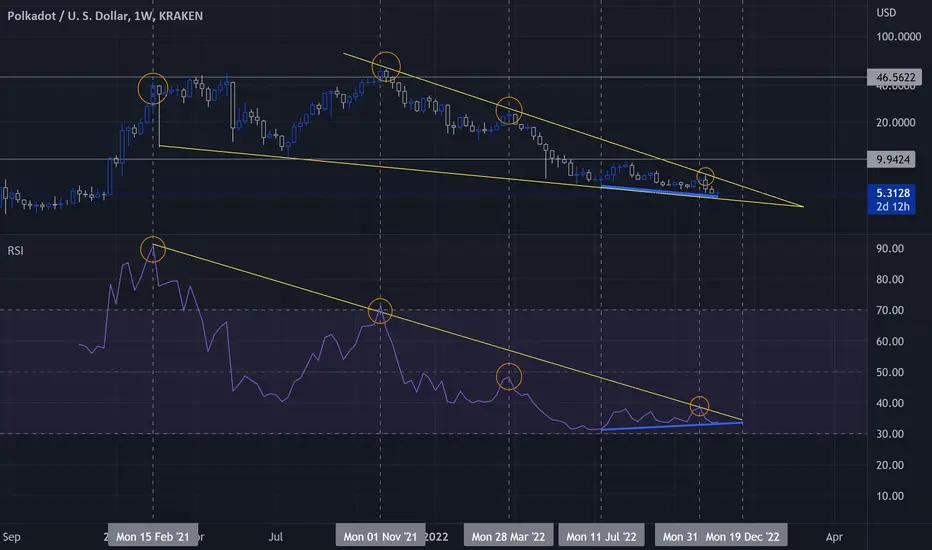
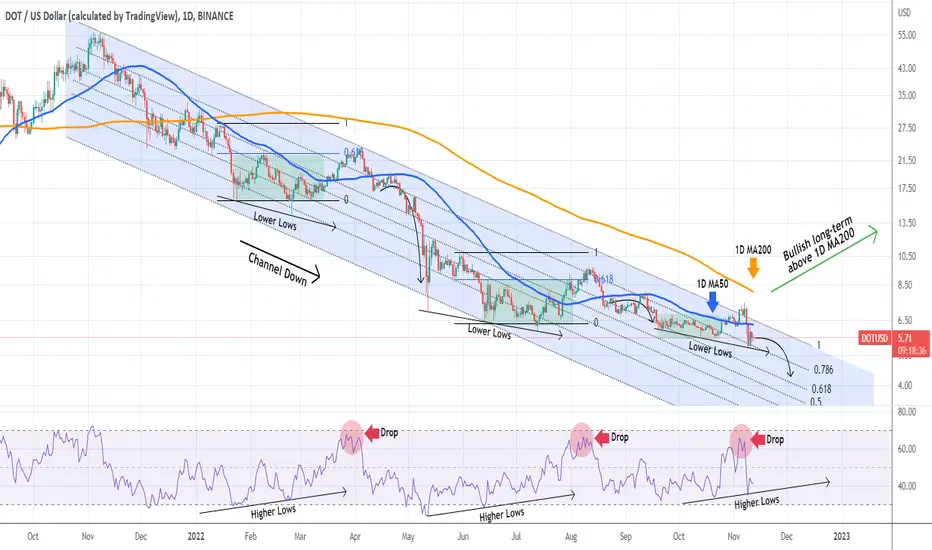
DOTUSD Can't stop this death spiral unless the 1D MA200 breaks.Polkadot (DOTUSD) has been trading within a Channel Down pattern since the November 08 2021 High. Our previous DOT analysis was on July 16, which hit its target with the help of that pattern:
In early November the price broke above it marginally but as it failed to cross the 1D MA200 (orange trend-line), the 1D RSI formed a top (red circle) and caused the price to drop. As you see, this pattern is consistent with both previous Lower Highs, a 1D RSI on these levels forms a top and causes the price to drop aggressively.
This 'Death spiral' can only stop with a break above the 1D MA200, which is the Resistance since January 05. Until then, we can expect DOT to make a new Lower Low either on the 0.786 Fib around 5.00 or even lower on the 0.618 Fib (4.50 - 4.00) before the end of the year.
-------------------------------------------------------------------------------
** Please LIKE 👍, SUBSCRIBE ✅, SHARE 🙌 and COMMENT ✍ if you enjoy this idea! Also share your ideas and charts in the comments section below! This is best way to keep it relevant, support me, keep the content here free and allow the idea to reach as many people as possible. **
-------------------------------------------------------------------------------
You may also TELL ME 🙋♀️🙋♂️ in the comments section which symbol you want me to analyze next and on which time-frame. The one with the most posts will be published tomorrow! 👏🎁
-------------------------------------------------------------------------------
👇 👇 👇 👇 👇 👇
💸💸💸💸💸💸
👇 👇 👇 👇 👇 👇

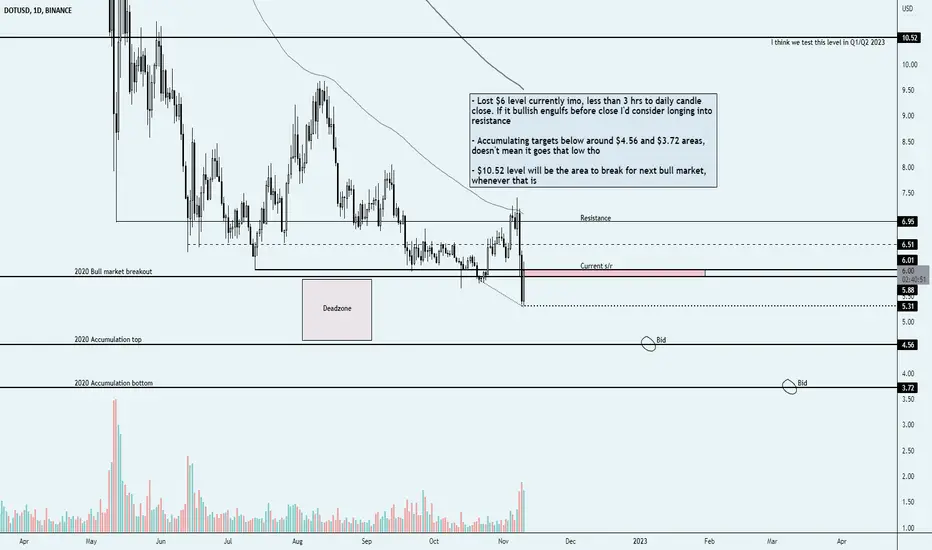
Polkadot - I'm Interested..Polkadot is one I am eyeing closely for the next bullrun - with everything going on with Solana who knows what develops over the coming months/year.
I have my bids below if we get there, but clearly short-term resistances above and a key s/r level we're trading below as of now.
Daily candle closes in a couple hours and I think that will be telling of where it heads in the coming weeks.
Let me know your thoughts in the comments!
Cheers
DOT: Cycle bottom in at $4.3?DOT could be trading in a 1:1.618 ABC expanded flat correction with bottom targets at the cluster of fibs/support at ~$4.3. Dot just crossed another fib ring, so good chance the breakdown is coming soon. Looking at the volume profile, the most amount of DOT accumulated was also at $4.3. As DOT capitulates, I'd like to see more volume come in to signify a bottom.