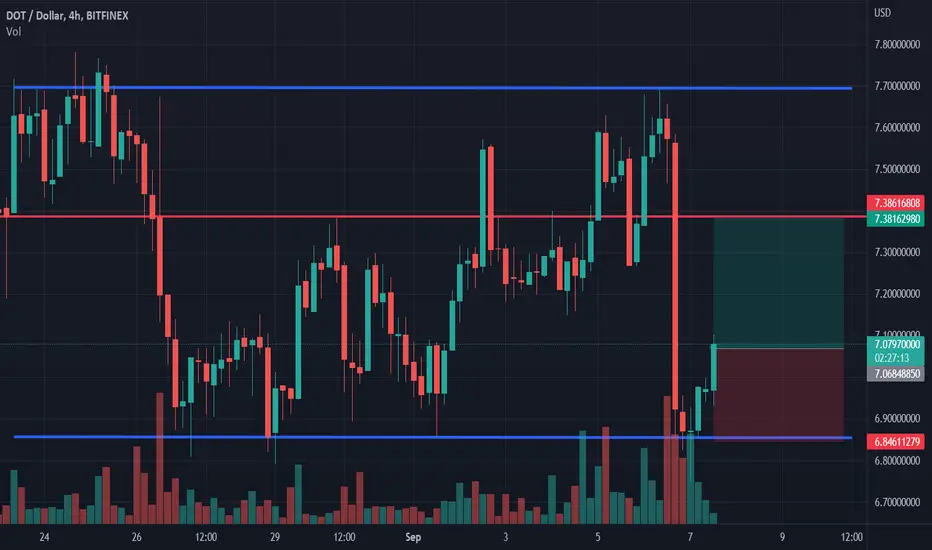
Ever seen a 🐳 w/ a POLKA #DOT tail? DOT/USD 12hr trade set up.
Looking to go long if price action confirms $6.80 as support (Entry option #1).
W/ a break down of $6.80 I will be looking to $6.44 to see if this level confirms as support (Entry option #2)
Most Alts pose a bit higher risk at the moment due to the possibility of Bitcoin breaking down while it flirts with 19.3-19.5k but they also pose a higher reward.
Entry 1: $6.80
Target 1: $7.90
Target 2: $8.60
Stop Loss: 4% below entry based on your own risk.
Entry 2: $6.44
Targets: Nothing changes
Stop Loss: 4% below entry based on your own risk.
Never trade with out a stop loss unless you want your swing trade to turn into a HODL position.
Should support break down and confirm, I will be looking for another Entry at #2.
DOTUSD.P trade ideas

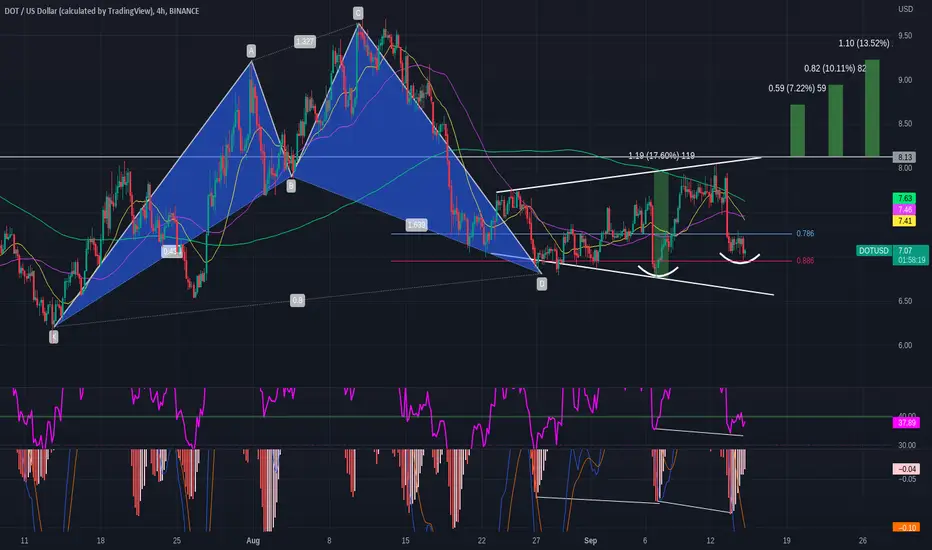
$DOT/Broadening Wedge In the Money Zone (PENDING)$DOT has formed a nice broadening wedge at the 886 range from the last swing high to swing row and is now trying to establish/validate a new local higher low above $6.76 at the $7 range. The MACD and RSI has printed hidden bullish divergence on both oscillator's indicating that momentum is started to build back up to possibly break through the top of the wedge and have a nice run...
We were due for a pullback after the last few weeks being manly green candles.. Overall, this is healthy price action and I don't think anyone should be panicking, as this is just traditional price action after a good few weeks for crypto...We also got some good news from the ETH merge.
Cheers
**DISCLAIMER, THIS IS NOT AN ACTIVE TRADE ATM, I AM JUST FOLLOWING THE STANDARDS OF TRADITIONAL TECHNICAL ANALYSIS. ANYTHING CAN HAPPEN**
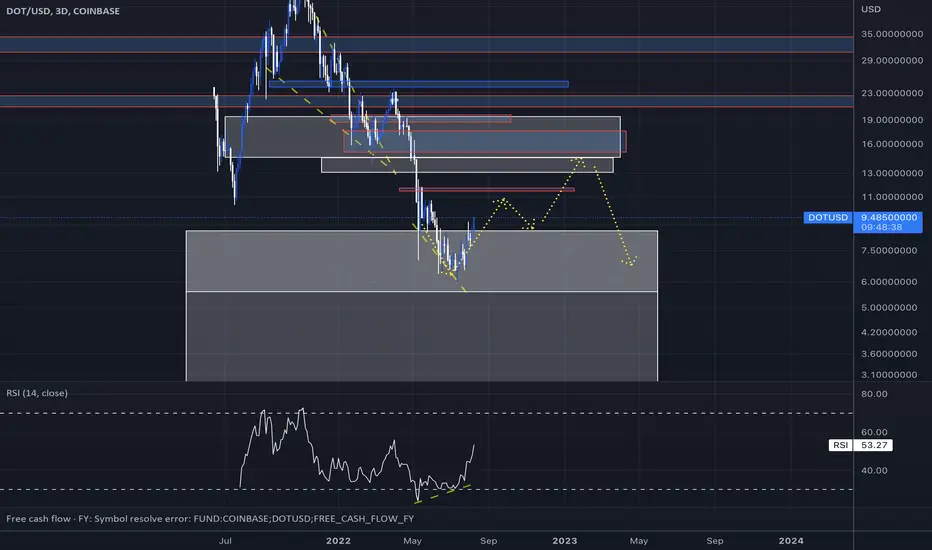
Log Plot...So this is a little different to previous ideas - the projected moves are done in log scale with log fibs - I don't rate this being that likely at all but it is a possibility - typically the linear charts do a better job at forecasting future moves.

Dot Plot...Have plotted what I believe is the correct long term count for now - if our low is busted - future targets will change - Also have some reaction lines/fork if this move does something different.
We are on track with Polkadot
Update to our previous IDEA , Dot is playing out as we expected. Looking forward to see it hitting the 8.5 mark.


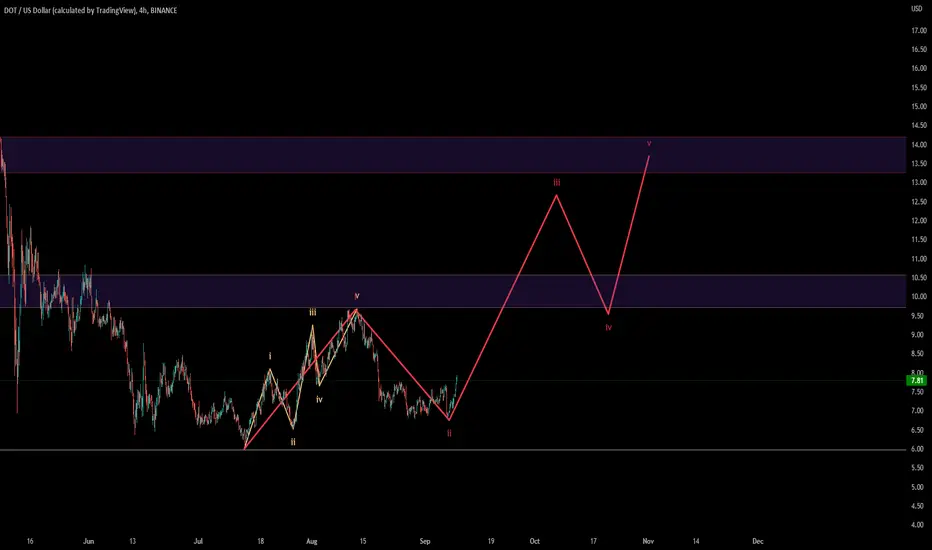
DOT/USDhmm let's check elliot waves.
maybe that could be a 70% of scenario.
i am using different trading strategy, but if we measurement a waves withg this scenario DOT will be hit 14bucks. (80%)
Looking Forward to See DOTUSDT Breaking Resistance.
Strong Buy flashed on DOT 2H chart followed with a Trend Tracer & Trend Catcher confirmation they both turned green.
Looking forward to see DOT Breaking the resistance line & retesting.
NFA as Always, Please do your own research. BINANCE:DOTUSDT

Polkadot longPolkadot bounced off the lower boundary of horizontal channel. Bullish movement to resistance level at 7.38 is possible.
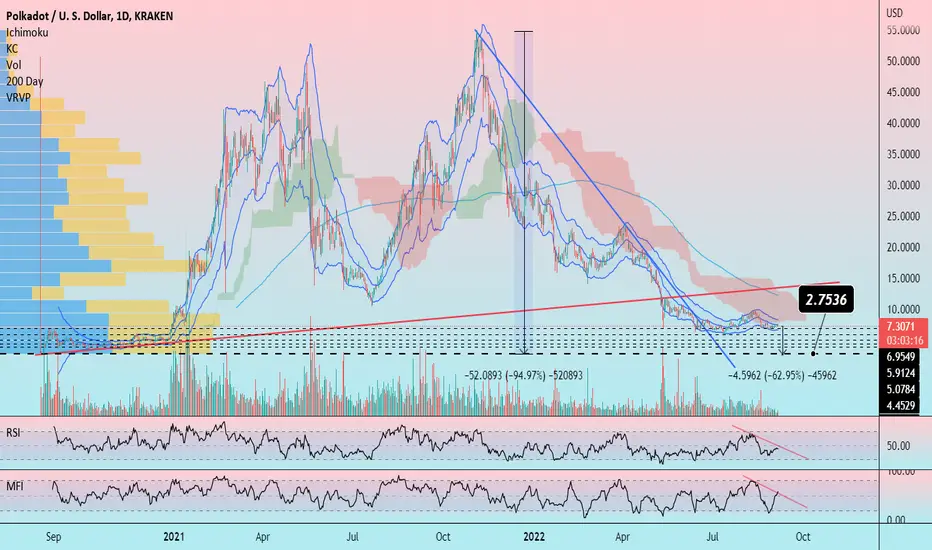
Polkadot DOT: Not Looking GoodHello friends, today you can review the technical analysis idea on a 1D linear scale chart for Polkadot (DOTUSD).
The chart is self-explanatory. With the crypto market going through a correction, Polkadot may still have downside to go. See where I believe there may be strong support and possible bottom.
Included in the chart: Trend line, Support and Resistance Line, VPVR, Ichimoku Cloud, RSI, MFI and Volume.
If you enjoy my ideas, feel free to like it and drop in a comment. I love reading your comments below. More ideas below!
Disclosure: This is just my opinion and not any type of financial advice. I enjoy charting and discussing technical analysis. Don't trade based on my advice. Do your own research! #cryptopickk
Polkadot: Pushing for $8.8 according to this pattern.Hello all, and thanks for supporting my channel.
Looking at DOTUSD on the daily timeframe, we see a formation of a falling wedge pattern which has a bullish price target at $8.90. This price also corresponds with the 78% fibonacci retracement level and is also the top of the weekly candle formation.
On the daily timeframe we are also trading inside the ascending channel which has support level sitting at $7 and resistance level at $10. For this channel, the Fixed Range Volume Profile provides a point of control at around $7.85 which is also the 50% Fibonacci retracement level.
On the 4hr timeframe, DOT broke bullish out of the $7.50 price, and is currently retesting this price for support.
As such, if the price of DOT can clear the $8 mark, we can retest the top of the channel at $10. This is approximately 30% move to the upside from the current point.
Thanks for reading, and stay tuned. Enjoy.

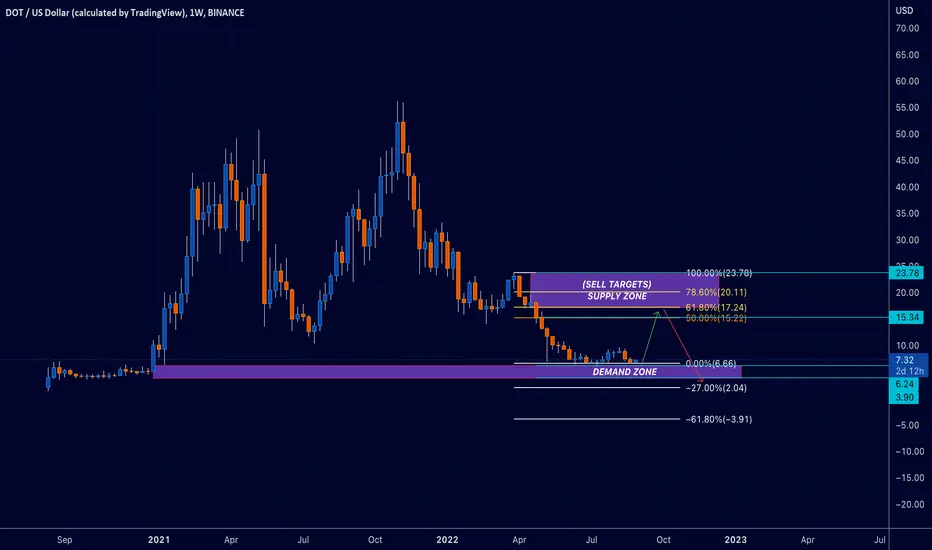
POLKADOT IS IN ACCUMULATION ZONEPolkadot seems to be in the demand zone($6.24 - 3.90) on the weekly time frame forming equal highs/lows. This possibly signifies an accumulation of orders at this zone before an explosive move towards the weekly supply zone of - $15.34- 23.78 region. This zone also coincides with the golden ration in the Fib retracement, which adds to our confluence.The RSI also seems to have stopped forming lower lows and looks like its displaying a potential reversal/bullish divergence in play.
If this move plays out(dependant on Bitcoin) we could see a sharp sell off once it reaches the supply zone.
If you are accumulating #Dot in these regions make sure to take some profit at this key level.
DOT/USDT Elliott Wave countDOT may start to push higher for a C wave after a 5 waves impulse to the downside.
Price bounced into the 0.5 fib retracement of wave A. Target for C wave if B is completed 8.167 - 8.656

DOT Wyckoff accumulationDOT may be into an Wyckoff accumulation phase and will start to go up.
It needs to break last resistance, retest and go! Good luck!

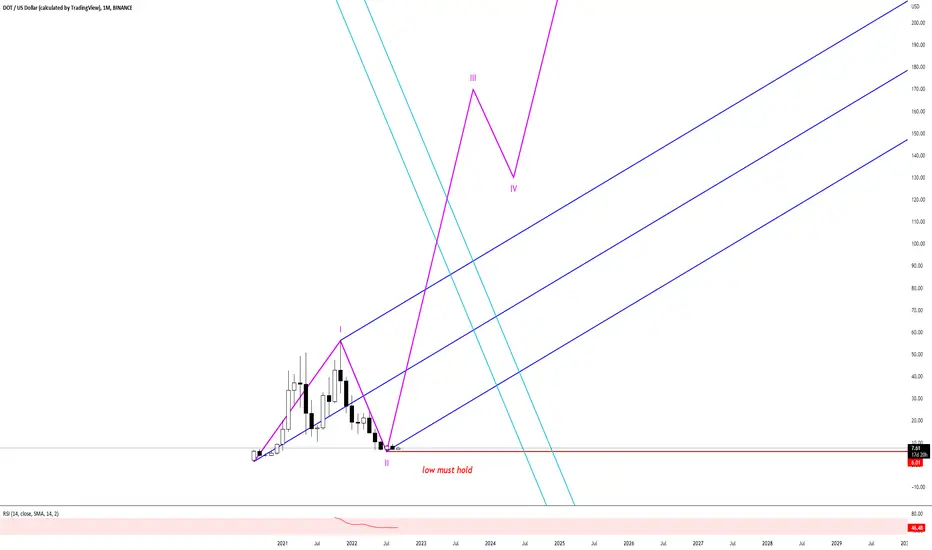
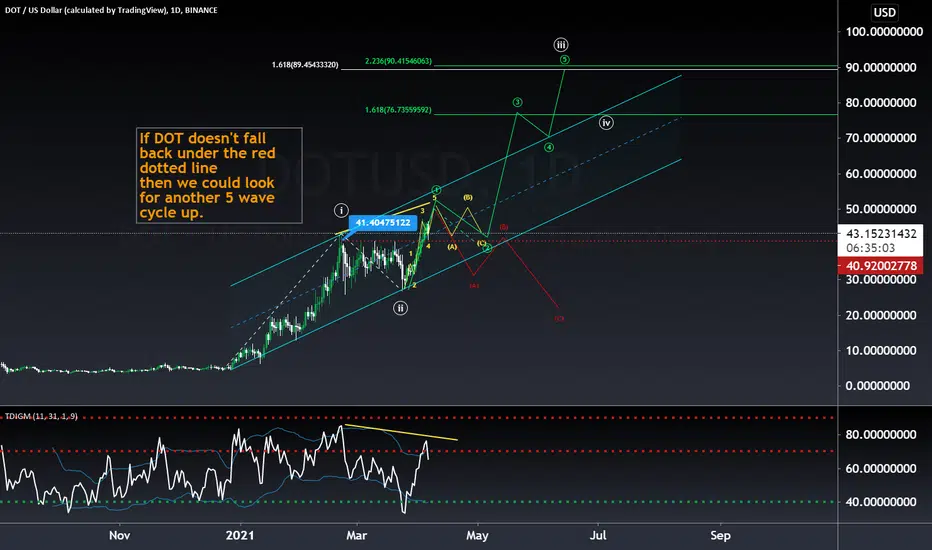
Next Cycle for DOT Would Take Us This High...Hit follow to stay updated and the Like button if you find this useful.
This one's real simple. Consolidate on previous 3rd wave top and blast off to 100$, If we fall back into the range then likely an A wave of an ABC in red and the previous 5 wave cycle is correcting itself.
I'm leaning bullish on this one. We have had upwards of 30+ dollars tagged for the first cycle in the discord since December. We've had this pegged since 3-5$ and has been a huge gainer thus far.
If you don't have some DOT then here's the next area I'd be looking to consolidate at to pick some up for the next cycle.
Thanks for following and liking. Stay tuned for updates.
DOT/USDAbout POLKADOT, not Stable situation for any position i think, so wait some more (timeframe:4h)
maybe 6.0<x<6.5 good for long position
just wait and follow for more
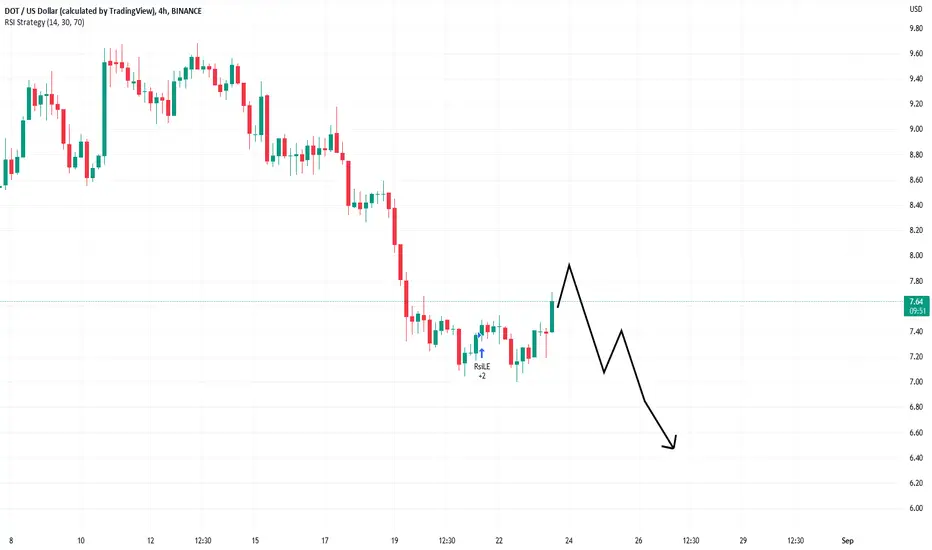
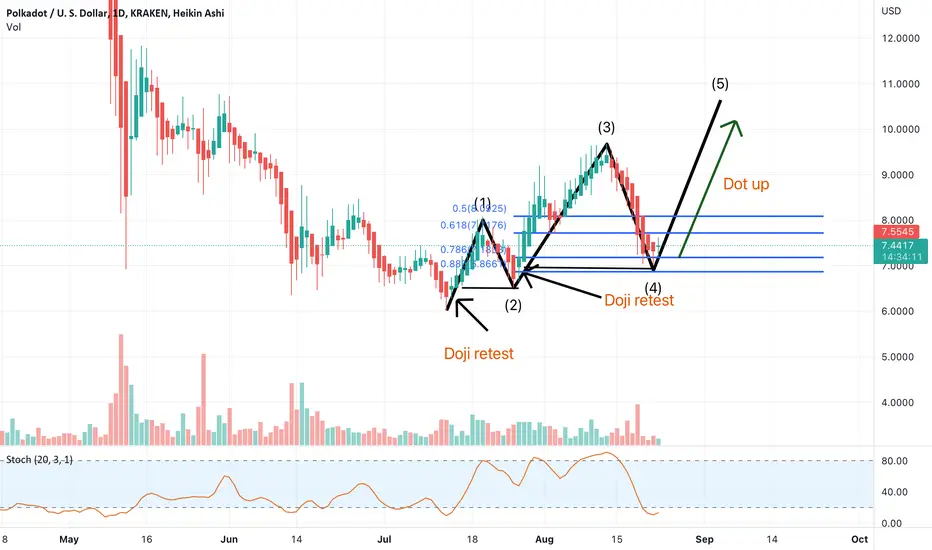
DOT up move before correction Polkadot seems it will have a short burst up before another correction wave down into the low of the accumulation zone.
The last leg of the impulse wave has aligned nicely with the Heikin ashi doji which has also retested a previous doji. Oversold stochastic along with a slight retrace suggests a possible move up into the final point of the impulse wave.

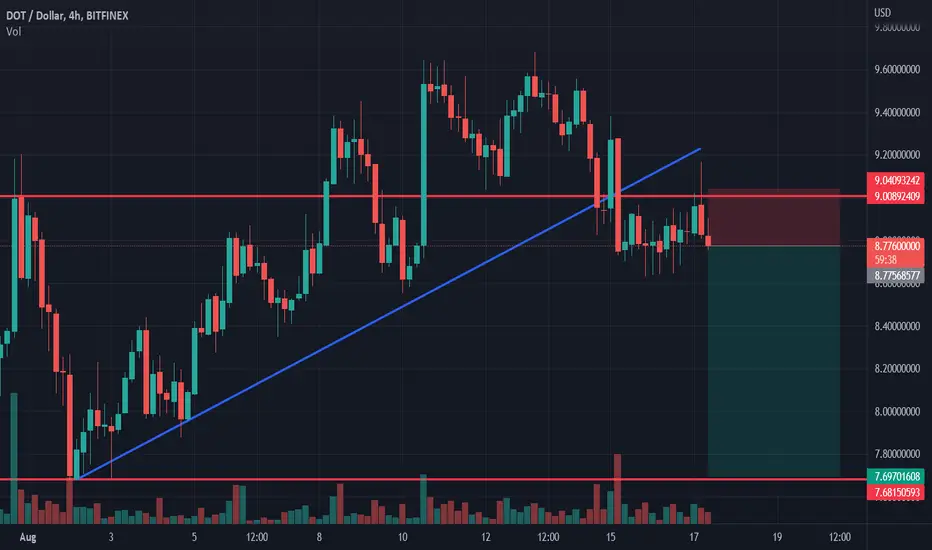
Polkadot shortPolkadot broke trough the ascending trendline. Asset broke trough the support level. Bearish movement to support level at 7.7 is possible.
DOTUSD - Falling Wedge Falling Wedge leading to a strong pattern break out
Below is an example of a similar Falling Wedge however on a different coin (NEO)

DOT / USD DAILY CHART Something for me to remember and pay attention to. reference purpose only. Jesus Loves you.

PolkadotSemi strong looking here
Obv way stronger than current pa
Sign of things to come?
Risk on looking like relief and potential continuation back to old supply zone
Cpi data was decent (better than previous)

Long DOT After a tough bear market we finally are getting a nice relief rally. Bullish Divergence on 3D+ TF, and solid Fibonacci support Levels. I believe we can reach some resistances above before going back down.