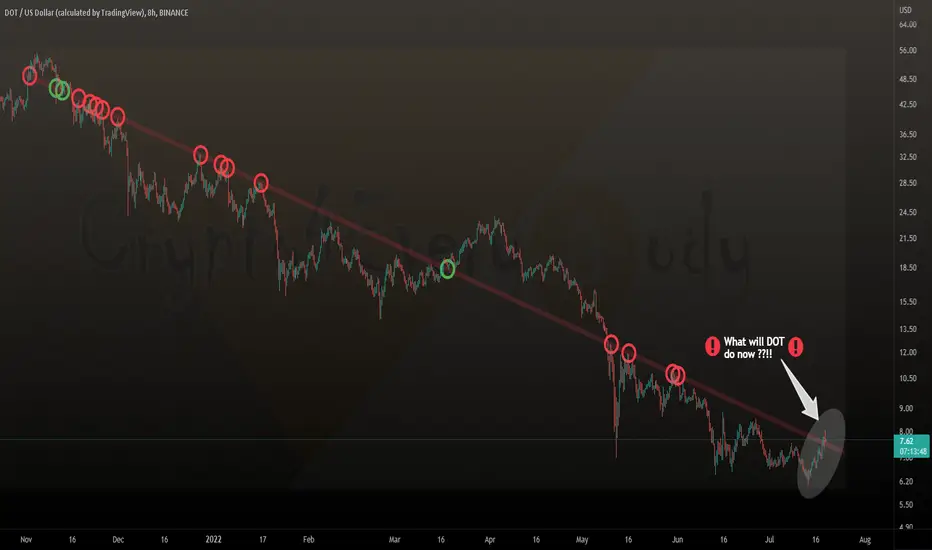
POLKA DOT SHORT TERM BUY SIGNAL BINANCE:DOTUSDT
This is experimental short term polka dot signal. on a lower timeframe polka dot has flashed descending broadening wedge pattern.
You could go long with low risk make sure do not play with high leverage. as leverage is always very risky and exchange could manipulate the market to liquidate the positions. so be careful with leverage trading.
disclaimer: do not put trades on leverage always use spot trading or only go for 2x 3x leverage. crypto is already so volatile that it doesn't need leverage trading.
DOTUSD.P trade ideas
DOTUSD 07 AUG 2022 1010 hrsLooks like hit hit a lot of stopping volume. In VSA you could say that t was accumulating off of the "demand line" (circled). On the lower time frames you will be able to make out the uptrend with a bit more detail. Probably too high to long from here. Could use a bit of a pull back before looking for a re-accumulation pattern since it is intersecting with the "supply line". But what does the volume indicate at the supply line? Is the pressure high or will it be able to break through?


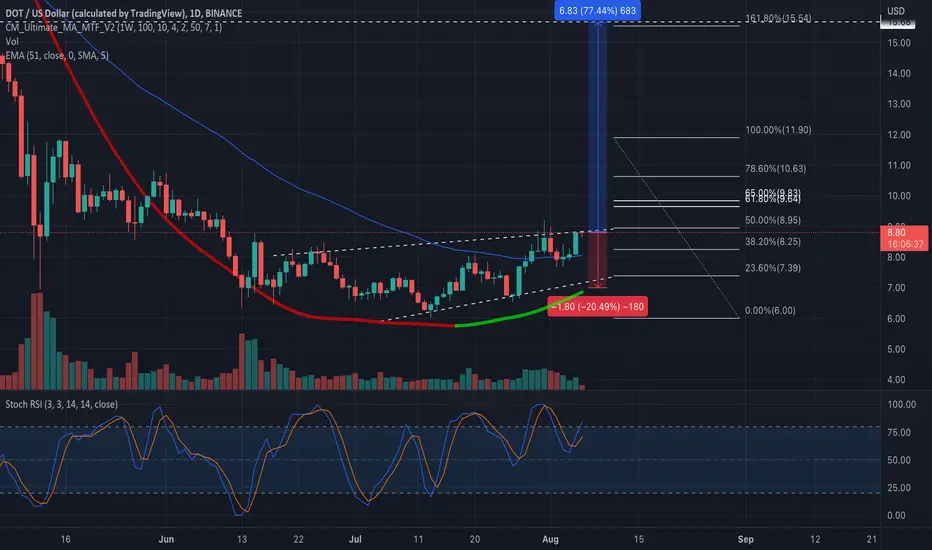
Polkadot: 77% rally incoming.Hello all. Looking at DOTUSD on the daily chart, we see the price of polkadot inside a rising channel, and currently sitting at a point of resistance at the current $8.75 price level.
While the support of this channel is at $7.14 which is a 20% lower price, the next biggest resistance sits at $15 which is a potential 77% gain.
If the price breaks the current resistance and hits the fib golden pocket at $9 .50 I will expect a rally all the way up to $15.
Retest levels to keep an eye on: 51 Day EMA, Support of the channel at $7.14, 100% fib level at $11.9.
Thanks for reading, and stay tuned. Enjoy.
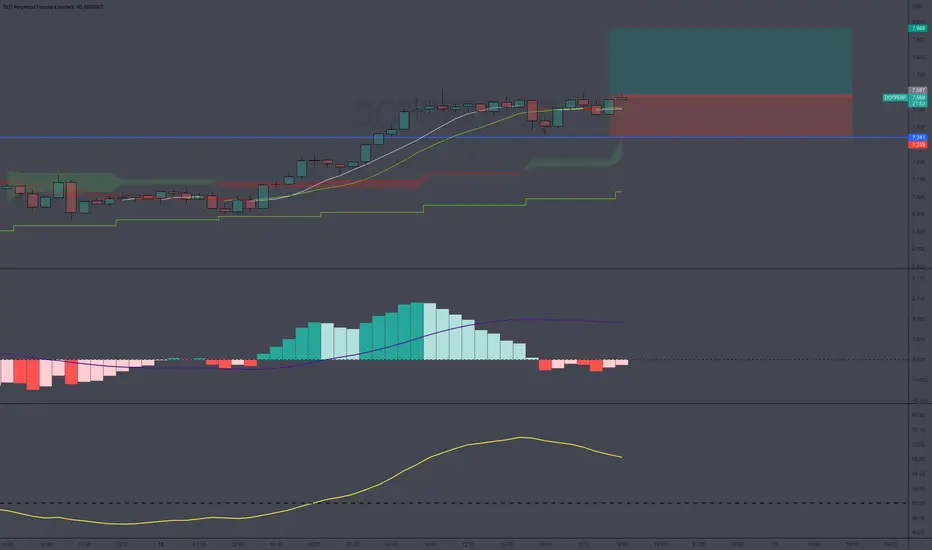
DOTUSD ❕ held above the rangePolkadot consolidated above the range.
Price entered the bullish RSI zone on the 4H Timeframe.
I think the asset is slightly overbought, so I see an entry point above the resistance level, which the DOT recently broke through. After that, I think the asset will continue to rise.

DOT - RANGE TO PLAYDOT at big resistance. One more little push up or not and think we will have lgo down. If we lose 6.3 usd another support is around 4.6 where could be our bear market bottom.
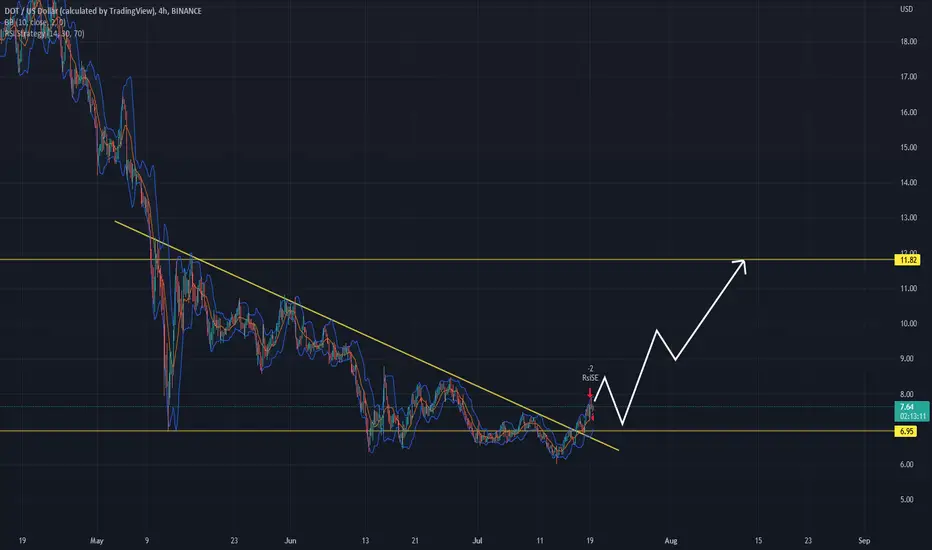
Polkadot - Short Swing Trading Idea - 3 August 2022KRAKEN:DOTUSD in next three days I expecting the price to take off at least 10% to levels over $8.80. In higher time frames and in 1-2 months period we really can expect a big move to over $11.00 from current levels.
What is the supported thesis technically for the expected scenario on DOT?
- By Elliot waves we are in A-B-C correction and at this moment it's C
- Almost 60% correction and forming of good price action indications
- Test on downside of the channel and once the price enter again in channel will rocket
If you have any questions related to this trading idea I will be happy to provide you with answers.

DOTUSD Potential for Bearish Continuation | 2nd August 2022On the H4, with price breaking the ascending channel , we have a bearish bias that price might drop from our buy entry at 7.53, which is in line with 100% projection and 61.8% fibonacci retracement to the take profit at 6.57, which is in line with overlap support and 161.8% fibonacci projection . Alternatively, price may rise to our stop loss at 9.03, which is in line with the swing high. Take note the 8.02 could be our intermediate resistance, which is in line with the 78.6% fibonacci rertracement.
Any opinions, news, research, analyses, prices, other information, or links to third-party sites contained on this website are provided on an "as-is" basis, as general market commentary, and do not constitute investment advice. The market commentary has not been prepared in accordance with legal requirements designed to promote the independence of investment research, and it is therefore not subject to any prohibition on dealing ahead of dissemination. Although this commentary is not produced by an independent source, FXCM takes all sufficient steps to eliminate or prevent any conflicts of interest arising out of the production and dissemination of this communication. The employees of FXCM commit to acting in the clients' best interests and represent their views without misleading, deceiving, or otherwise impairing the clients' ability to make informed investment decisions. For more information about the FXCM's internal organizational and administrative arrangements for the prevention of conflicts, please refer to the Firms' Managing Conflicts Policy. Please ensure that you read and understand our Full Disclaimer and Liability provision concerning the foregoing Information, which can be accessed on the website.
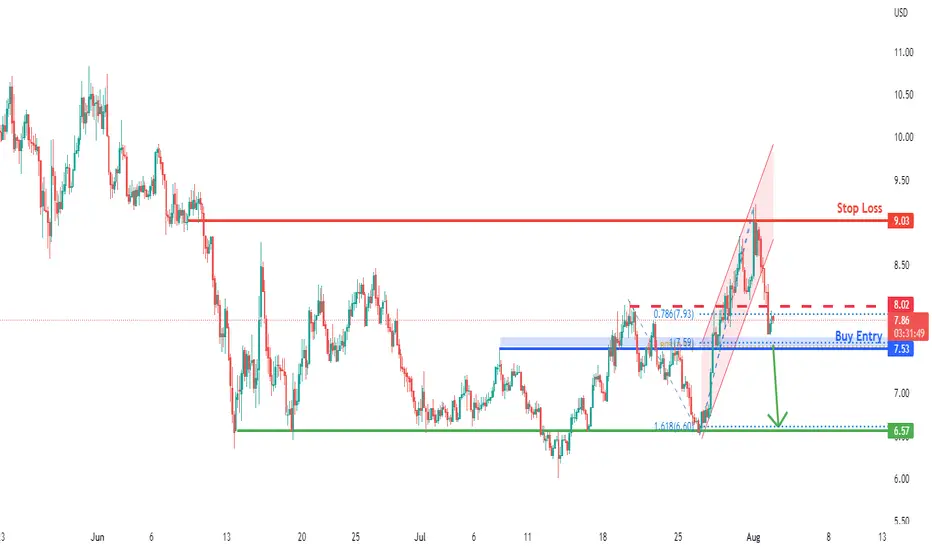
DOTUSD Potential for Bearish Continuation | 2nd August 2022
On the H4, with price breaking the ascending channel , we have a bearish bias that price might drop from our buy entry at 7.53, which is in line with 100% projection and 61.8% fibonacci retracement to the take profit at 6.57, which is in line with overlap support and 161.8% fibonacci projection. Alternatively, price may rise to our stop loss at 9.03, which is in line with the swing high. Take note the 8.02 could be our intermediate resistance, which is in line with the 78.6% fibonacci rertracement.
Any opinions, news, research, analyses, prices, other information, or links to third-party sites contained on this website are provided on an "as-is" basis, as general market commentary, and do not constitute investment advice. The market commentary has not been prepared in accordance with legal requirements designed to promote the independence of investment research, and it is therefore not subject to any prohibition on dealing ahead of dissemination. Although this commentary is not produced by an independent source, FXCM takes all sufficient steps to eliminate or prevent any conflicts of interest arising out of the production and dissemination of this communication. The employees of FXCM commit to acting in the clients' best interests and represent their views without misleading, deceiving, or otherwise impairing the clients' ability to make informed investment decisions. For more information about the FXCM's internal organizational and administrative arrangements for the prevention of conflicts, please refer to the Firms' Managing Conflicts Policy. Please ensure that you read and understand our Full Disclaimer and Liability provision concerning the foregoing Information, which can be accessed on the website.

DOTUSD Potential for Bullish Continuation | 1st August 2022On the H4, with price moving along the ascending channel, we have a bullish bias that price might rise from our buy entry at 8.99, which is in line with pullback resistance to the take profit at 9.91, which is in line with overlap resistance and 161.8% fibonacci projection. Alternatively, price may drop to our stop loss at 8.18, which is in line with the 38.2% fibonacci retracement and 78.6% fibonacci projection .
Any opinions, news, research, analyses, prices, other information, or links to third-party sites contained on this website are provided on an "as-is" basis, as general market commentary, and do not constitute investment advice. The market commentary has not been prepared in accordance with legal requirements designed to promote the independence of investment research, and it is therefore not subject to any prohibition on dealing ahead of dissemination. Although this commentary is not produced by an independent source, FXCM takes all sufficient steps to eliminate or prevent any conflicts of interest arising out of the production and dissemination of this communication. The employees of FXCM commit to acting in the clients' best interests and represent their views without misleading, deceiving, or otherwise impairing the clients' ability to make informed investment decisions. For more information about the FXCM's internal organizational and administrative arrangements for the prevention of conflicts, please refer to the Firms' Managing Conflicts Policy. Please ensure that you read and understand our Full Disclaimer and Liability provision concerning the foregoing Information, which can be accessed on the website.

DOTUSD Potential for Bearish Rise | 29th July 2022On the H4, with price moving along the ascending channel, we have a bullish bias that price might rise from our buy entry at 8.00, which is in line with pullback resistance to the take profit at 8.49, which is in line with overlap resistance. Alternatively, price may drop to our stop loss at 7.50, which is in line with the 38.2% fibonacci retracement.
Any opinions, news, research, analyses, prices, other information, or links to third-party sites contained on this website are provided on an "as-is" basis, as general market commentary, and do not constitute investment advice. The market commentary has not been prepared in accordance with legal requirements designed to promote the independence of investment research, and it is therefore not subject to any prohibition on dealing ahead of dissemination. Although this commentary is not produced by an independent source, FXCM takes all sufficient steps to eliminate or prevent any conflicts of interest arising out of the production and dissemination of this communication. The employees of FXCM commit to acting in the clients' best interests and represent their views without misleading, deceiving, or otherwise impairing the clients' ability to make informed investment decisions. For more information about the FXCM's internal organizational and administrative arrangements for the prevention of conflicts, please refer to the Firms' Managing Conflicts Policy. Please ensure that you read and understand our Full Disclaimer and Liability provision concerning the foregoing Information, which can be accessed on the website.

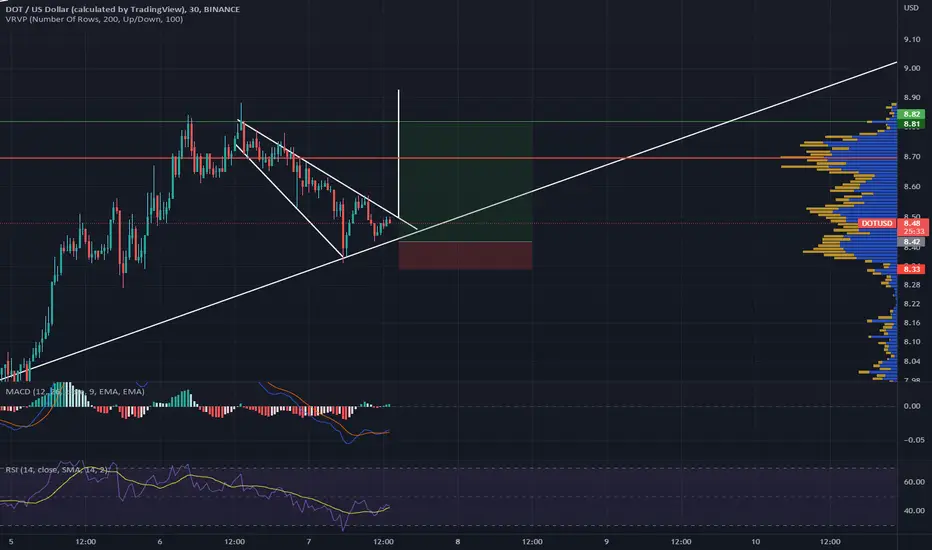
POLKADOT Coin convergence pattern identifiedMACD Convergence is an high success signal.
This coin is a long time investment for me, 5x + of capital


DOTUSD Potential for Bullish Rise | 28th July 2022On the H4, with price breaking the descending channel, and showing a bullish flag pattern, we have a bullish bias that price might rise from our buy entry at 7.52, which is in line with pullback resistance to the take profit at 8.46, which is in line with overlap resistance. Alternatively, price may drop to our stop loss at 6.55, which is in line with the swing low support.
Any opinions, news, research, analyses, prices, other information, or links to third-party sites contained on this website are provided on an "as-is" basis, as general market commentary, and do not constitute investment advice. The market commentary has not been prepared in accordance with legal requirements designed to promote the independence of investment research, and it is therefore not subject to any prohibition on dealing ahead of dissemination. Although this commentary is not produced by an independent source, FXCM takes all sufficient steps to eliminate or prevent any conflicts of interest arising out of the production and dissemination of this communication. The employees of FXCM commit to acting in the clients' best interests and represent their views without misleading, deceiving, or otherwise impairing the clients' ability to make informed investment decisions. For more information about the FXCM's internal organizational and administrative arrangements for the prevention of conflicts, please refer to the Firms' Managing Conflicts Policy. Please ensure that you read and understand our Full Disclaimer and Liability provision concerning the foregoing Information, which can be accessed on the website.

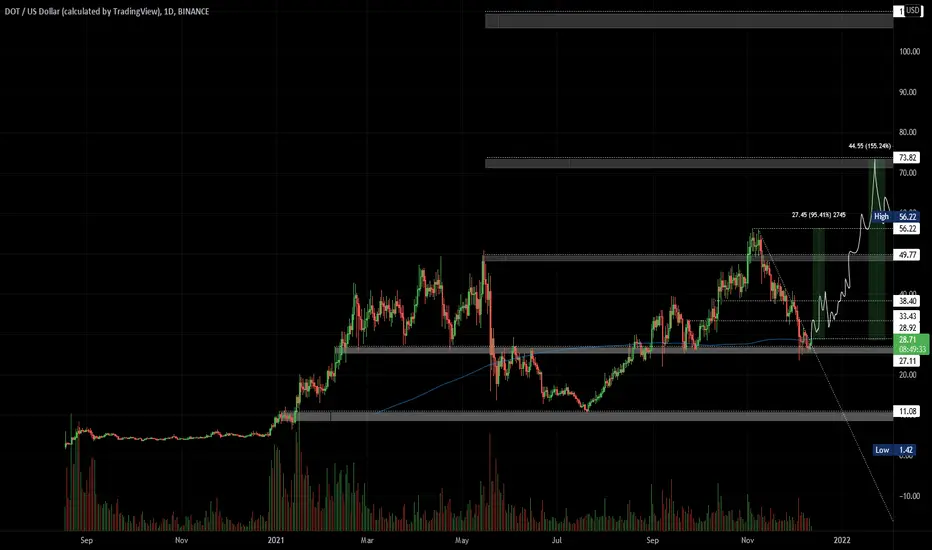
Long Polkadot (DOT) vs USDTDOT finally found floor at $26. This area had to be tested as support once again and now it's ready to challange the ATH's IMO.
DOTUSDT is testing MA200 from below and as long it trades above it and flips it to support, I'm bullish on DOT.
This is an aggressive entry here, more convention entry would be once it flips $33 to support.
One of my favorite crypto project out there that hasn't shown it's true potential yet. It's a Top 3 project IMO.
Make sure to take profits on the way up.
Good luck.
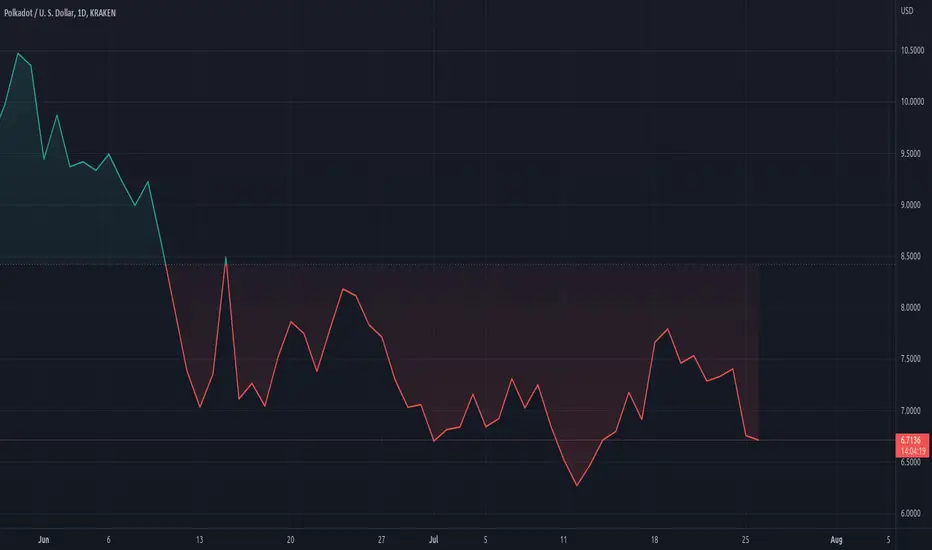
DOT/USD consolidates near $6.71 amid bearish windsDOT/USD consolidates near $6.71 amid bearish winds
Polkadot price analysis reveals that the DOT/USD pair is consolidating around $6.71 today after a slight pullback from yesterday’s high at $7.19. The bulls had earlier pushed the price up to this level following a period of sideways trading between $5.50 and $6.71. The Resistance for DOT/USD is set at $7.19 while support lies at the $6.64 level.
POLKADOT 1D FORCASTHello everyone
As u see ,we have a bearish wedge that broked upside...
At firs we can see higher price then a dropp!!
Be success!!

POLKADOT/USDHi everybody
here is my idea about polkadot, the Target is 11.8<*<12
ST can be lower than 6.5
Polkadot DOT at important trendlinePolkadot DOT at important trendline
Exciting to watch what DOT will do within the next days - a confirmed break to the upside and bottom might be in
But a danger of fakeout always has to be considered dear Crypto Nation
Who is a DOT HODLER? Tell me...
*not financial advice
do your own research before investing
DOTDOT Looks good at this point for a great ROI risk to reward! All timeframes are lining up together for maybe a test of $12.00
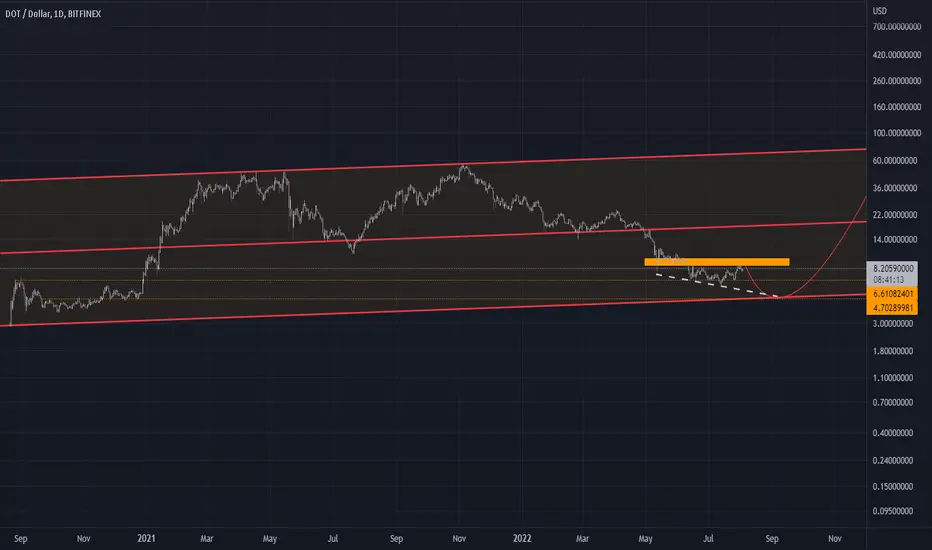
DOTUSDbetter look non phone chart as previously posted
retested breakout high from 2020 and bouced
might see a pullback across the board, soon or aug for muh mt gox btc unlock
eitherway fundamentally psycologically we appear to have seen max fud
next is cuck breakout longers?
thensend eet?
or macro recession also but unemployement would suggest otherwise and inflation is still fairly uncontrolable despite the feds warpath best efforts
time will tell
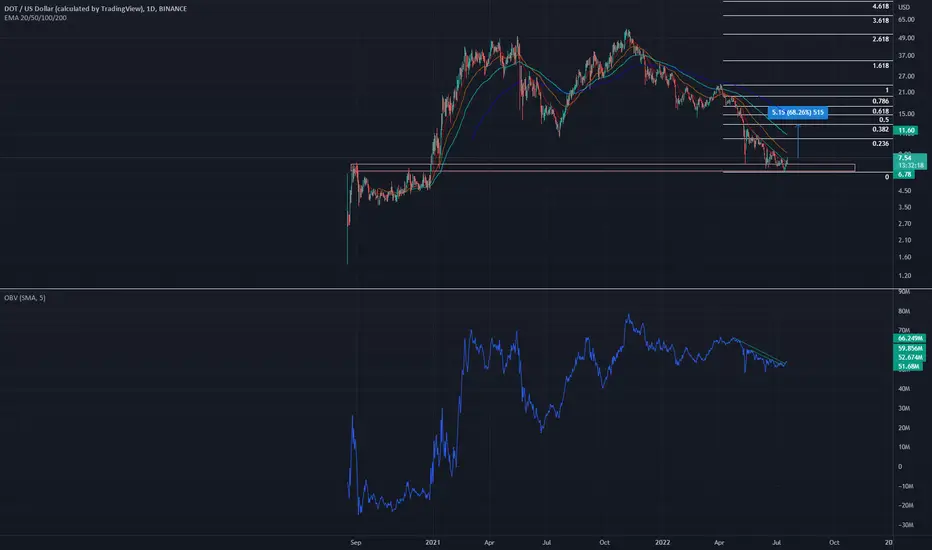
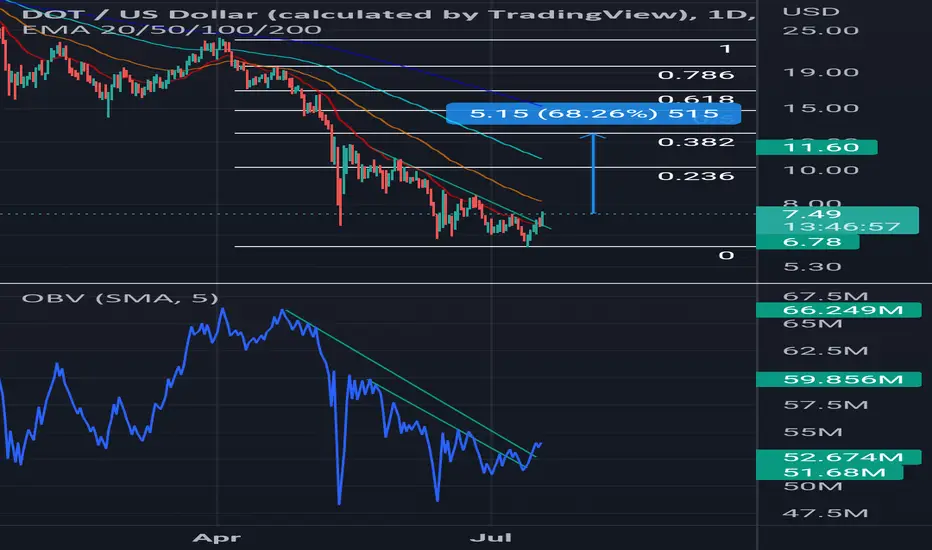
Dotusd67% ish to the .382 of the downmove
This thing still only has 2 useable chains built into it as far as im aware...
Any fundamental catalyst from here should see some serious relief, havent heard of anything yet but the chart looks nice and its not moved yet compared to other highly rated L1s
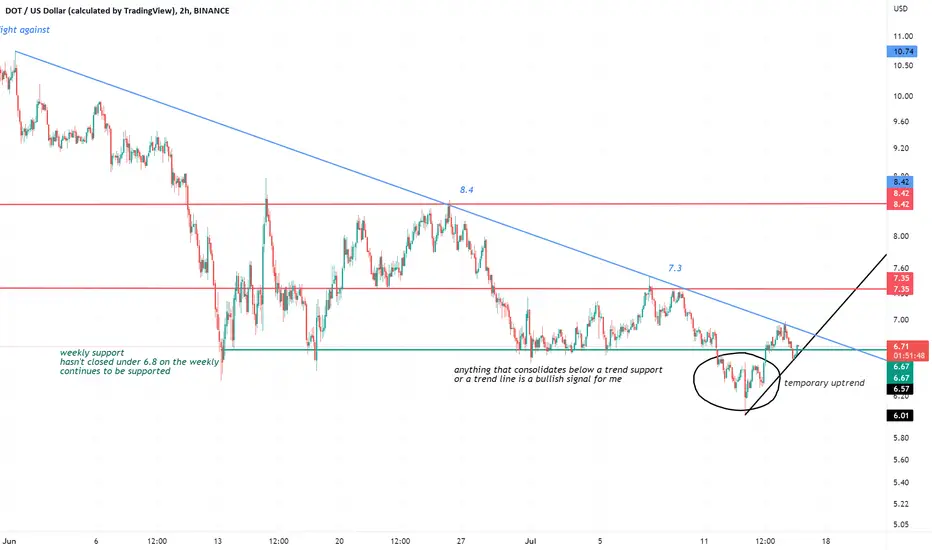
DOT! this pair is being supported on the weekly time frame by a price of $6.8ish. i believe in a possible pull back to the $7.3ish to $8.4ish range expecting one of those to serve as a new short term resistance.