Polkadot longPolkadot broke trough the resistance level. Asset broke trough the descending trendline. Bullish movement to resistance level at 8.85 is possible.
DOTUSD.P trade ideas
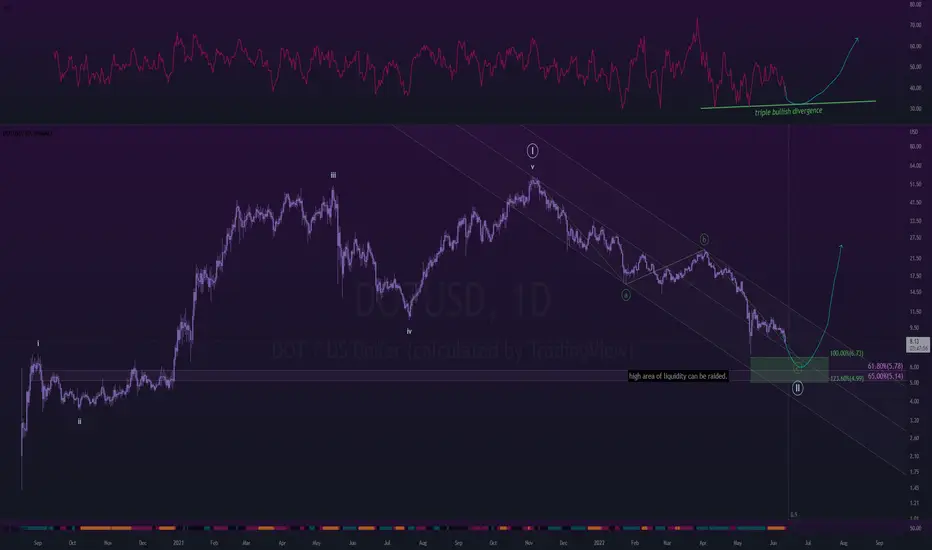
T's reviewThis is my take on DOT for the coming time. I hope it is to the expectations of my master.
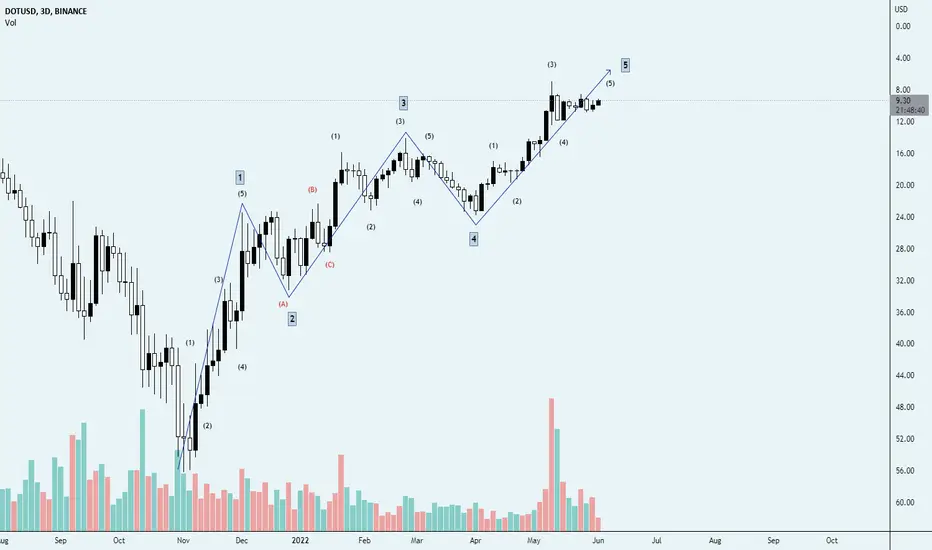
Dot.Dot saw a clean 5 wave impulse which started back in August of 2020,
the impulse completed in November of 2021.
---
since that peak, dot has been correcting in what looks to be a simple zig-zag (labeled as a-b-c).
-on june 15th, the correction will have lasted exactly 50% the time it that it took for the impulse to be completed.
-there's also a full moon on the 15th of june.
-full moons are historically very bullish indications in the market.
-dot is forming a triple bullish divergence on the daily time-frame.
-currently in a multi-day squeeze.
a lot of confluence at $6.73,
-midline of bear channel,
-100% extension
-0.50% in fib time when measuring against the impulsive move.
there is a very high area of liquidity just beneath, between $5.78~$5.14.
this area could technically be raided with a wick.
---
Imminent reversal is expected just after June 15th,
Bullish.
---
ps. if you have any coins you want me to take a look at, leave them in the comments, or pm me.
Sell dotI am out because ot head and shoulders on 1h time frame around 9.143
If we get buy single again will let u guys know

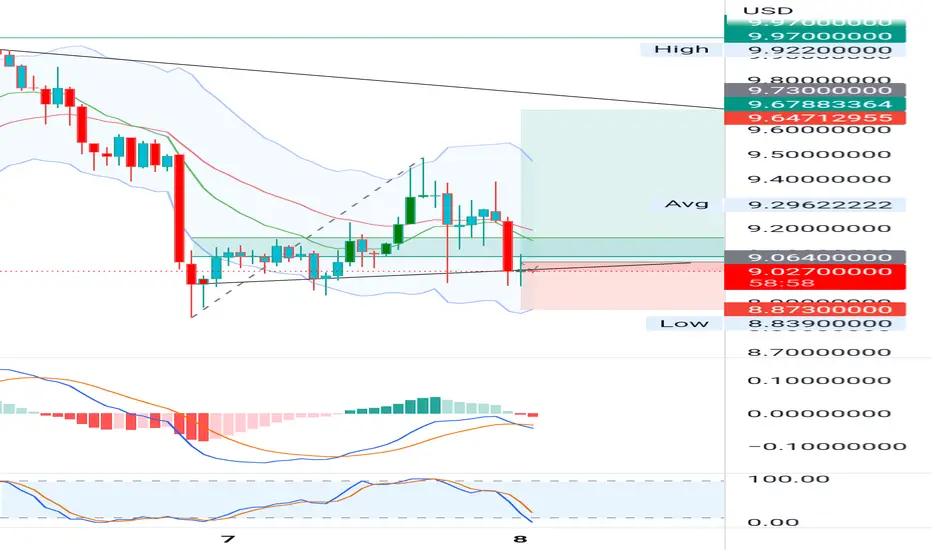
DOTUSD ❕ rise in downward channelPolkadot is moving in a downward channel.
Price is under liquidity.
Growth is accompanied by an increase in trading volumes.
DOT is testing the 100MA on the 1H Timeframe.
I expect that the price will correct to the support level from the current levels, but after fixing above it, it can make a rebound.

Buy dotLittle bit early but let see how it plays out
Macd divergence on 4h and in 1h its creating uptrend
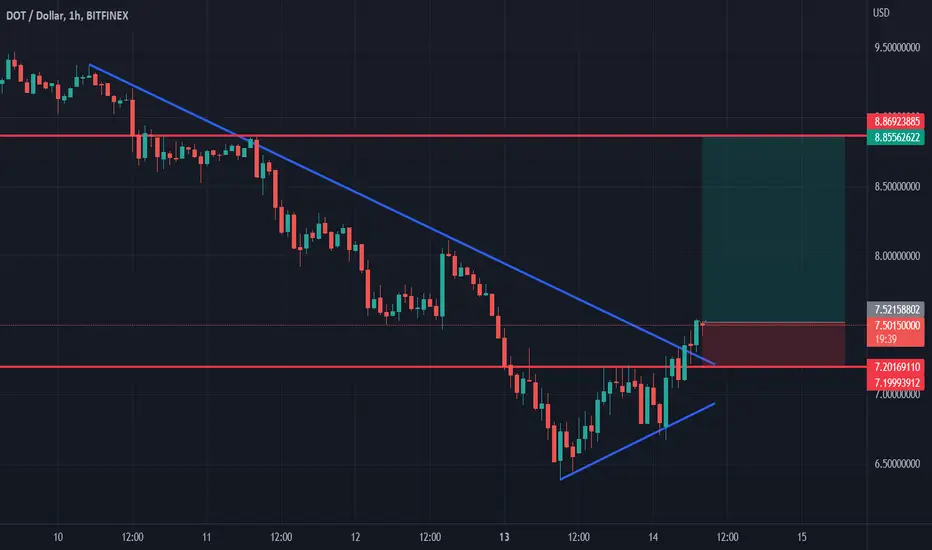
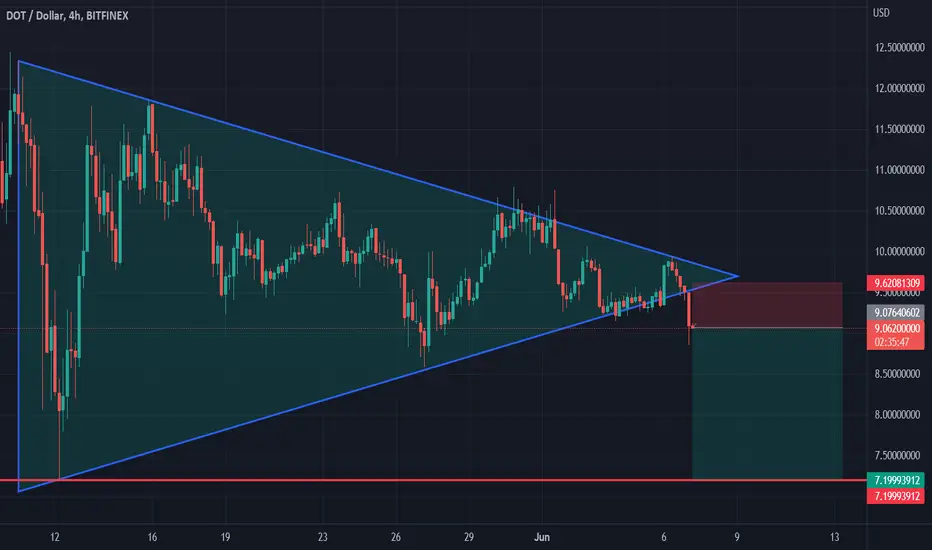
Polkadot shortSymmetrical triangle on Polkadot chart is broken down. Bearish movement to support level at 7.2 expected to happen.
POLKADOT WAVE COUNTS - 5TH WAVE ENDING SOON?Another look at potential wave counts, however you place them do you still get 5 waves to reach where we are now or where we are soon going to be?
I believe we're in our final 5th wave of the over macro correction of this trend to mark our bottom and begin waves up.
DISCLAIMER: THIS CHART IS INVERTED
Let me know your thoughts in the comments!
V
Dot's M-pattern signals 180$ or 1.8$Hello traders and Investors. I deem it fit to give my analysis on Dot since this is one of the strong coins out there. In bear season like this, it is advisable to go for the best coin and not a coin that perishes with dump/distribution period. As shown in my meticulous chart, Dot has fully formed M-pattern with two footings though the second footing is just starting.
As presented on the chart, two things are certain and one shall come as final result. Those two scenarios are of the points that Dot may continue this bear period till 1.8$ is reached or stop dropping further to target 180$. As per this analysis, if Dot should aim at mega bullrun, 1800$ is envisaged while 180$ is just a moderate normal bull season.
Personally, I am more optimistic and look forward to seeing Dot at 180$ but should anything happen in contrast, 1.8$ is next option. Let see how it goes and feel free to give me your support. Thanks in advance.

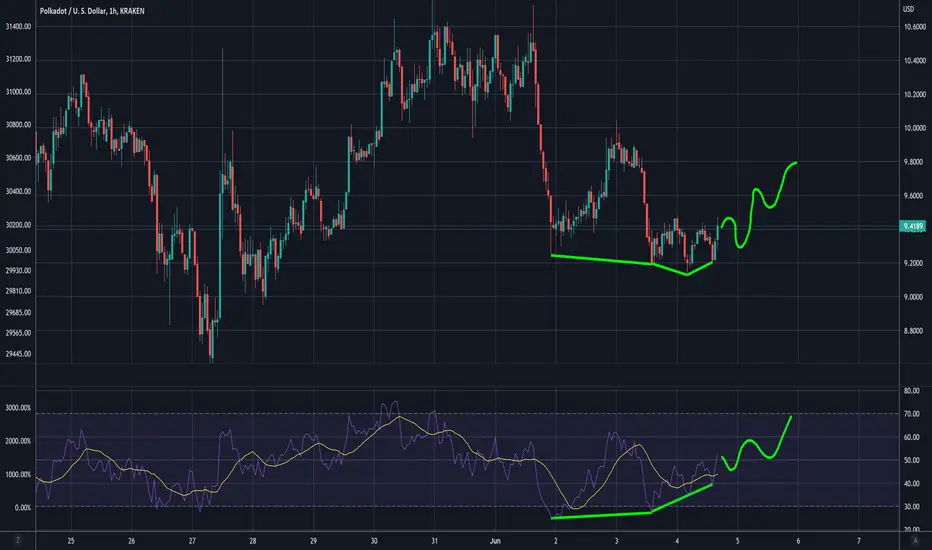
$DOTUSD Bullish divergence on RSI on 1Hour for weekend to $10Many Bullish divergence formed on RSI at 1 Hour following each other.
Weekend pump of Polkadot $DOT to 10 Dollar till Monday and possible above as 6th June is Pentecost Monday holiday in almost all European countries.
Dot possible pathwayHere is what i think will be the pathway for Polkadot.
Lets see if it works out…
Always a student.


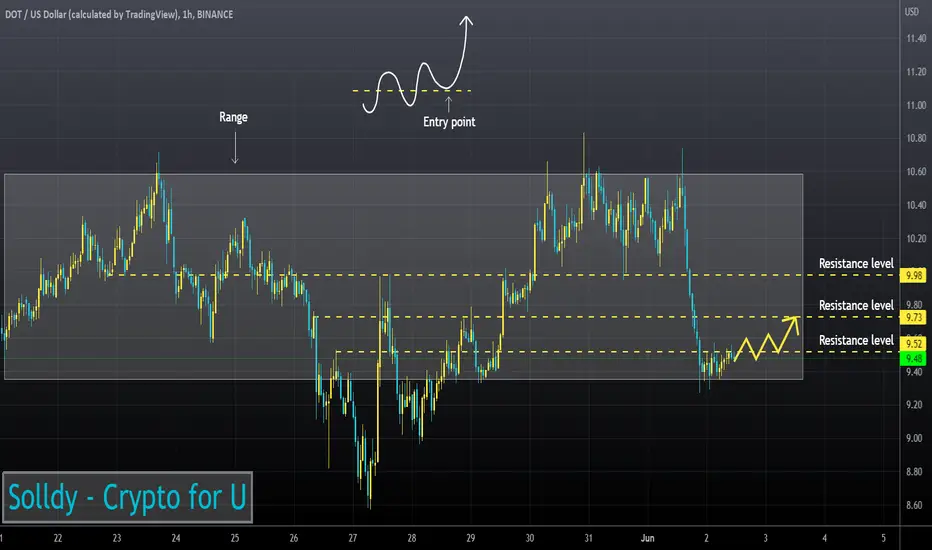
DOTUSD ❕ trading in rangePolkadot is trading within a range.
The price has reached the lower boundary.
Volumes and volatility decreased.
I expect that the price will grow after fixing above the resistance level.

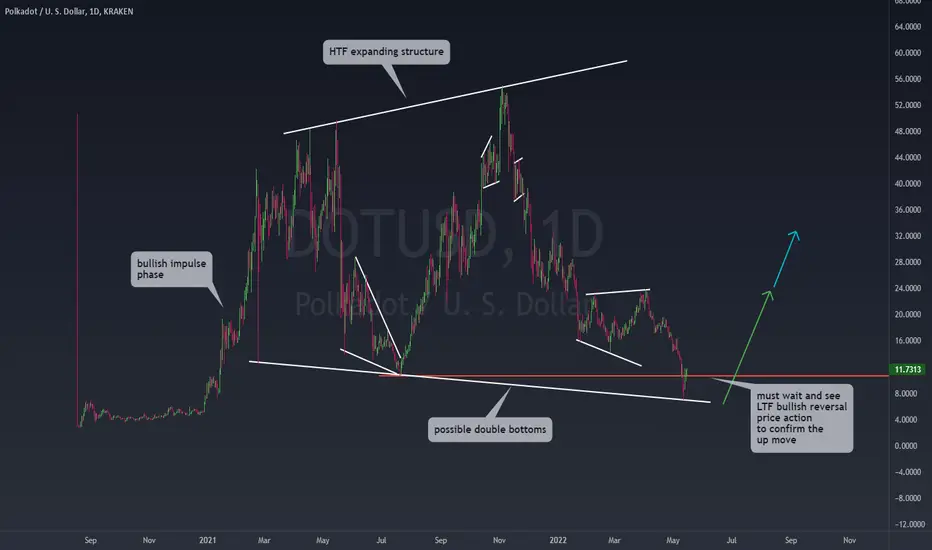
Polkadot Higher Time Frame Bullish Outlook
Hello traders:
Also on watch for the week ahead is DOT.
Majority of the bigger cap coins are developing similar across the market.
Here on DOT, we can see the higher time frame has formed into a nice expanding structure, correcting for the previous impulse move.
The latest development has shown price hit the previous lows, potential double bottoms.
Last few couple days have shown bearish price has slow down, and momentum could be exhausted.
To confirm the upside for entry, wait for some lower time frame bullish reversal price action at the bottom of the higher time frame structure. This could kick off the next bull run if it is confirmed.
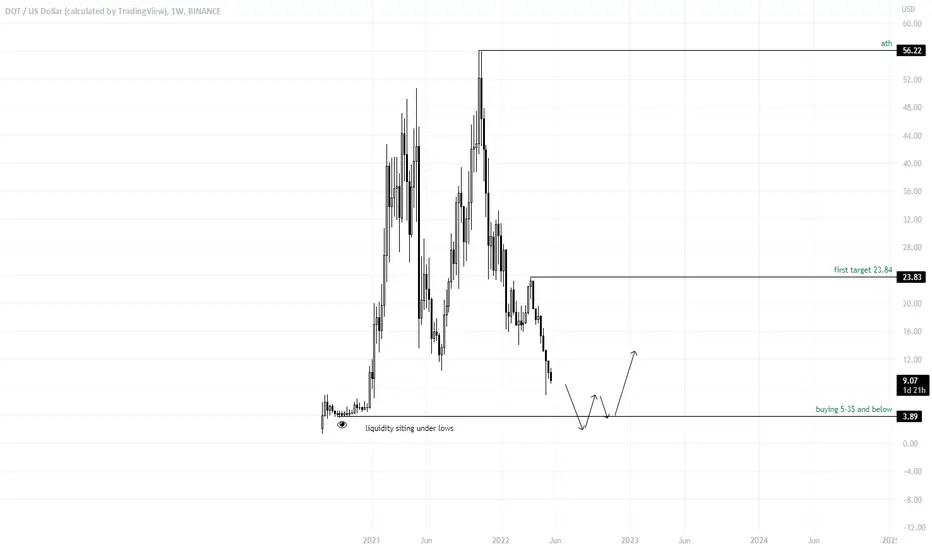
DotusdWaiting for lows(liquidity) to get taken out, leading to a reversal into bullish price action. In correlation with Btc, which has Dominance over the crypto market( BTC sub 20,000$).
Keep it simple
#kava kavausd in 1h time framethis chart is for 1hour kava price and we can see that the price is consolidated near the support zone and it is under pressure of a dynamic resistance trend line.
if the bars can break the trend line and the correction leg (simulated bars) retest the support zone, we can set a long position !#kava
#kavausd
time frame : 1h
Ep: 9.80
Sl ~ 9.41
Tp ~ 11.50

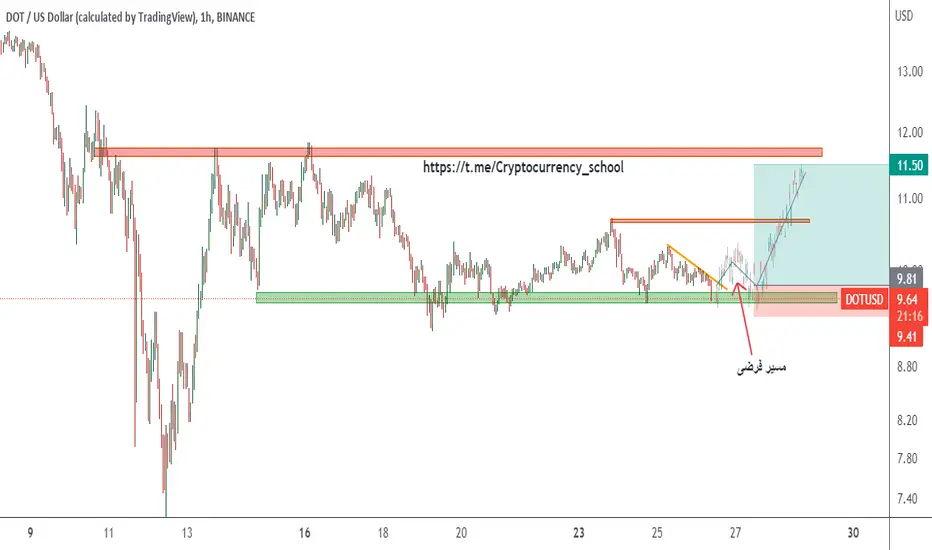
#dotusdt in 1h time framethis chart is for 1hour kava price and we can see that the price is consolidated near the support zone and it is under pressure of a dynamic resistance trend line .
if the bars can break the trend line and the correction leg (simulated bars) retest the support zone , we can set a long position !#kava
#dot
#dotusdt
#dotusd
time frame : 1h
Ep: 9.80
Sl ~ 9.41
Tp ~ 11.50
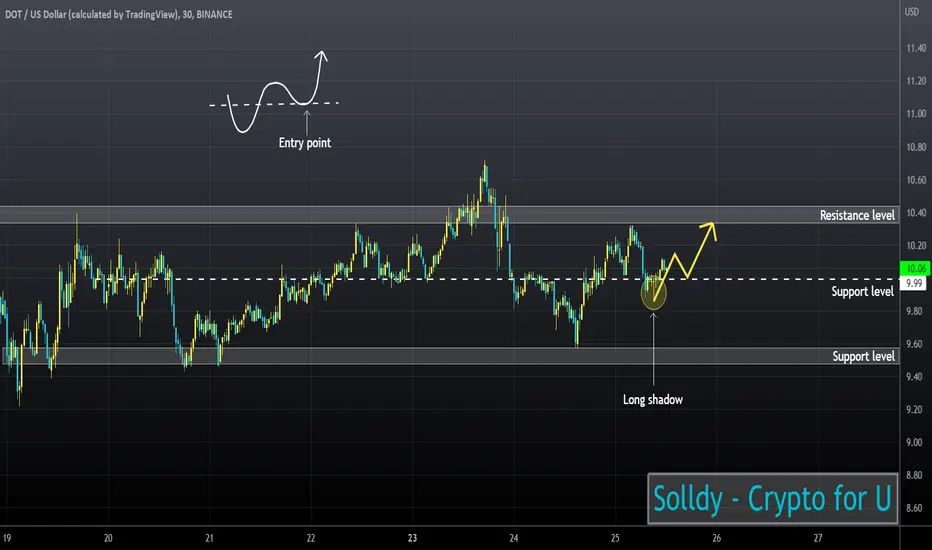
DOTUSD ❕ between levelsPolkadot moves between levels.
DOT has broken up 200MA on the 30m Timeframe.
Trading volumes and long candlestick shadows show interest in price growth.
I expect the price to fix above the support level and then continue to rise.
What do you think?Let's try
I have below the reference link, which is mine too.
I did it first on CMC and was like "Hey why not post it on TradingView while we're at it"
And here I am now :'D

DOT 4h shortSetup: Dot is bearish on both the 1 h and 4 h timeframe. It shows signs of constantly getting rejected by the POC which is confluent with the 50 EMA. Furthermore, it is currently ranging but the OBV is making a lower low, signifying a divergence.
Entry: 10.096
SL: Trail using the SAR( currently at 11.486 which is above the POC)
TP: 6

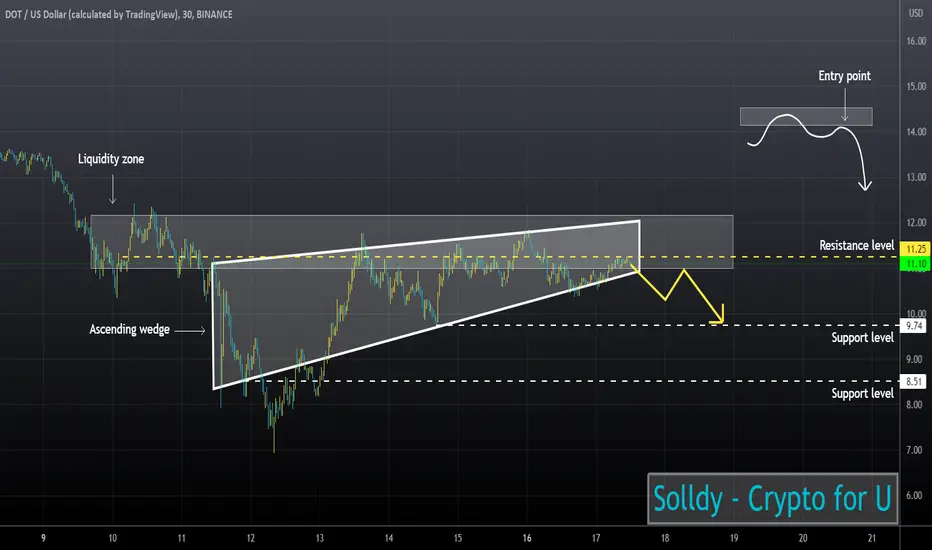
DOTUSD ❕ ascending wedgeAfter the downtrend Polkadot formed an ascending wedge.
Volatility has declined.
Price is near 200MA on the 30m Timeframe, under the liquidity zone.
I expect price to continue falling to the target shown on the chart after it has fixed under the liquidity zone.
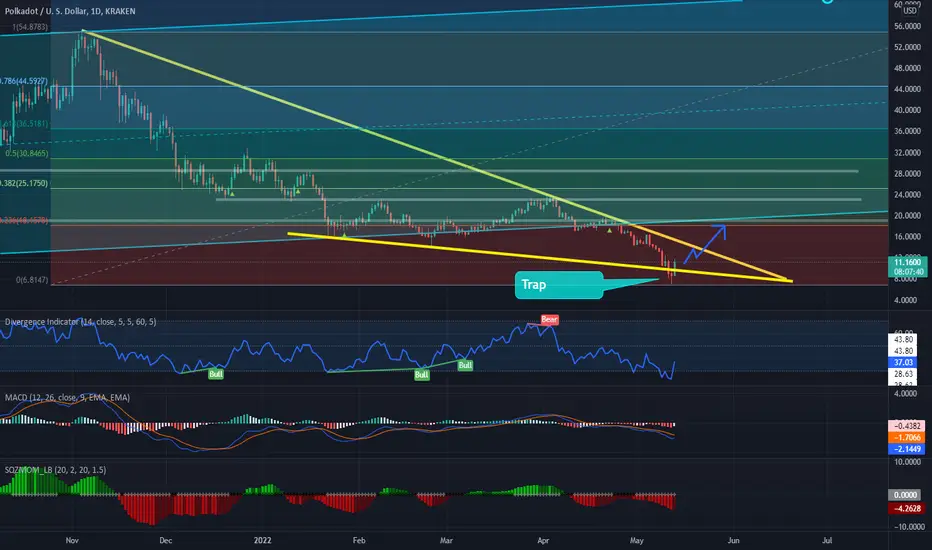
DOT Bear TrapDOT broke the lower lows of summer 2021 with large volume.
Appears that was a trap. DOT needs to breakout of the wedge and clear $19 for the next run up.
Indicators are oversold.
Good Luck