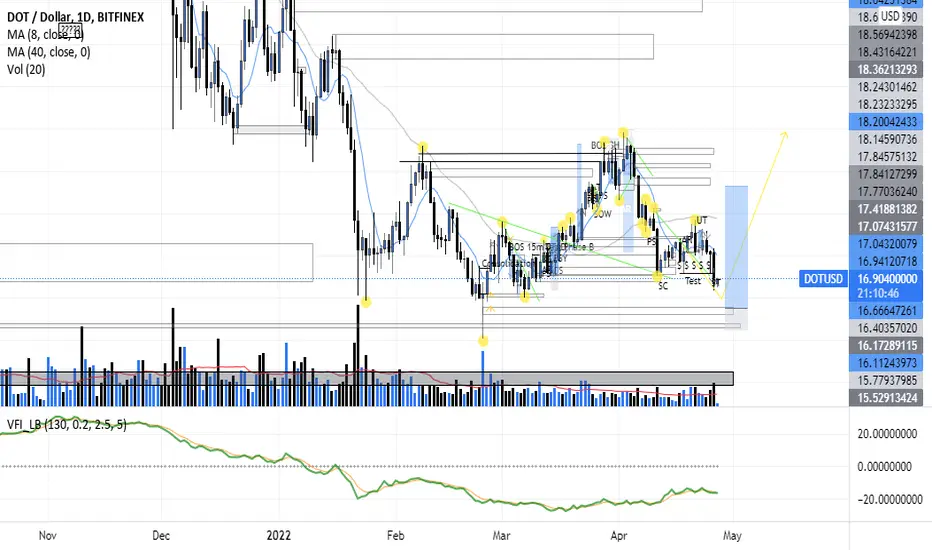
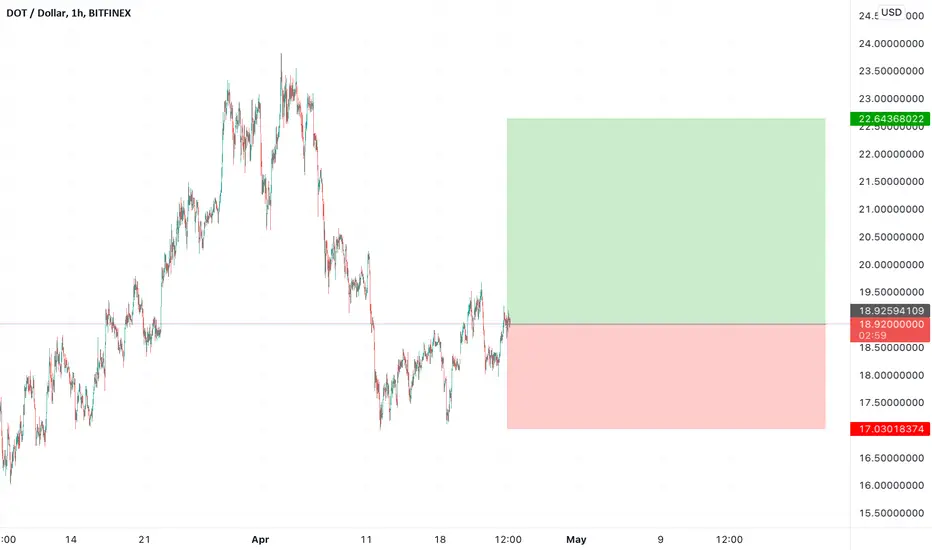
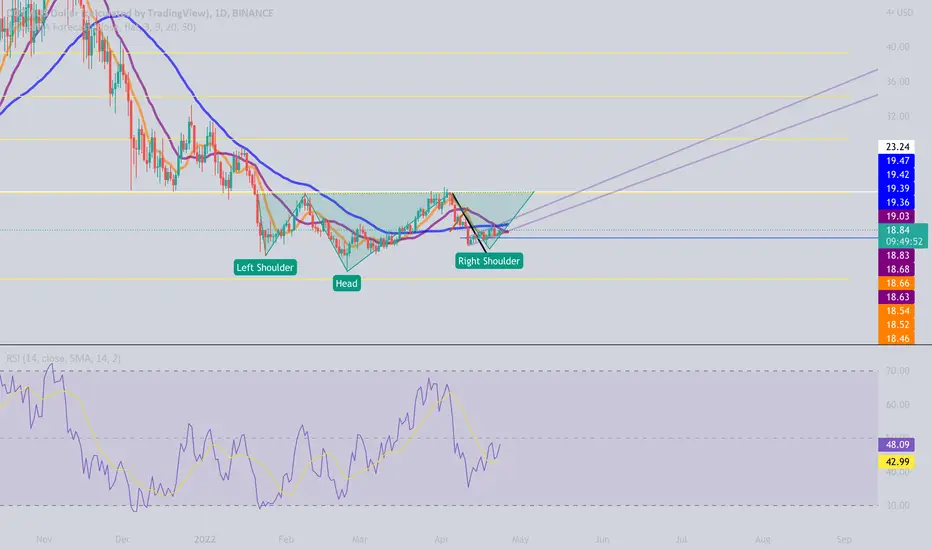
DOTUSD ❕ lower boundary of channelAfter the formation of the pattern head and shoulders, Polkadot rebounded.
During the rise, the DOT broke up the downtrend line.
Price is rising on rising volumes.
At 30m Timeframe above 200MA, at 1H Timeframe above 100MA.
50MA breaks through 100MA on 30m Timeframe.
Price is at the lower boundary of the descending channel, and stochastic RSI is overbought on 30m Timeframe.
I expect price may go down to retest the support level, but once it fixes above it, it will rise to the resistance level.
DOTUSD.P trade ideas


What problems is DOT solving that cant be solved with BTCWhat problems is Polkadot solving that can`t be solved on the Bitcoin blockchain and network? Even the most serious altcoins are overvalued and will never see any application for solving real-life problems in production. A close below $26 could create an ugly scenario for people invested in this token. Called the $25 support when the rising wedge broke out on 12-nov, but it looks like this is a short stop to the next support level.

DOT again as we know...!!!
Check out my previous analysis. it is on his way in accordance with his movements as we want.
thans.

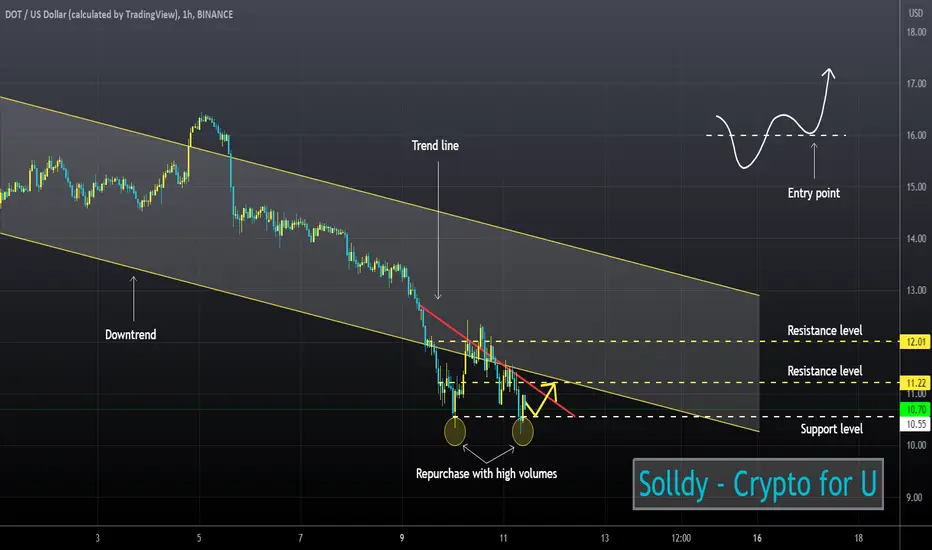
DOTUSD ❕ downward wedgePolkadot came out of the descending channel.
Volatility and trading volumes have decreased, and the current price movement looks like the formation of a downward wedge.
Buyback of the price under the support level happened on the candlesticks with long shadows.
I expect that the price can reach the resistance level if it fixes above the support level. It is important to watch the price reaction to the trend line.
DOT : Set upGlobal view for long
(Watchlist)
.
wait for candle to break out the orange channel to enter

Polkadot Polkadot
Only one step left, Polkadot came to the edge of the abyss.
Polkadot, as part of a downward up-trend on D-1, has fallen to critical lows since early April and approached its historical key support at $12.00, breaking through which risks losing investment interest and, as a result, its liquidity and recovery potential in the short term. The level of $13.00 is not only the middle of the channel and intermediate local support for the downward dynamics, this level may well be a good start for a test of the channel trendline breakout, followed by an attempt to restore its liquidity as part of medium-term purchases. The support level of $12.00 is critical and in case of its breakdown, Polkadot risks updating the historical low of $10.00 per coin.


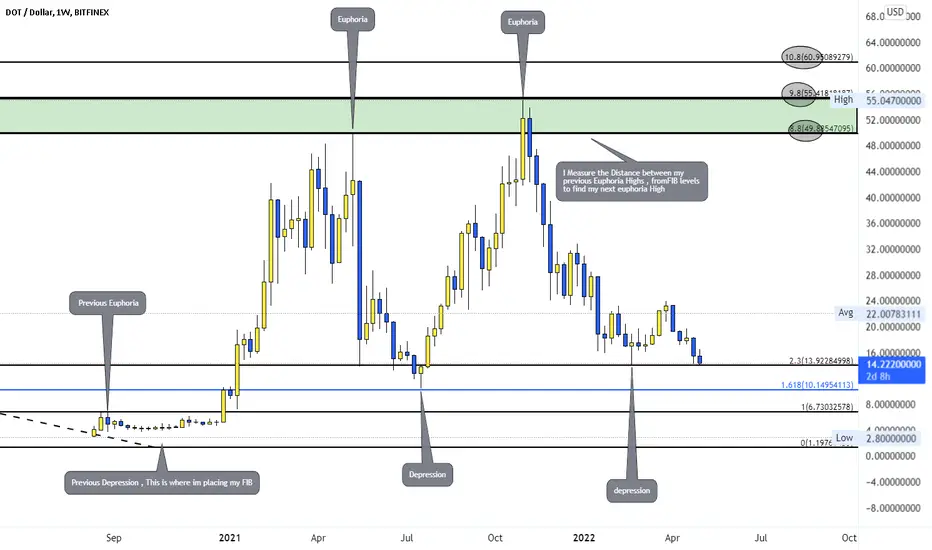
DOTUSD analysis Euphoria High and depressions low Full breakdown how i find my euphoria and Depressions
DOT - THIRD LEG DOWN IN PLAY?
We have really long consolidaion on crypto markets. We can see a half year long wedge on DOT. Falling wedges love to be touched three times on the downside line ;) Third leg down also would mean we are going down from curent range sarted at the begginig of the year, so move down should be huge, 25-30% at least towards 10/11 usd. For now test of 16 is possible.

Falling Wedge on all Crypto... Just gonna put the DOT chart up..Everyone's looking at this... Self fufilling? Probably. PTs @ .618($34~), 1($50), & 2.618 ($120s~)
I'm a buyer at these levels

DOTUSD ❕ local correctionPolkadot continues to move in a downward channel.
Volatility has declined.
The declines were actively bought out.
I expect fixing above the support level, and after that the beginning of the correction.
DOT must hold 14 for Inv.H&S or 11 will be the next D.BottomPOLKADOT forms Inv H&S with the head at 14. Dot has to hold 14 for this pattern to remain valid. Breaking above the neckline at 23 will start a big rally.
If 14 does not hold, expect DOT to make a double bottom at 11.
Not trading advice

#btcstarburst Polkadot DCA Always…Possibly one of the most promising Alts in the space… Great partnerships although still being drained from btc, can see at least 300% gain potential from here… Interesting link is not ahead… I would expect a major jump once staking becomes available sine they are in a class of their own… hopefully people are taking advantage of the market safely…DCA safely get rich in the bear market, be patient and sell with the bulls this is a Gann study

causing concern for the entire cable industry and sending relateComcast saw shares tumble 6.19% on Thursday in its worst day of the year to see prices hit their lowest level since July 2020, despite the telecoms company beating on both ends with EPS of $0.86 on revenues of $31.01bn.
Broadband subscribers continue to slow. Comcast reported 262k additions, but its earnings call revealed that number is actually 180k if you exclude those that converted after enjoying a free service during covid – so basically less people actually signed up.
There is good news though. Its Peacock streaming service saw revenue surge 44% to 13m, helped by a sign-up rush related to the Winter Olympics and the Super Bowl. Its cable TV segment, however, lost a record number of subscribers, causing concern for the entire cable industry and sending related companies lower in sympathy.

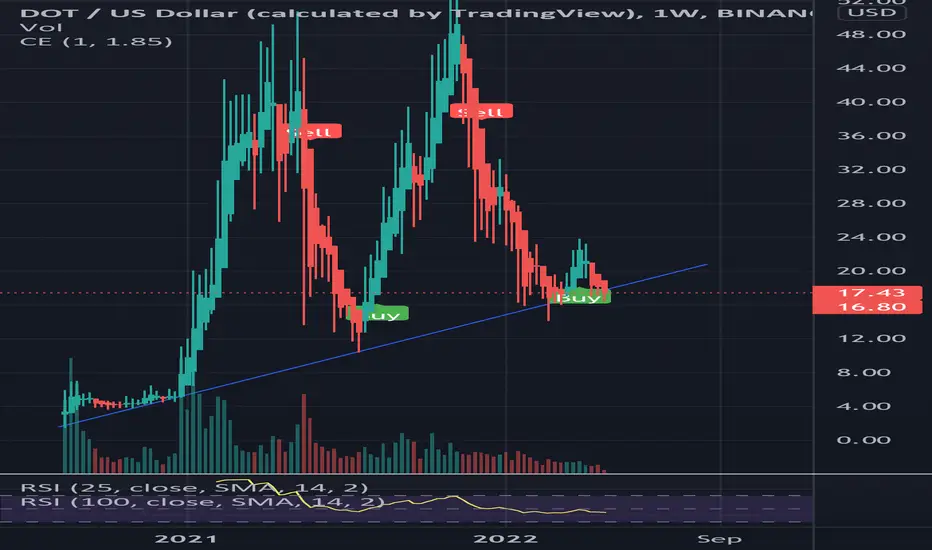
DOT testing support trend line-If Bitcoin continues to slump, DOT will be in confirmed bear market territory breaking down the diagonal trend line.
-The chandelier exit still has not printed a SELL signal on the weekly, however, it appears to be heading that way.
- Be very cautious with your entries here as we may see capitulation down to the $10 - $12 levels and possibly further downside, depending on where btc finds support.
-Not financial advice. (:
DOT USDEnding accumulation. Maybe ready to go a little low to grab liquidity (small short) and go up (long).
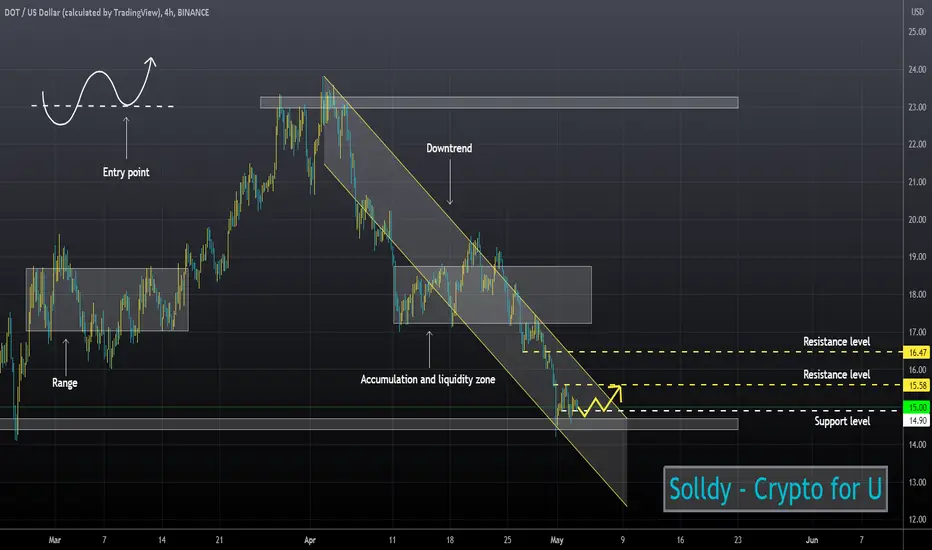
DOTUSD ❕ trend line compressionPolkadot is trading in the liquidity zone.
50MA and 100MA on the 4H Timeframe form a golden cross.
Price is testing the resistance level and holding the downtrend line.
I expect an upside within range after a trendline breakout.

DOT : SCALPINGThis is my trading diary, if u follow it please set SL at ur acceptable risk
(For scalping method only not for investors/coin holders)

4I would like this idea on my public profile only, I don't mind if it's not in the trading view ideas section.
what is the destiny for dot?Dot can complete this formation when btc go up. Its not financial advise. Make your own strategy. If u liked this idea, dont forget hit to like button
DOT Welcome back to the PARTY!DOT should finally come alive with a candle close above the MA50 and descending YELLOW trendline. Once cleared there should be a steady progression to the 50% retracement at $34
As many other tokens MACD should cross exposing higher levels.
Good Luck

Polkadot slow mode- in my older analyze i predicted Polkadot bottom around 15.5$ :
Here older post :
- the problem with common alts is they are naturally following TheKing moves.
- if TheKing stays weak then altcoins will just standby and wait for his next move, then some will move harder if BTC pump and weaker if BTC dump.
- Polkadot is an heavy project with so much parachains, in the future i see DOT number 3 on CMC next to BTC and ETH.
- Many concurents as Solana or Luna made bigger moves than DOT, because they are going very fast, deploying multiples projects at the same time causing multiples bugs on their chains.
- Polkadot is safer, they are building slowly but surely
------------------------------------------------------------------
Trading Part
------------------------------------------------------------------
- if u check Weekly MACD in graph u will notice that it made a flat move
- Normally we had to turn bullish 3 weeks ago but we stayed weak, could consider that as fight between bulls and bears or a consolidation.
- in the worst case a good buying zone is around 13$, i don't see any lower bottom for DOT.
- if we are in a consolidation then a buy is possible right now but it's pure gamble, i recommend to wait.
- TP are accorded to Fibo and simple :
--- TP1 : 30$
--- TP2 : 40$
--- TP3 : 80$
------------------------------------------------------------------
Stay Safe and Happy Tr4Ding !
