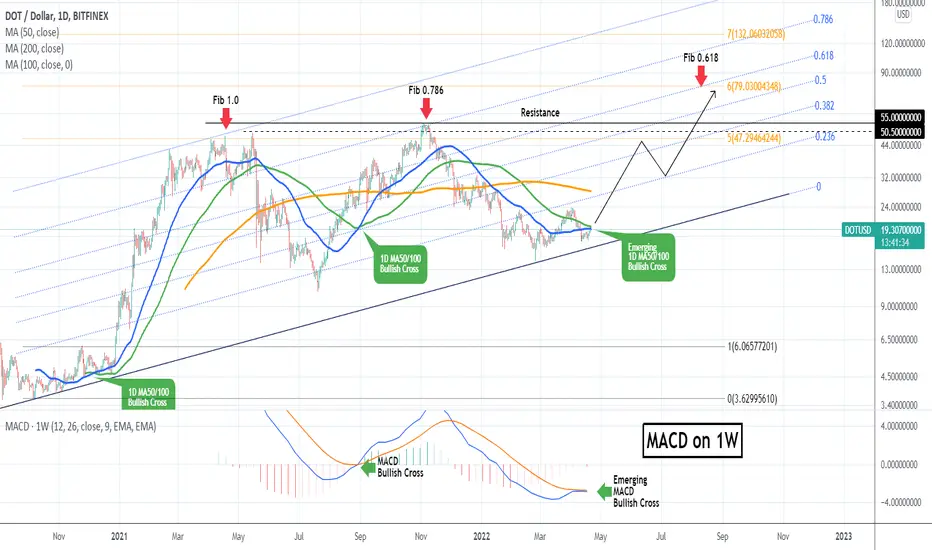
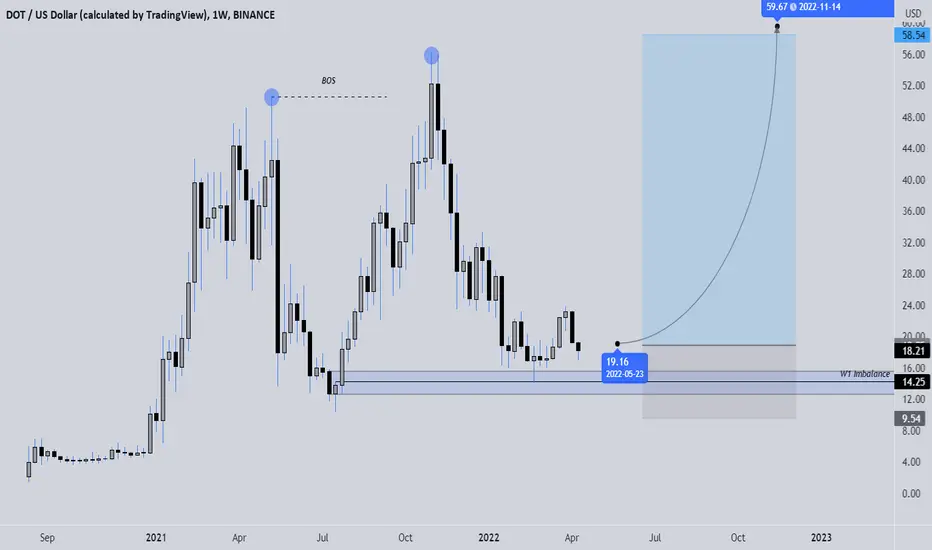
DOTUSD forming key Bullish Crosses. Start of major rally?Polkadot (DOTUSD) is currently testing both the 1D MA50 (blue trend-line) and the 1D MA100 (green trend-line) as Resistance levels. Even a modest push upwards will be enough to cause a Bullish Cross formation between the two trend-lines. Last time we saw this pattern was on August 30 2021, which was half-way through the last major rally that formed the All Time High (ATH).
Interestingly enough, even DOT's first 1D MA50/100 Bullish Cross on December 05 2020 was enough to kick start the massive rally of the early 2021. What is even more interesting is that the MACD Bullish Cross formations on the 1W time-frame perfectly coincide with the 1D MA50/100 Bullish Crosses. Right now the 1W MACD is about to pring that formation the same time the 1D MA50/100 makes the new Bullish Cross.
This is strong evidence that DOT is ahead of a major rally. Our first long-term target will be the 50.500 - 55.000 Resistance Zone of the prior All Time Highs. If broken with a 1M candle closing, then we expect the Cycle to peak around the 0.618 Fib of the Channel Up and the 6.0 Fibonacci extension. The reason is that the last two Highs within the Channel took place on the Fib 1.0 and Fib 0.786, so if that's a sequence then every High is one Fib retracement level lower. Also the 5.0 Fib extension (orange) marked both of those highs so if broken, technically the 6.0 Fib ext is next.
--------------------------------------------------------------------------------------------------------
Please like, subscribe and share your ideas and charts with the community!
--------------------------------------------------------------------------------------------------------
DOTUSD.P trade ideas
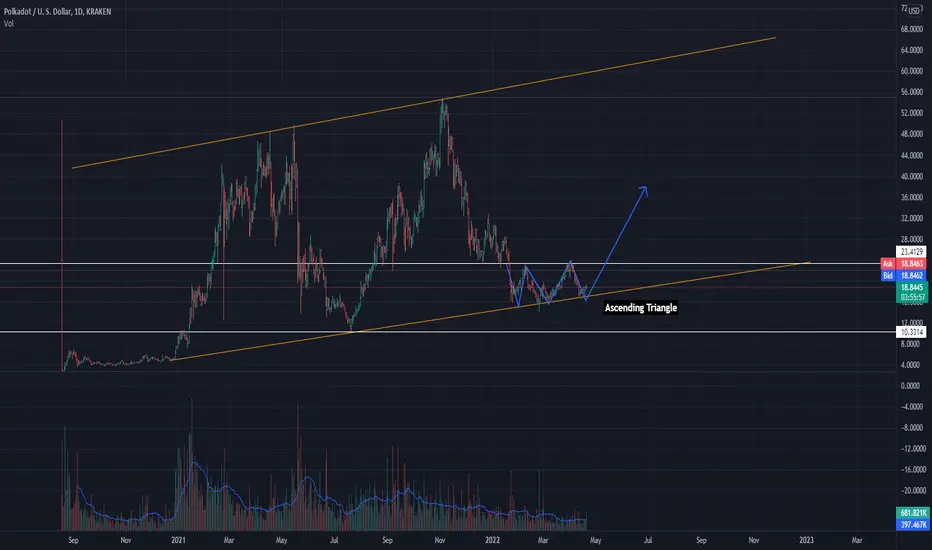
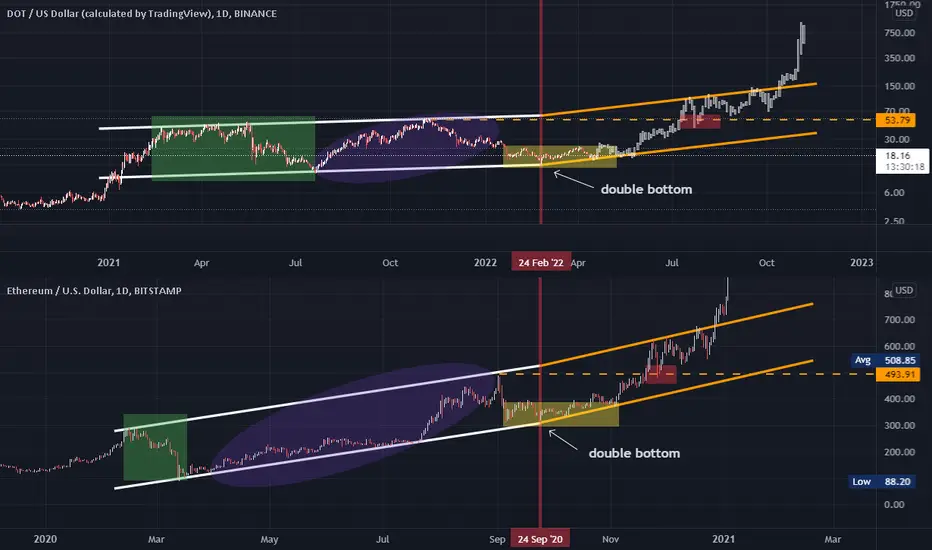
DOT - WHAT POSSIBLE HIGHER LOW TELLS USIf we hold higher low crated at 17 usd than we can see cointnuation of accumulation like on ETH before. Channel can be broken at our double bottom point and from here angle of second leg of channel should be bigger so in general channel wille get more steep.
DOT USDWaiting for this to finish Accumulation and go up? Hope to catch it at the bottom or at least at LPS
DOT making Inv H&S or going for a retest of previous bottom?Dot so far seems to be trying to complete the RS of an Inv H&S pattern. However if this fails, a retest of
the bottom support zone may be next.
Not trading advice

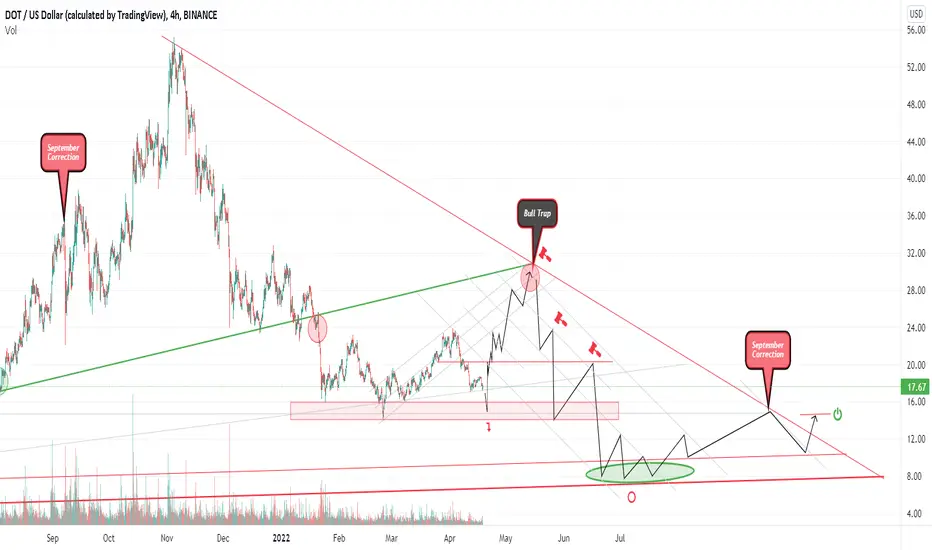
Game plan for DOT POLKADOT
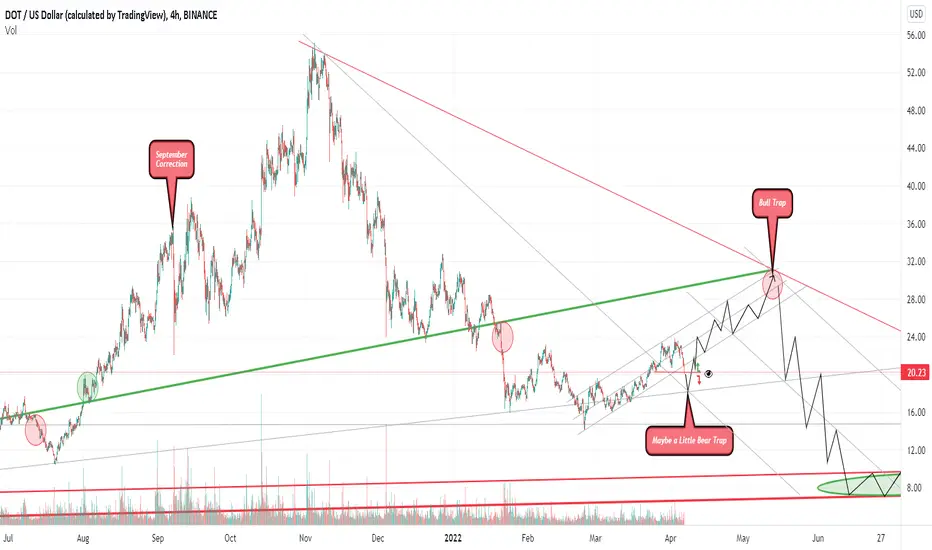
If there is a last pull up for distribution and termination of the cryptocycle, then I imagine such a path at DOT.
Not the financial board.
Just for fun.
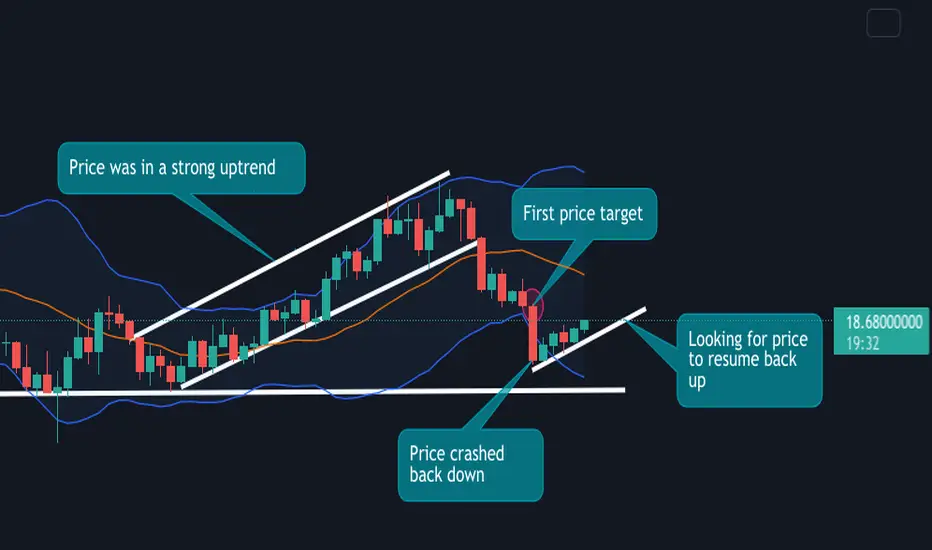
Longing DOTLooking for Dot to continue uptrend. Had brief dip when price crashed. Now after several green days looking for price to resume upwards. First TP at around $19.10

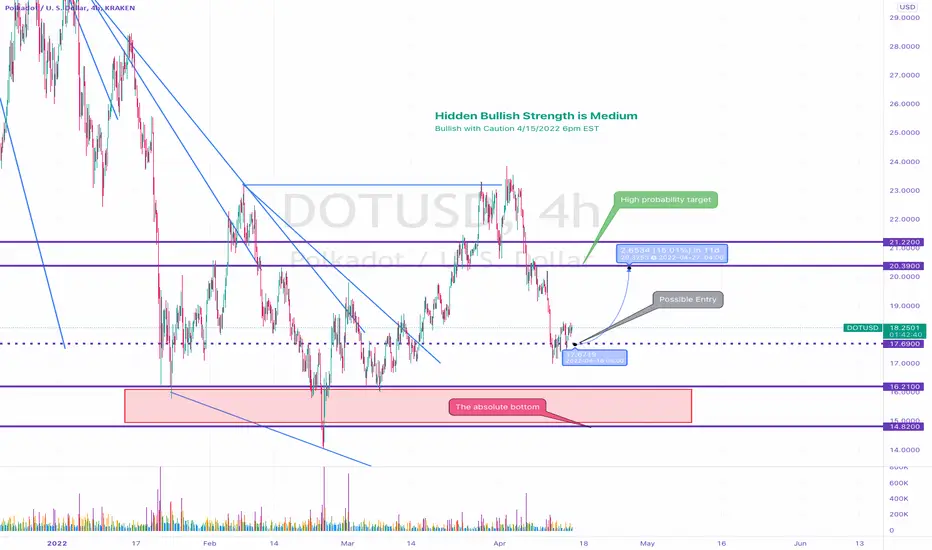
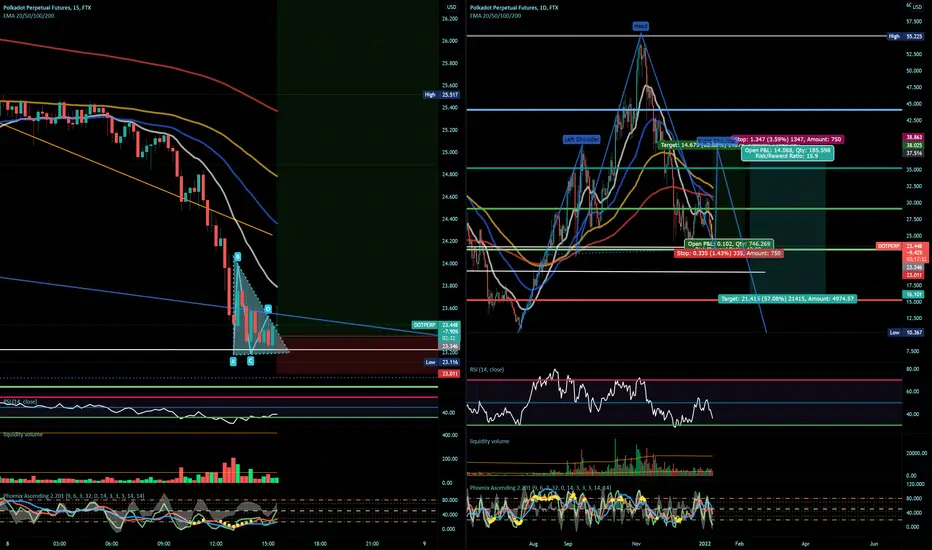
DOT 15% gain entry incomingToday I'm doing something a little differently. I've decided to let the charts speak in detail instead of a lot of words. If I have something special to say about the specific instrument. I will mention it here. For general Crypto updates, please take a look at my BTC update.
One thing to keep in mind is that we are in a short-term downward wave today and we haven't reached the end of it.
DOT - Short it! Here is why 👀- Market is bearish
- We are in a short trend
- The level is clearly seen
- There has been false breakdown
- Instrument did breakout but there no acceleration
- 5th touch
- ATR 40
- Under VWAP
What do you think of this idea? What is your opinion? Share it in the comments📄🖌
If you like the idea, please give it a like. This is the best "Thank you!" for the author 😊
P.S. Always do your own analysis before a trade. Put a stop loss. Fix profit in parts. Withdraw profits in fiat and reward yourself and your loved ones

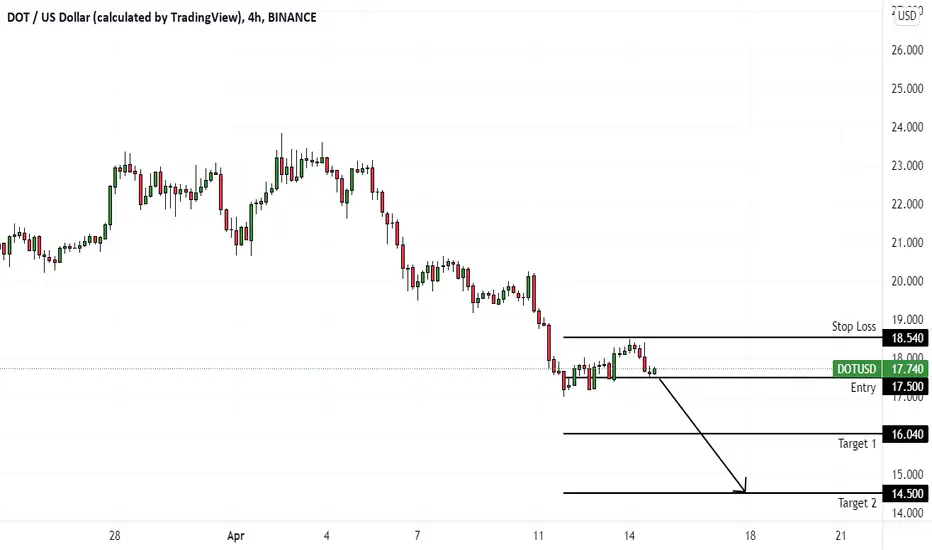
DOTUSD (4H) Bearish wave We2Hi Traders
DOTUSD (4H Timeframe)
A high probability, entry signal to go SHORT will be given with the downward break of 17.50 after the market found resistance at 18.54. Only the upward break of 18.54 would cancel the bearish scenario.
Trade details
Entry: 17.50
Stop loss: 18.54
Take profit 1: 16.04
Take profit 2: 14.50
Score: 8
Strategy: Bearish wave We2
POLKADOT LONGS ✅✅✅Expecting bullish price action on POLKADOT from a weekly perspective as price is in a huge bullish market strucutre on the HTF premise, price rejected the bullish orderblock on the W1 that could act as a valuable area of ,,support,, if you will for the price and from there we can see a clear move to the upside.
What do you think ? Comment below.
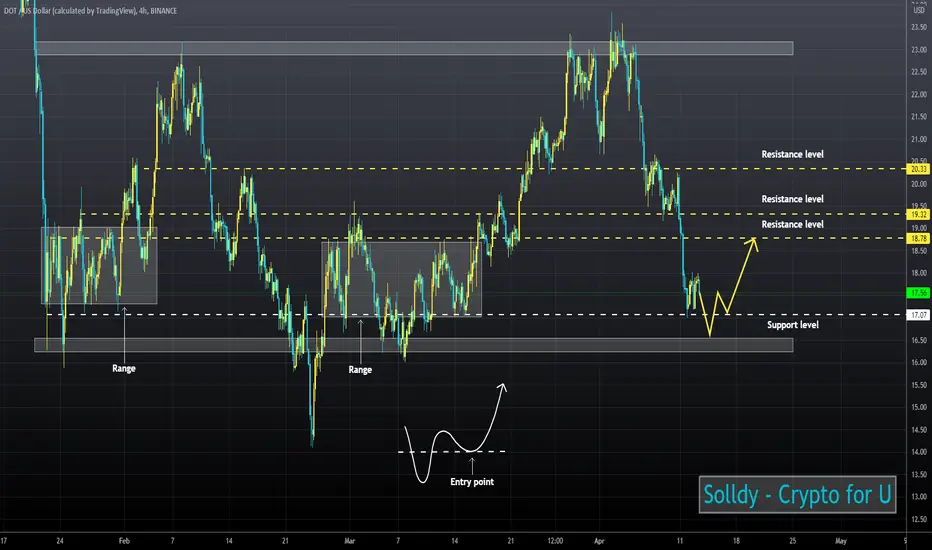
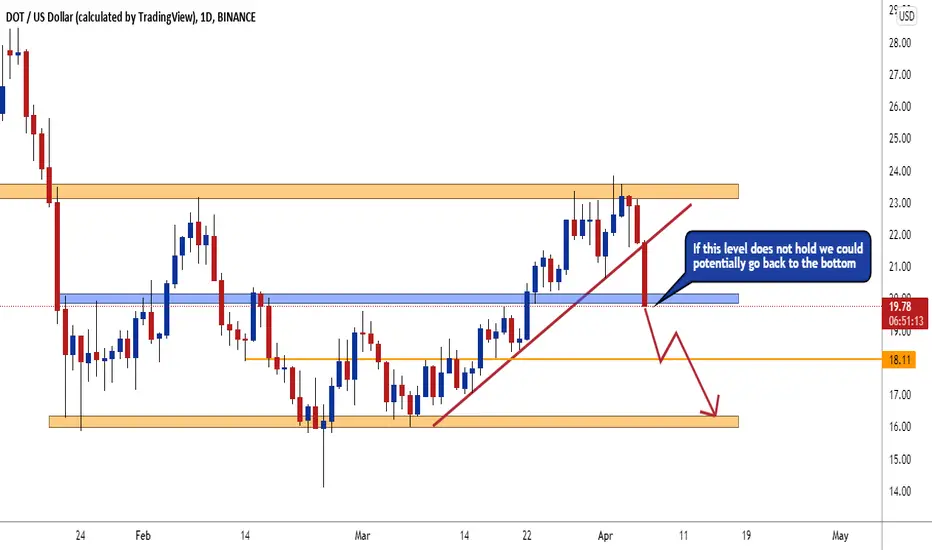
DOTUSD ❕ at the edge of the tradingThe coin has been trading in a sideways trading range for 3 months, we are near the lower boundary. And now the price is at the zone level, where the previous 2 times the price broke the zone up. I expect a retest of the support level, and after the move to the resistance level.
DOT potential Head & Shoulders play (risky)Trying a play on this potential head and shoulders play. But market must not fail now for this to be valid. Fingers crossed. Feel free to share disagreements or factors I'm missing. Or if you agree and can see it happen as well.
DOT: +$250DOTUSD
Technically and fundamentally, DOT has the potential that reaches $250 by 2024. let's see where it goes.

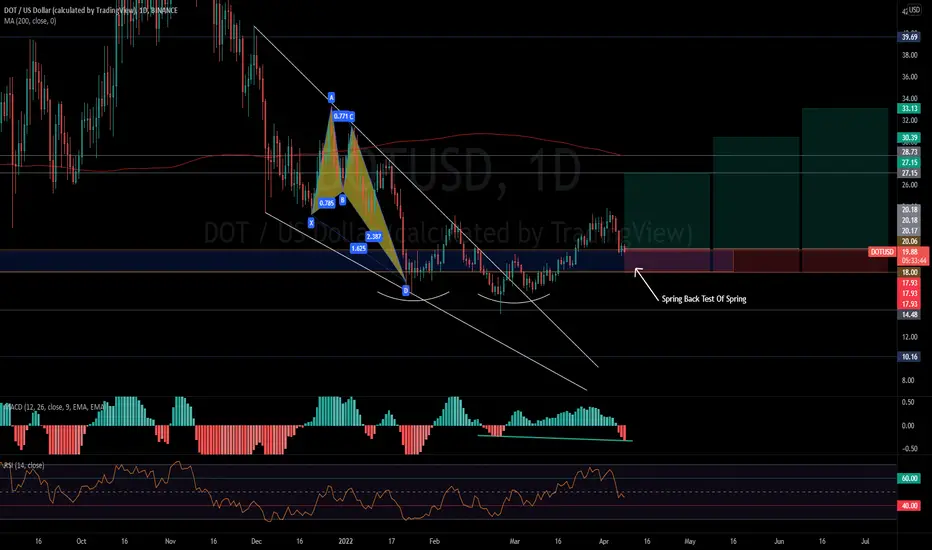
DOT USD | Bullish Butterfly | Falling WedgeSpring back test of spring at critical inflection zone, macd hidden bullish divergence in development. If the back test of spring is successful Dot should see higher prices. BINANCE:DOTUSD
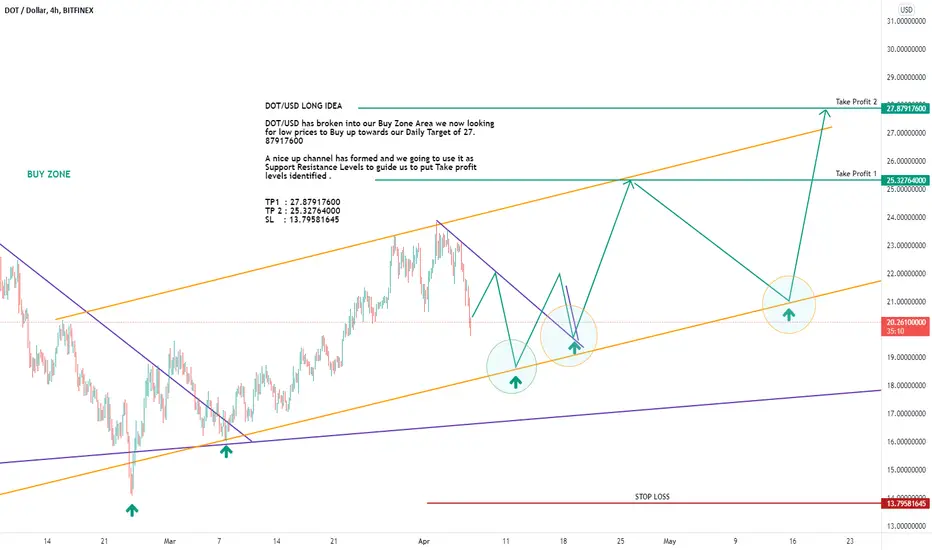
DOT/USD LONG IDEADOT/USD LONG IDEA
DOT/USD has broken into our Buy Zone Area we now looking for low prices to Buy up towards our Daily Target of 27.87917600
A nice up channel has formed and we going to use it as Support Resistance Levels to guide us to put Take profit levels identified .
TP1 : 27.87917600
TP 2 : 25.32764000
SL : 13.79581645
DOT bull Run set upDOT Bull Run soon , May and April will be big months for crypto Lets goooooooo Lets make this MF money
DOTUSD Similar to other Crypto which is viewed as 'RISK-ON' asset DOTUSD seems ready for further bear pressure
Game plan for DOT _ Target $ 30 _ The DOT is likely to be in the area around $ 30 on May 13 and there is a high risk of correction and the end of the crypto cycle.
Only closure over a given area can invalidate this plan.
Not the financial board.
Just for fun.
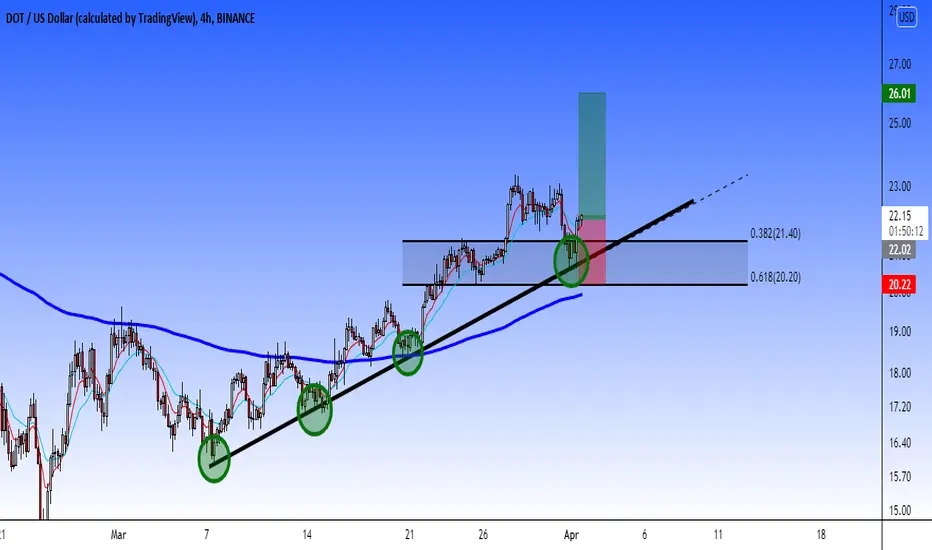
DOT/USD: Trend line lower highPolkadot forming a nice trend line lower high since $16.12 USD in the date of March, 07, 2022 and we see an uptrend. Also, you can to put a buy now and SL to $20.20 USD and target to $26 USD. Also, the target toward $24 USD could be good if in case that DOT doesn't reach the $25 USD or we see any correction toward this trend line.
So guys, it's very easy we see that Polkadot forming a lower high in this market structure.
This it's the H8 timeframe and I see a bullish structure from this timeframe.
This will be a risk/benefit of 1:2
Good luck!!!
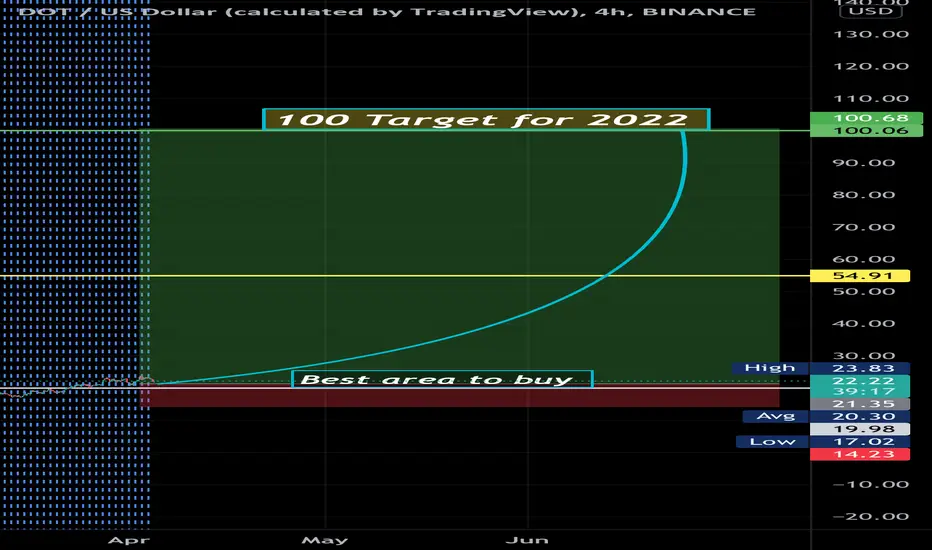
Bullish reason for DOTUSDThe rebound has hit DOTUSD.. and made a bullish to make a reversal turn. The dip found the really strong support from 20-21 area, has made the bulls to make the turn to keep going up and broke the resistance from the recent break. The bulls should upward sideways and maintain the recent highs and then go higher.
Target is 100$ For 2022 .. if the highs surpass then we will see about 150. Good luck y’all don’t forget to buy this at Coinbase
Long DOT on Daily closeLet's Long on a daily close above horizontal resistance.
Targeting 200D.
RR 2/1
