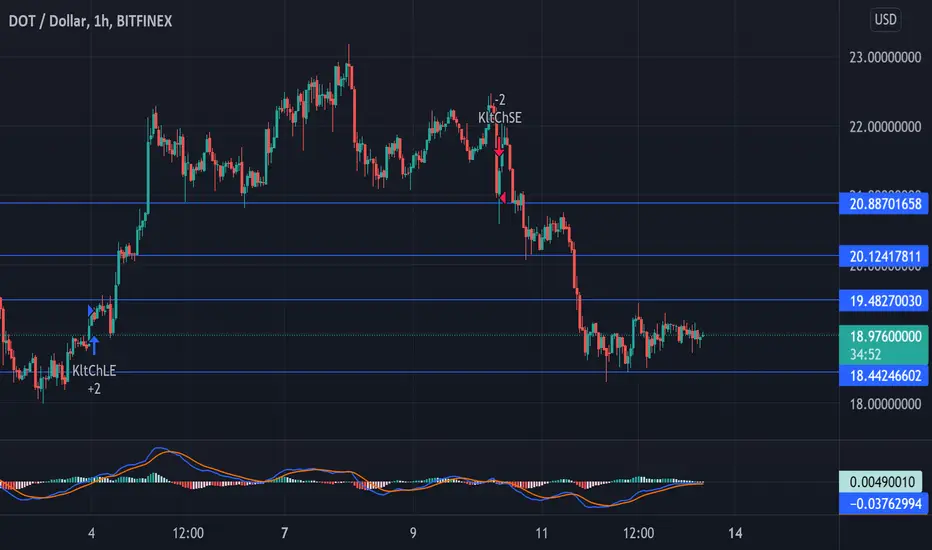
DOT about to Breakdown from MASSIVE Price Channel. SHORT.These crypto charts are ALL looking various shades of UGLY.
Already traded this one earlier with SHORT from $21.79. Closed that trade and NOW SHORT again.
We are breaking down from massive Price channel of the last 2 years (Solid Think Yellow Lines). On the Daily chart we have tested this level many times and the momentum is picking up to the downside as well as all small rallies have been sold to reach support here.
I am anticipating a break of the thin yellow support line and a washout lower.
Trade what you see.
DOTUSD.P trade ideas

Polkadot | Weekly TimeframeThis is the last Altcoin we will look at today.
Polkadot (DOTUSD), weekly (W) timeframe.
We have the same base as the other Altcoins we looked at, namely ETH, ADA & SOL.
That is a bearish candle this week with bearish indicators.
Both the MACD and RSI are trending lower.
The mixed signals here are coming from the ascending trendline of the giant flag drawn.
The rising trend-line can work as support and the uptrend resume... If this support fails we are likely to see lower.
I also looked at the 3 Line Break and Renko charts and they are fully bearish...
We will know soon anyways.
Thank you for reading.
Wishing you a lovely Sunday.
Namaste.

The Range PlayMonday will be a defining day in are short crypto history, yet it will define the next 6 months of trading. Make clear and educated moves and we will all enjoy the outcomes
remember have fun and don't stress!
What I expect the DOTUSD do retesting the 10 dollars area What I expect the DOTUSD do is retesting the 10 dollars area forming double bottom on the week time frame since we broke the up trend line from the week time frame.
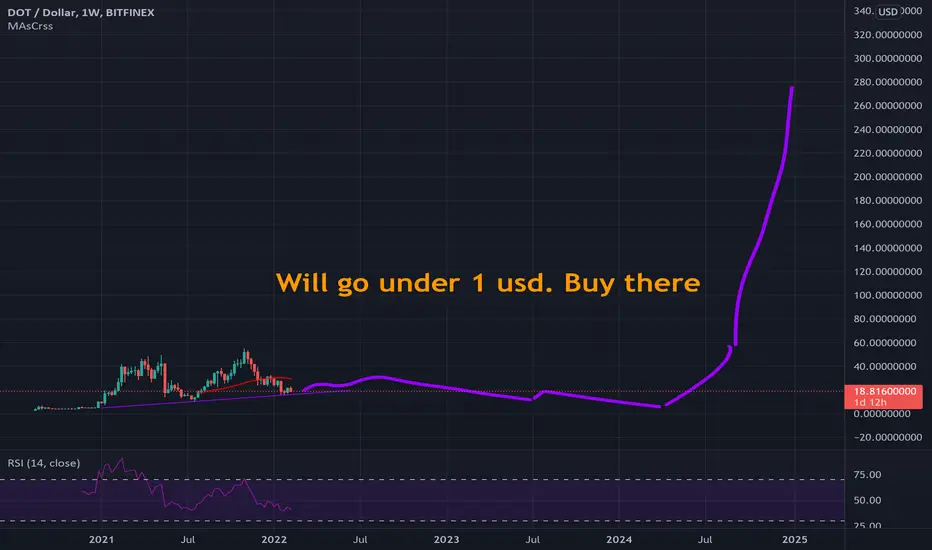
People say DOT is good. DOT is futureI don't know why people want to connect Blockchains. But they seem to want.
DOT chart makes new LL and LH, Shorting is Beneficial.i,m going to short DOT Coin because DOT chart pattern makes new LH and LL.

Possible DOT movements.DYOR. NFA.If DOT follows past performance. Most likely will not, but it is something to follow in case it does decide to have some synchronicity. I think this last BTC pump was a liquidity grab and way for exchanges to cash in on one more LONG liquidation. Following I believe we will go down to the $15-$16 range a small bounce back to $19 -$20 range and then a drop the $13-$14 range then I believe its a 2 to 3 mo bull cycle. All of this is keeping macro economic events out of it, including an S & P crash in Mar due to fed raising rates and inflation being out of control. Only time will tell. These are just wild ass guesses of course. No one knows what the future holds.

DOT - HIDDEN BEARISH DIVERGENCE - $13 DOT has created another hidden bearish divergence on the daily chart with another move below 50 on the RSI
this combination has not treated traders very well on this down trend. looking for more downside in DOT
not trading advice
tg

Pokadot long ideaWhat does everyone think, i believe the bleed is over and is time to make some money

Buy MTF Polkadot!Polkadot has clearly broken out of its downtrend we are buying dips near the red lines... Divergences on the RSI as well. HODL if you are all in.

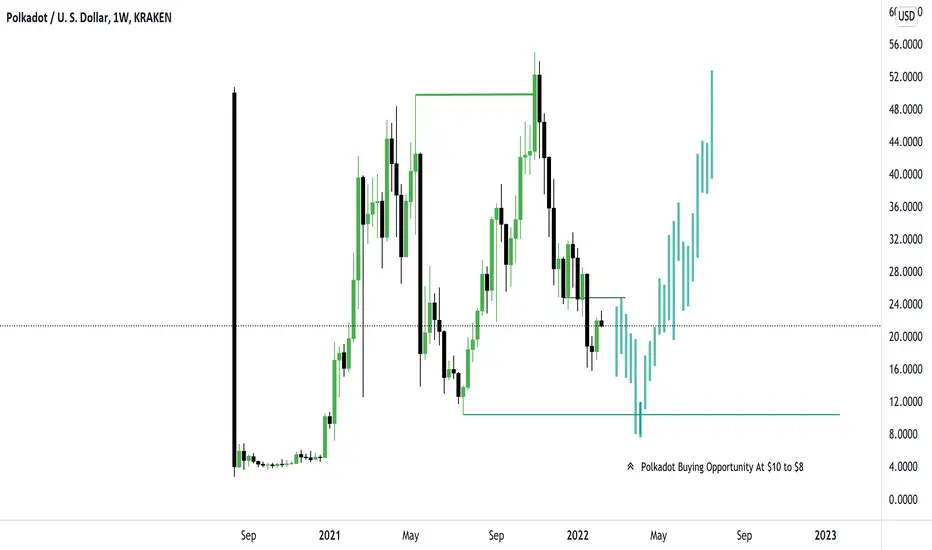
Polkadot Analysis
Polkadot is an open-source sharded multichain protocol that connects and secures a network of specialized blockchains, facilitating cross-chain transfer of any data or asset types, not just tokens, thereby allowing blockchains to be interoperable with each other. Polkadot was designed to provide a foundation for a decentralized internet of blockchains, also known as Web3.
I think a great buy would be below the $10 dollar price - preferably around $7 dollars.

DOT Diem fundamentals dissolve, more bullish on SOL nowTo keep this short, it's now very public knowledge that Diem is no longer being pursued by FB and therefore the fundamentals have decreased for DOT. I still remain bullish on DOT but this is likely going to play out over a longer period of time. I would diversify into market leaders like SOL in the meantime and get some exposure to this top project as I've spoken to some developers and they speak about the ease of use with Solana's programming language which is a game changer in terms of onboarding legacy developers into the crypto world.
Here's my latest post on SOL:

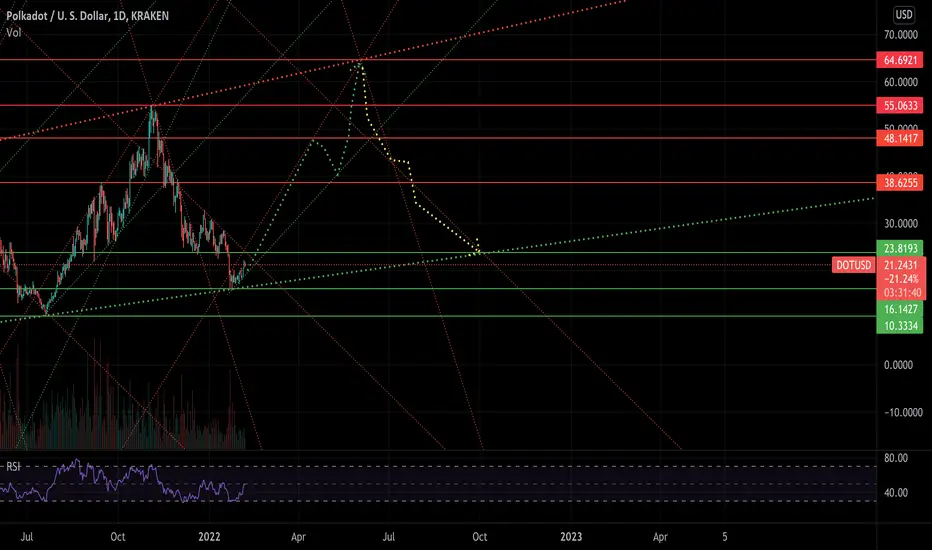
Polkadot Buy Opportunity (Idea) <$10As you may have seen with my other published idea on BTC. I'm anticipation BTC to fall to $20 to $25K as target for a 'potential' buying idea. If this does occur, it therefore supports this idea of seeing Polkadot fall to the $8 to $10 dollar range (possibly lower). Lastly, the BTC idea supports by other idea on Solana.
My analysis clearly consist of a clear degree of inter-market analysis.
Feel free to engage and share your thoughts in the comments.
dot finishingdot breaks out of downtrend
Break through the pressure of the platform
Short-term expected shock upward
Follow me to take you to achieve financial freedom
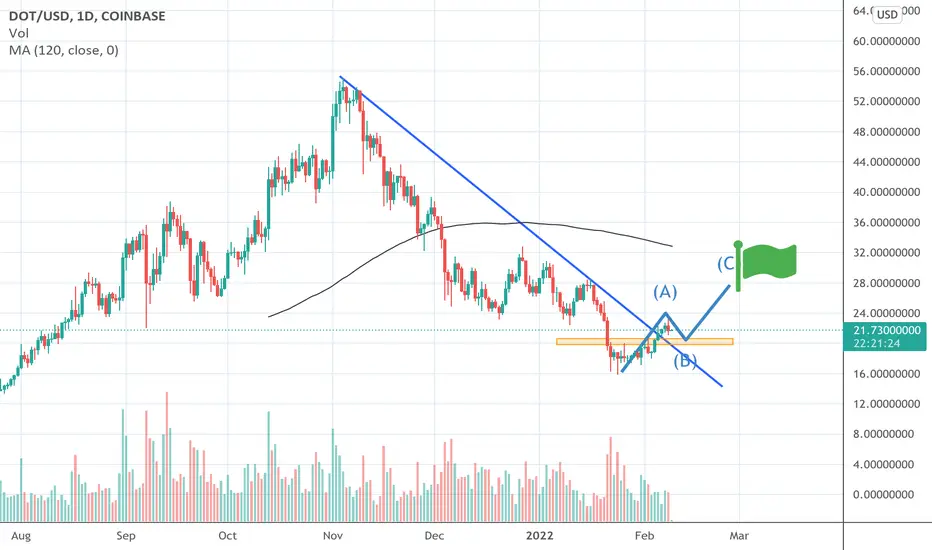
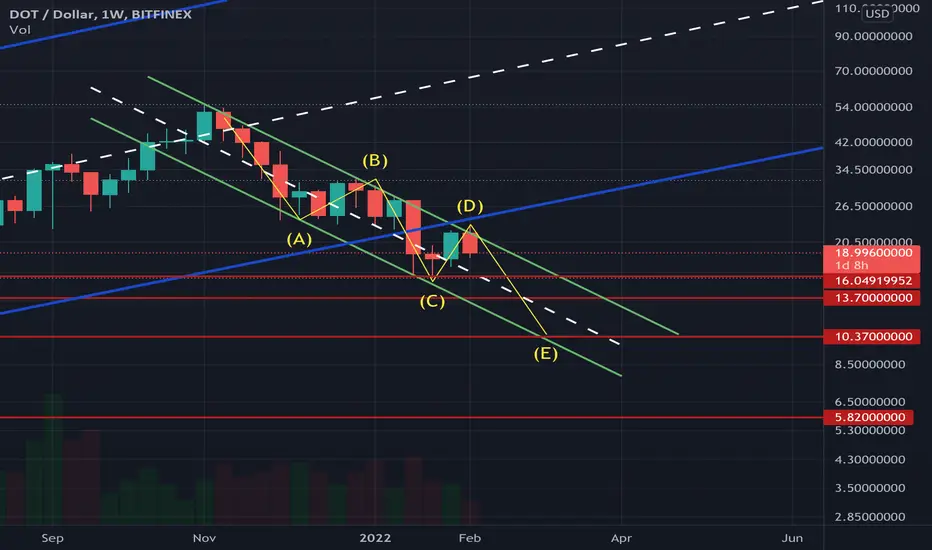
DOTUSD CorrectionHey folks, I hope you are having a wonderful day so far!
DOTUSD seems to be forming a big ABC correction pattern along with an ABCDE correction pattern. The breakout will be very bullish and it will be a pretty good long-term trade! Short term wise, I would personally short it and wait for the price to reach pattern E.
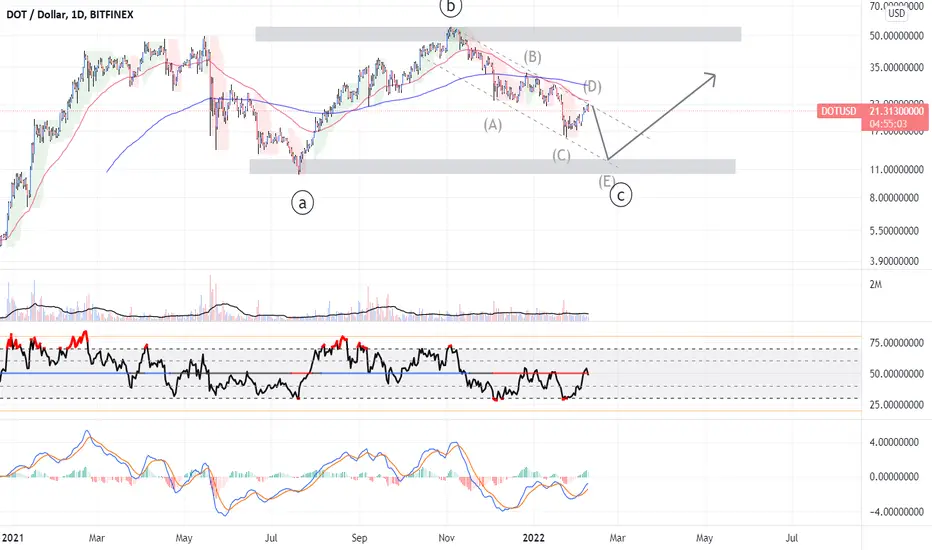
Polkadot don't give up-Do you remember last dip (May-July) ? i posted analysis and found the perfect bottom at 10$. ( i will post it in comments )
- So this time imho it's not the same because alts are almost bottomed already.
- This graph is a bit messy but you can see clearly demands zones.
- The difficulty is not to find where we go but when we go.
------------------------------------------------------------------
Trading Plan
------------------------------------------------------------------
Buy : 24$-25$ ish
Rebuy : 20$ ish
------------------------------------------------------------------
Tp are unchanged from my last analysis
TP1 : 75$ ish (161.8%)
TP2 : 100$ ish (216.8%)
------------------------------------------------------------------
Believe in Polkadot because to be a part of Parachain, Projects have to buy more DOT, Polkadot is poised to go up with time.
if you didn't take the train in July. You get another opportunity right now.
As always follow TheKing movements for safety!
Happy Tr4Ding !

DOT moving upWatch for S/R flip between $22.30 - $22.50
Once that is established $27 will be the next target.
Good Luck

DOT Exchange Trading Idea 22-02-06This is looking good. The BTC bounce is helping all cryptos but DOT really has been stronger than most. Might be the last time we see these prices.

Polkadot (DOT) - February 7Hello?
Traders, welcome.
If you "follow", you can always get new information quickly.
Please also click "Like".
Have a nice day.
-------------------------------------
(DOTUSD 1W Chart)
It is important to keep the price above the 20.27 point.
If the price holds above the 20.27 point, I would expect it to move above the 30.75 point.
If it goes down from the uptrend line, it could fall below the 10.16 point, so trade with caution.
It must rise above the 30.75 point to turn into an uptrend.
-------------------------------------
(DOTBTC 1W chart)
0.0003 911 - 0.0004 872 or higher: Expected to create a new wave.
However, it must rise above the 0.0005 850 point to turn into an uptrend.
A drop below the 0.0003 911 point could lead to a drop below the 0.003 242 point, so trade with caution.
------------------------------------------
We recommend that you trade with your average unit price.
This is because, if the price is below your average unit price, whether the price trend is in an upward trend or a downward trend, there is a high possibility that you will not be able to get a big profit due to the psychological burden.
The center of all trading starts with the average unit price at which you start trading.
If you ignore this, you may be trading in the wrong direction.
Therefore, it is important to find a way to lower the average unit price and adjust the proportion of the investment, ultimately allowing the funds corresponding to the profits to be able to regenerate themselves.
------------------------------------------------------------ -----------------------------------------------------
** All indicators are lagging indicators.
Therefore, it is important to be aware that the indicator moves accordingly with the movement of price and volume.
However, for convenience, we are talking in reverse for the interpretation of the indicator.
** The MRHAB-O and MRHAB-B indicators used in the chart are indicators of our channel that have not been released yet.
(Since it was not disclosed, you can use this chart without any restrictions by sharing this chart and copying and pasting the indicators.)
** The wRSI_SR indicator is an indicator created by adding settings and options to the existing Stochastic RSI indicator.
Therefore, the interpretation is the same as the traditional Stochastic RSI indicator. (K, D line -> R, S line)
** The OBV indicator was re-created by applying a formula to the DepthHouse Trading indicator, an indicator disclosed by oh92. (Thanks for this.)
** Support or resistance is based on the closing price of the 1D chart.
** All descriptions are for reference only and do not guarantee a profit or loss in investment.
(Short-term Stop Loss can be said to be a point where profit and loss can be preserved or additional entry can be made through split trading. It is a short-term investment perspective.)
---------------------------------

Can Dot do it again? 400% in 3 monthsFind out in 6 months.
Strong sup and res, all trends cloned, 3 months and a week or so - check back on 2nd Jun
Polkadot ($DOT) New DTF FIB$DOT BULLS respect $20.33 FIB support while smashing through $21.21 FIB resistance. Need to touch $23 FIB level to have a chance at conquering 50MA

DOT - Short ScalpPrice action is reaching near the top of the downward parallel channel formed in the 1d timeframe.
We are looking for a re-test on the resistance trend line.

Polkadot EW Bullish CountIf this is not a raging bull somebody please tell me why not.....answers keep polite please!
