DOT resistance and support to $60As you can see, DOT is respecting the boundaries of the pitchfork.
These lines provide areas of resistance on the way up to ATH.
In the short term, I see $60 as the next target for profit taking.
I bought more DOT during this dip, but I am always impressed at who manages to buy it at the exact bottom, to maximize profits!?
Many ALTs are waking up, yesterday may have been the beginning of ALTSEASON.
Good Luck
DOTUSD.P trade ideas

DOT price rebound and new directionDOT is under strong influence of BTC and it will depend on BTC for further direction, we will see how BTC behaves in the coming days

DOT-USD - Bull Case Polkadot tries to hit $61 based on the FIBInterval: 4hrs
Description: Polkadot recovers from the sale, and tries to hit $61 milestone by Nov 22.

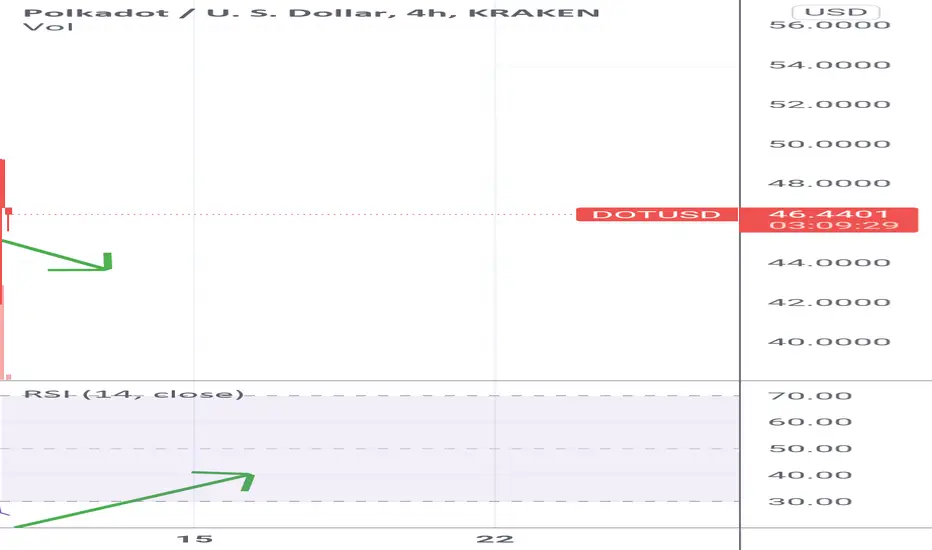
$DOT upcoming 4hr divergenceDot is oversold, looks like it might print some 4 hr bullish divergence if we're lucky enough to get another price drop. Not involved in this one yet, just waiting on the divergence to play out.
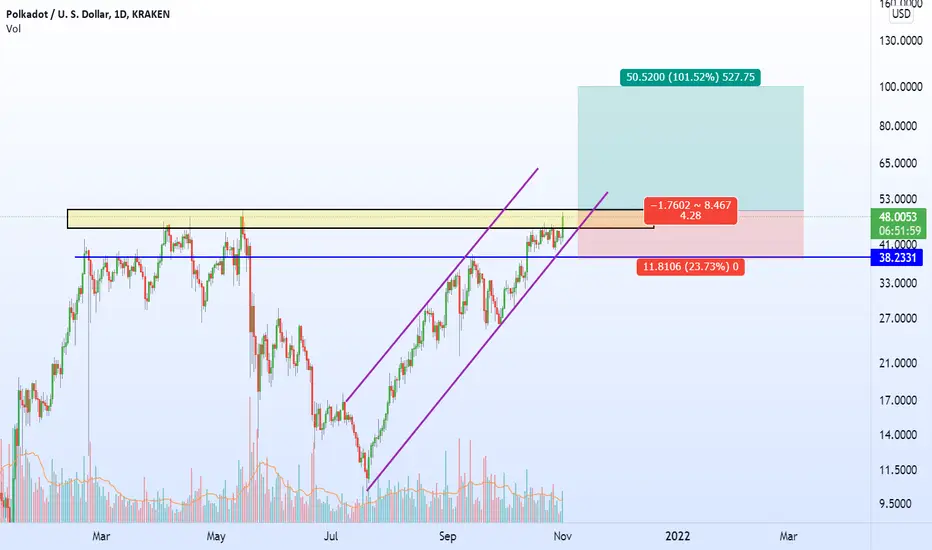
DOT moon soonI think there is a nice chance for a long trade.
As you can see, as soon as we pass this level we are in no man's land and the roof is the stars.
Auctions will start soon. The conditions are there. The price must break the structure with strength. I don't want a low price crawling on the support. In fact, it is also possible to witness fakeouts.
Stay awesome!
DOT within triangle I see DOT trading within this triangle until Friday, November 12th. That is when the parachain actions begin. I expect a breakout at that time (pending successful implementation).
Good Luck


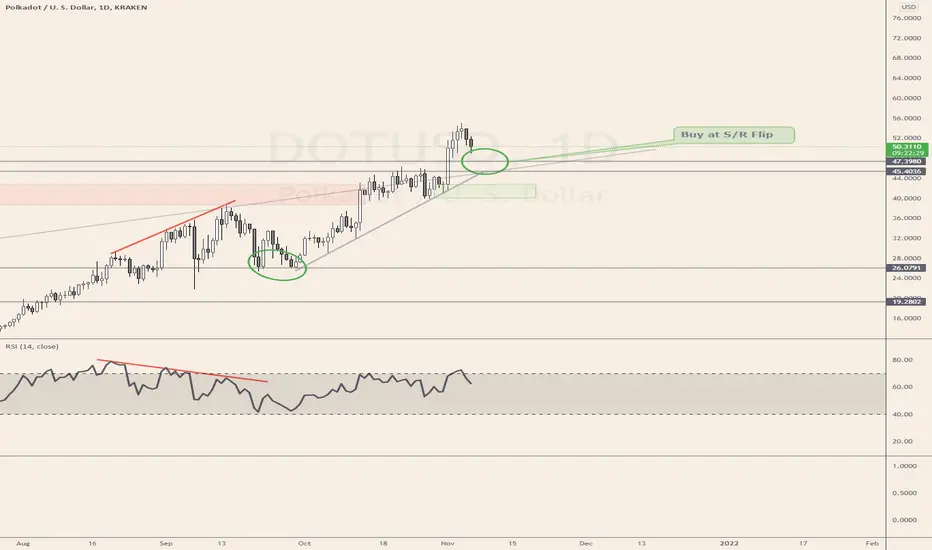
Wait for Reversal on DOT - Big Move Coming!Using SpaceManBTC's Asteroid Belts + traditional indicators like Stochastic/RSI. I see a perfect buy opportunity at previous resistance, now acting as support. Wait for the pullback on DOT and HODL!

POLKADOT
🟢 DOT LONG
DCA BUY: 33,55 - 32,91 - 30
SELL: 35,5 - 38 - 41,45 - 46,24 - 53,85
Lev: 75x
Max: 3%

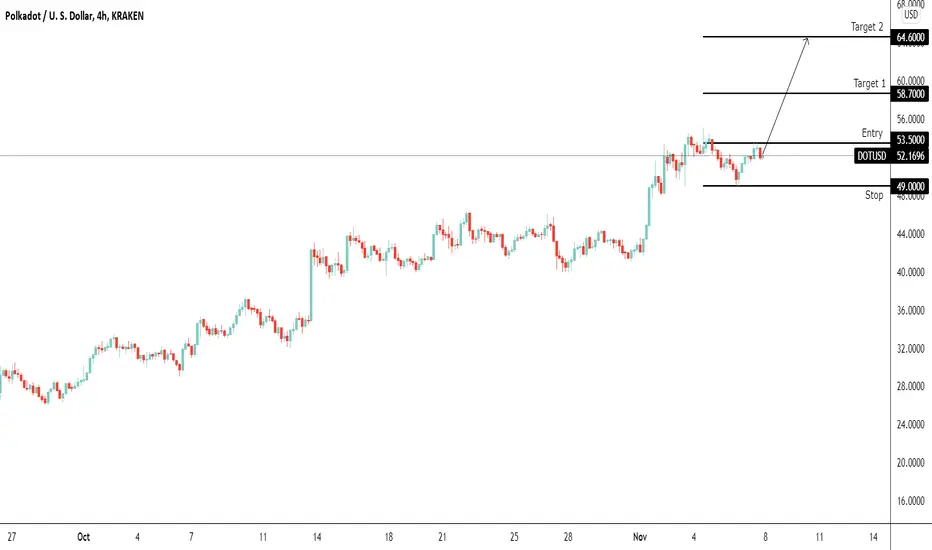
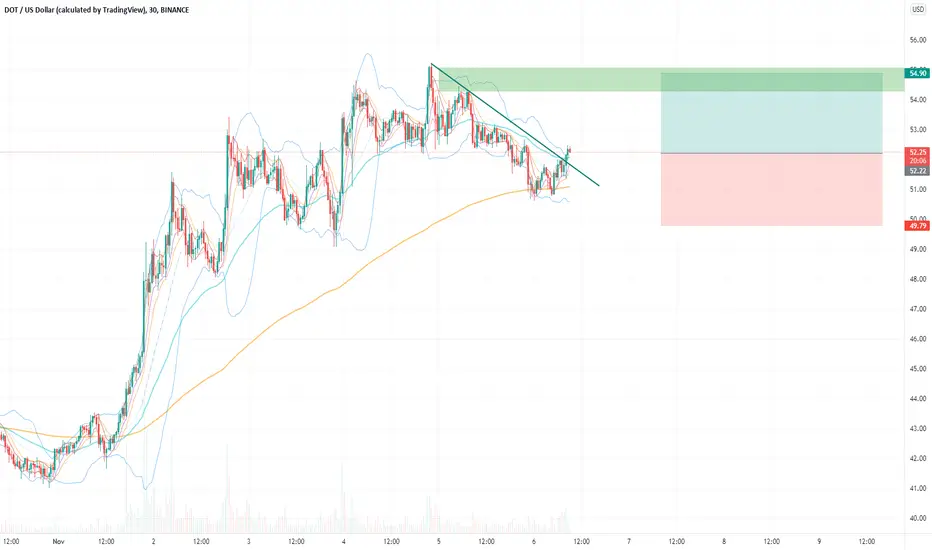
DOTUSD (4H) Bullish Wave We2Hi Traders
DOTUSD (4H Timeframe)
A Med-High probability, entry signal to go LONG will be given with the upward break of 53.5 after the market found support at 49.0. Only the downward break of 49.0 would cancel the bullish scenario and take us SHORT.
Trade details
Entry: 53..5
Stop loss: 49.0
Take profit 1: 58.7
Take profit 2: 64.6
Score: 7
Strategy: Bullish Wave We2
DOT Rising WedgeHere is how I see DOT trading in Q4 2021 - around $70 (near Christmas) local top before profits are taken to bottom of wedge.
Assuming the pitchfork and wedge boundaries stay intact and are not broken.
Let's see where this goes.

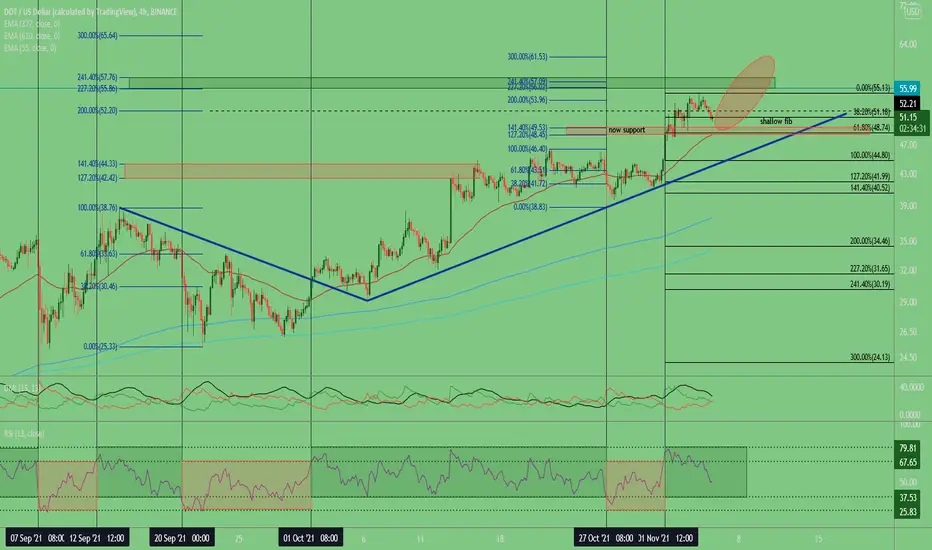
DOT aims for ATH thru resistanceDOT in the next few 4H candles should impulse upward.
$56 is the upper level of the pitchfork and the next fib level. That will provide heavy resistance. IF that can break, we should expect a retest on the pitchfork before further advancing. However, DOT is trading in a larger RISING WEDGE.
Good Luck

Dot by @cryptomatatanAfter a zone of accumulation of orders the price of Dot took off making its new high of all time and we will probably see it descend looking for liquidity and the activation of a new block of buy orders in the price range of $ 45- $ 40 and that it can converge with upcoming events within the blockchain.

DOTUSDPrice made lower lows
+
MACD making higher lows
=
Bullish Divergence
RSI is currently around 45 which is right in the middle of the overbought/sold zone.
200 ema acting as support lined up with the.618 Fibonacci ratio.
For those who are cautiously optimistic, there is a decent chance of a wick down to .5 - .382
First target if you break out is ath.

is going down at least for few daysis going down at least for few days, is going down at least for few days

DOT S/R FlipLooks like a possible resistance flipped to support to me. However, if it breaks, $40 would be my next look. Thoughts?
Also, I don't think I have enough lines on my chart. : ]
DOT confirming ATH breakoutWatch for a daily close and even tomorrow's weekly candle close above the previous ATH for further growth and advancement.
Obviously the opposite would indicate bearish potential.

Polkadot #DOT 1D - Bearish DivergencePolkadot (DOT) has had an amazing run up to an ATH recently. Now it seems there is retracement going on and a Bearish Divergence in sight on the 1D Chart. I set up a few trend lines to watch out for mixed in with Fib levels. DOT is following a nice channel in an upward direction since launching but it is also touching the top of the channel so keep that in mind. Lastly, RSI needs a cool down in order for another leg up.
What are your thoughts? Comment below, hit the like and follow me. Thank you!
Disclosure: This is just my opinion and not any type of financial advice. I enjoy charting and discussing technical analysis . Don't trade based on my advice. Do your own research! #cryptopickk #bitcoin #altcoins

DOT continues to retrace at $51 as trading volume dipped by 33%The Polkadot price analysis reveals that the coin is in a bearish grip today again after going through loss yesterday, following an all-time high. The DOT’s ATH journey was quite interesting as the coin kept covering upwards range continuously for four days, as the bullish momentum was healthy enough and the DOT started retracing when declined at $54 on 4th November. Polkadot is still maintaining above the $50 psychological mark, the coin is on a downtrend for the second day now, but many veterans are speculating for more upside in the coming days.


More price discovery for DOTHad a bunch of asks for DOT.. thought I would share my view.
Support zone being tested, so maybe a pop to new highs
Fibo
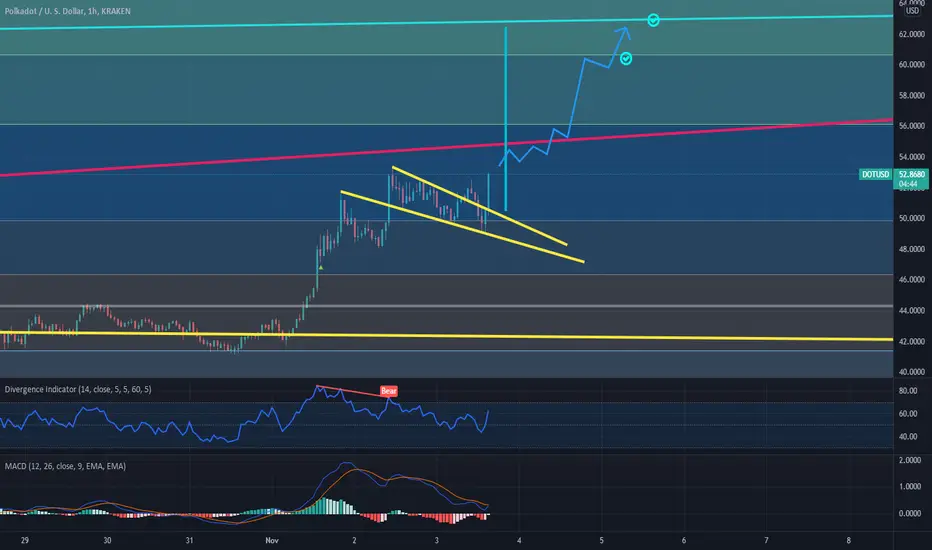
DOT Where to Next?This is where I see DOT next few days.
PT $56, $60, $62
Watch DOT.D for guidance on areas to peak, cash out and jump back in.
Good Luck