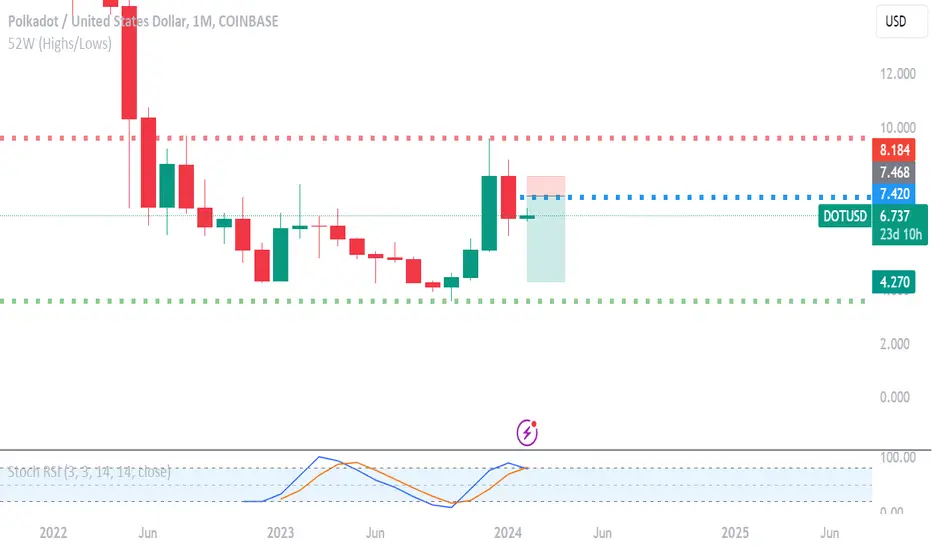
PolkaDot #DOTUSD: Long-Term AnalysisCryptocurrencies are experiencing challenges post the Bitcoin ETF release, a predicted event that didn't act as a Buy-like catalyst for the market. It serves as a reminder that not all assets surge after such an occurrence. Despite this, the current phase presents an intriguing opportunity, particularly for PolkaDot.
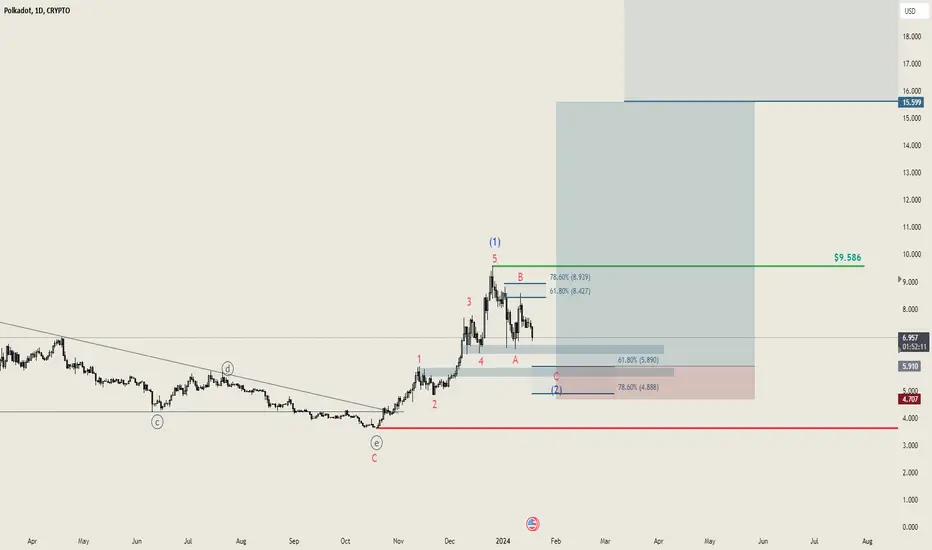
PolkaDot has shown a somewhat delayed response since the low at the end of last year compared to its counterparts. An overarching Wave (1) has formed, and we are currently entering Wave (2). This correction is anticipated to range between 61.8% and 78.6%. A dip below this range would strongly suggest that it might not be Wave (2), and the correction could extend further below the $3.64 mark.
However, if a turnaround occurs within this range, we foresee a minimum upward movement reaching $15.5 🔥
DOTUSD.P trade ideas
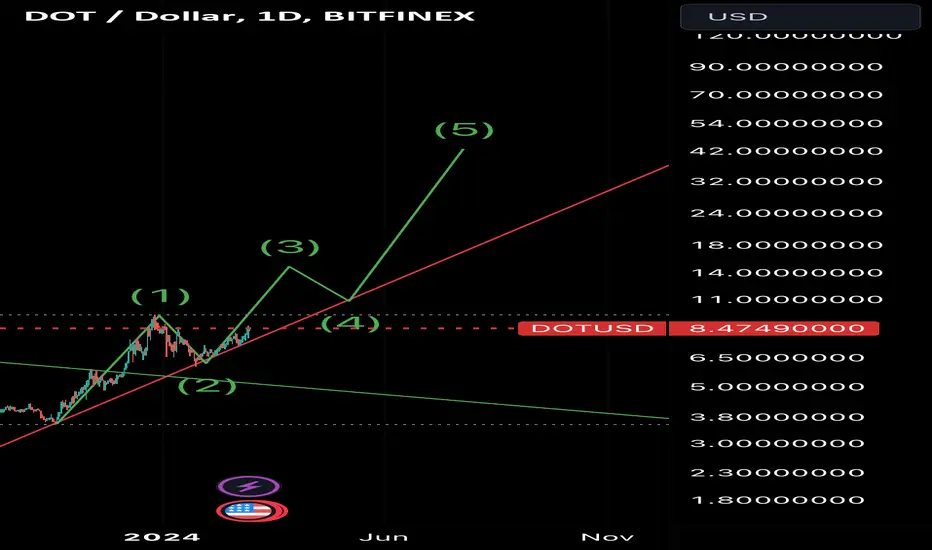
✴️ Polkadot Headed Toward $22, Followed by $36 (ATH $144)Polkadot (DOTUSDT) has entered the bullish zone; says who?
➖ On the left side of the chart we have a market correction or bear-market.
➖ On the middle portion of the chart we have an ending diagonal or consolidation phase.
➖ On the right side of the chart we have a new bullish impulse, a 5-up wave or bullish phase.
A major bullish development is the break as resistance and close above EMA100 on the weekly timeframe.
On the daily timeframe we would say that a close above EMA100 signals medium-term growth potential being confirmed. Weekly this signal is 7X stronger, so we can say that long-term growth potential has been confirmed.
👉 The next target is $22 followed by $36.
There will be much more in 2025 and late 2024. The next All-Time High can reach $144.
(A rough estimate of course. We will go deeper into the numbers as the bull-market develops.)
Remember to boost!
Thanks a lot for your continued support.
Namaste.

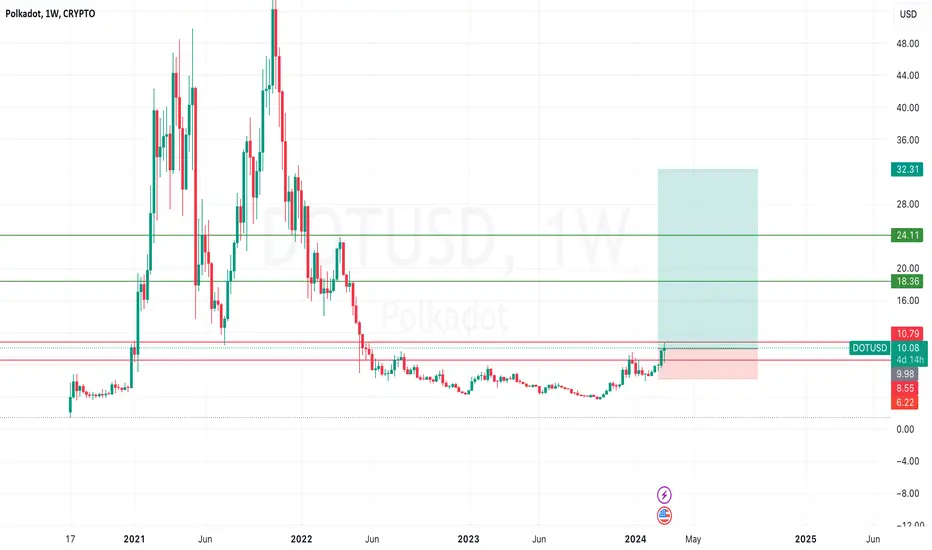
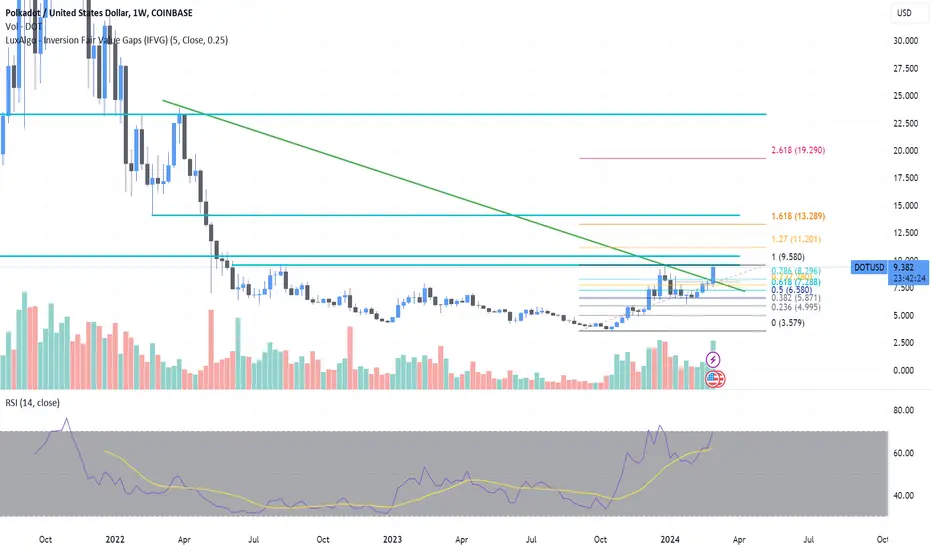
$DOT This one has been sleeping for awhile now but bullish sentiments are high right now. Polkadot breaks out on the weekly in a strong way. Trendline is broken and first target $11.20 followed by $13.3. NFI/DYOR
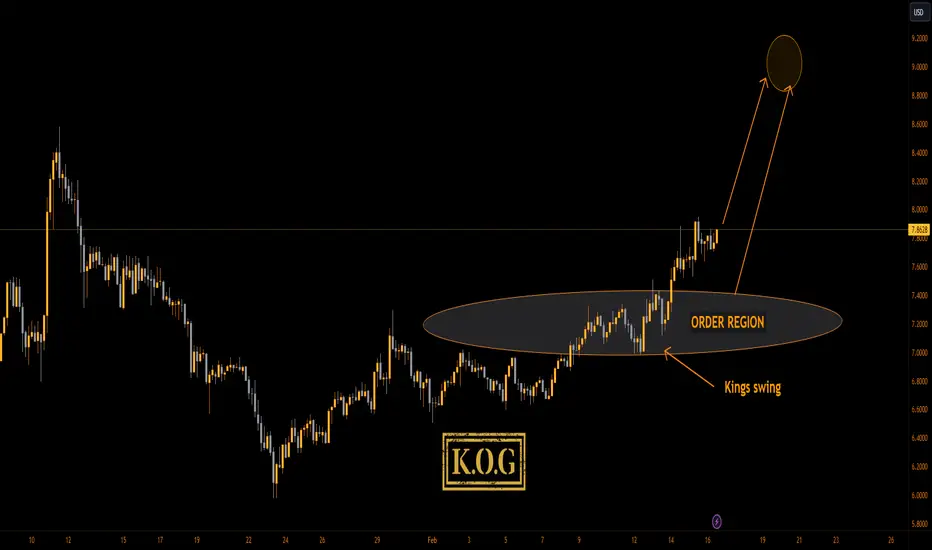
KOG CRYPTO - DOTUSDWelcome all,
We're testing out some Crypto using our unique strategy and applying the algo. We're already running the test on this since last month so far running at 10% gain locked in.
It's a test at the moment, let's see how they perform.
As always, trade safe.
KOG
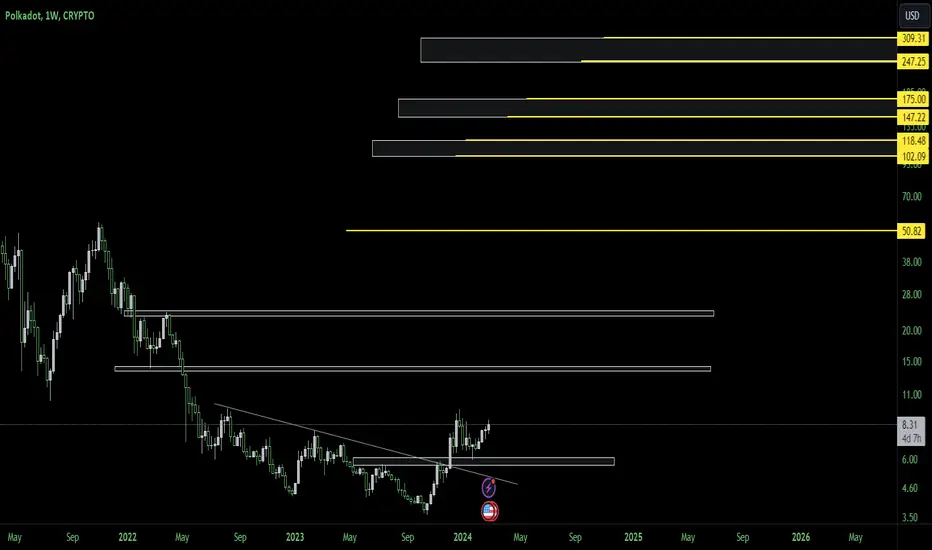
DOT long term potential targets#DOT #DOT_LTA
potential future target based on previous rise and fall cycle
50$
102$ - 118$ area
147$ - 175$ area
247$ - 309$ area
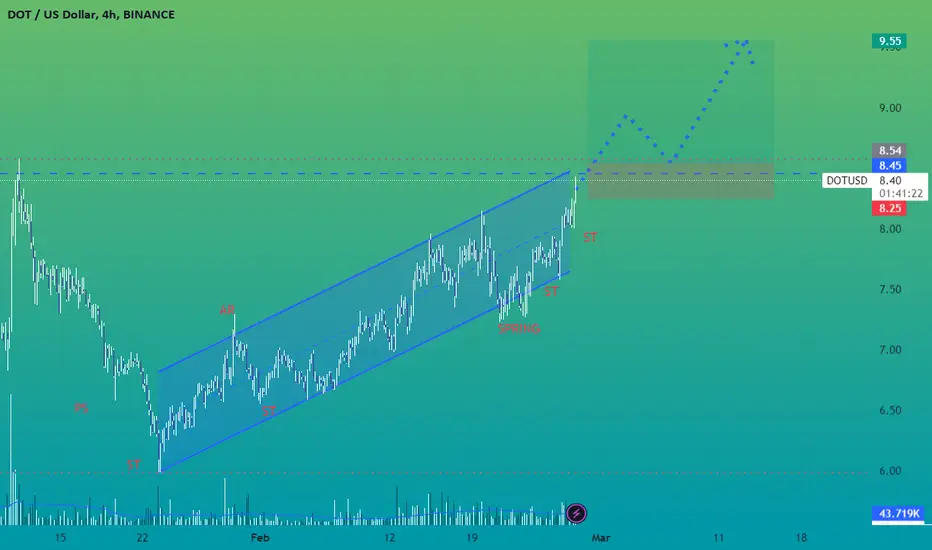
DOTUSD BINANCE:DOTUSD
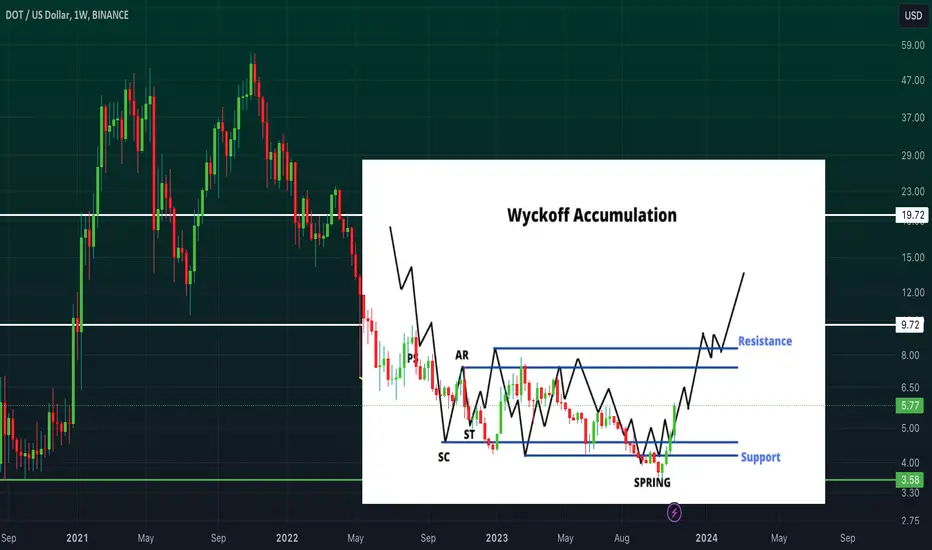
DOT formed an upward sloping accumulation structure and entered an uptrend in the price channel after large investors performed the final shakeout (Spring) to shake off small investors at the bottom of the price channel.
This accumulation structure shows that the strength of the Buyers is overwhelming the Sellers.
That gives investors the right to hope for a scenario of a strong Break out of the price channel and into an Uptrend.
When a breakout event occurs, buying is a reasonable choice. However, to be more certain, investors should wait for the confirmation event (BUEC - Back Up To The Edge of Creek) at the upper edge of the price channel.
DOT - Ready for a big runDot gives a live example of the Wyckoff Accumulation Schematics
Rebound target zone: $18 - $21
polkadot bullish setuppolkadot is forming a inverse h/s, as polkadot has been a bit lagging behind i do expect this to break out these next few weeks and retest, i drew a line to what i kind of expect. technical target lines up with the .38 fib level as well, with any pattern we see declining volume as we near the end up the pattern. want to see higher volume then normal when we break the neckline to help confirm break out.

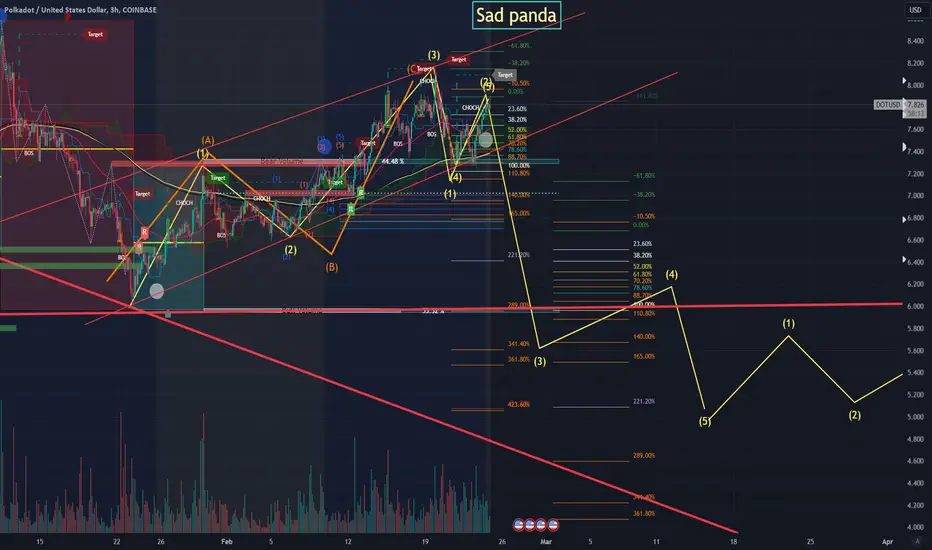
PolkaDot is about to make some sad pandasIf this rolls over you might be lucky to get out at $6.90.
I am looking to buy back in near $4.30
Bull run in a bear market...
NOT FINANCIAL ADVICE!!!!!
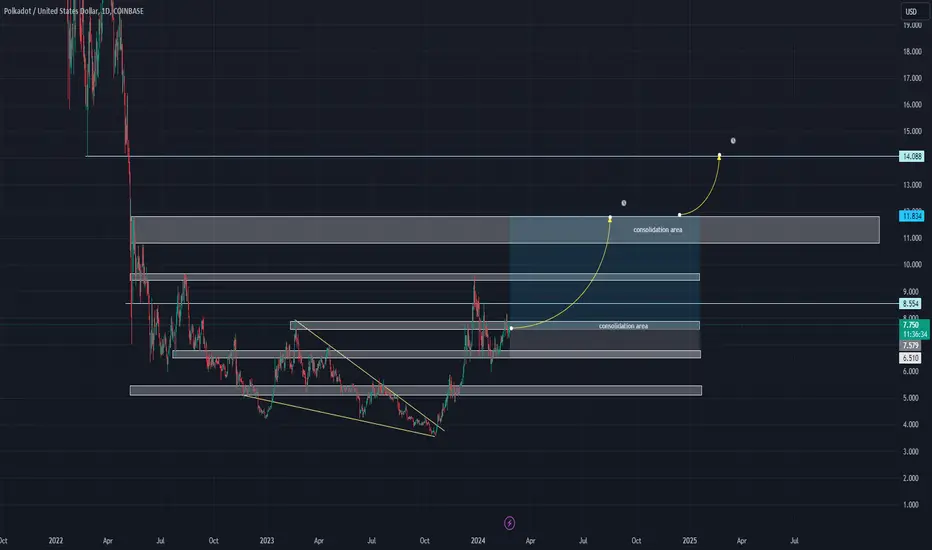
DOTUSD BULLISH LONG TO 11.814DOTUSD BULLISH LONG
LONG FROM (NOW): 7.749
consolidation area 1: 7.557 - 7.906
consolidation area 2: 10.843 - 11.838
TAKE PROFIT: 11.814
i will be waiting for this to continue to: 14.088
but for now, SL: 6.512
entry:7.749
take profit: 11.814
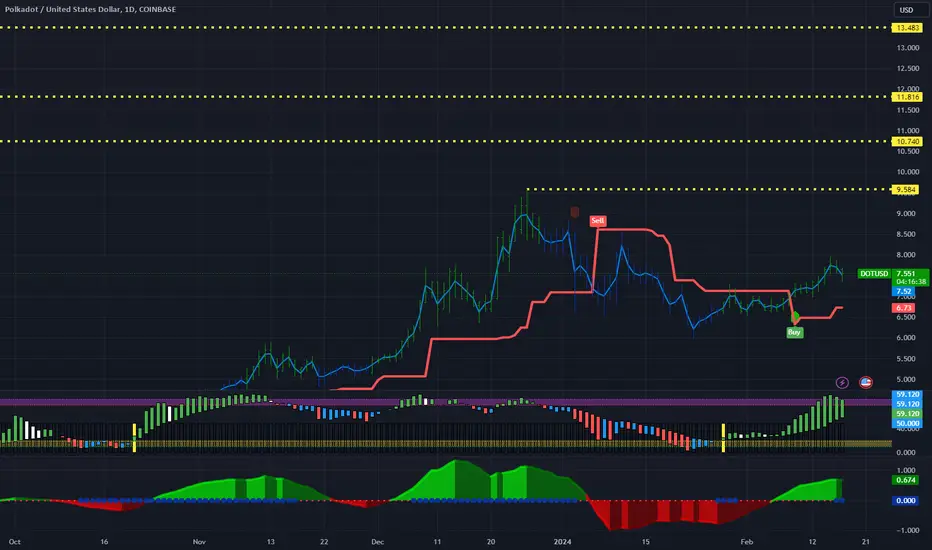
Long DOT to 9.60 - 23%+ Profit PotentialAnother trade I've taken today is here on DOT. Once again, my proprietary blend of custom indicators are all flashing green. Reinforcing the bullish signal is, of course, good volume support on the underside of price along with all SMAs (50,100,200). RSI is hot but not in overbought territory as, it would seem, everything else is. I can see us double-topping before any sort of pull-back. I'm in at 7.77 and targeting 9.60. My SL is at 6.86 with a RRR of 2-to-1. Potential gains here top 23% to our final target.

Breatout - Target:13.5$1. Supertrend positiv
2. positiv accumulation
3. positiv squeeze
Targets marked with dotted lines in chart

Polkadot Bullish SignRecent bullish crypto movement gives DOT token opportunity to run side by side. Breaking upper trendline gives DOT strength to retest 50% of move down.

POLKADOT TIME TO BUY????Hello traders as you can see Polkadot is displaying a but signal on the CE, the stochastic RSI is also starting to come up as well as BB% indicating increasing volatility. Waiting for a fractal conformation I believe the bottom is in for DOT. We can also see some volume on the weekly. Polkadot could see $26 as a starting point

DOTUSDThis Month FORECAST
Opportunity for DOTUSD. This setup trading idea is for SWING. >> TAYOR
Risk Factors:
1. Market conditions, unexpected news, or external events could impact the trade.
2. Always use risk management strategies to protect your capital.
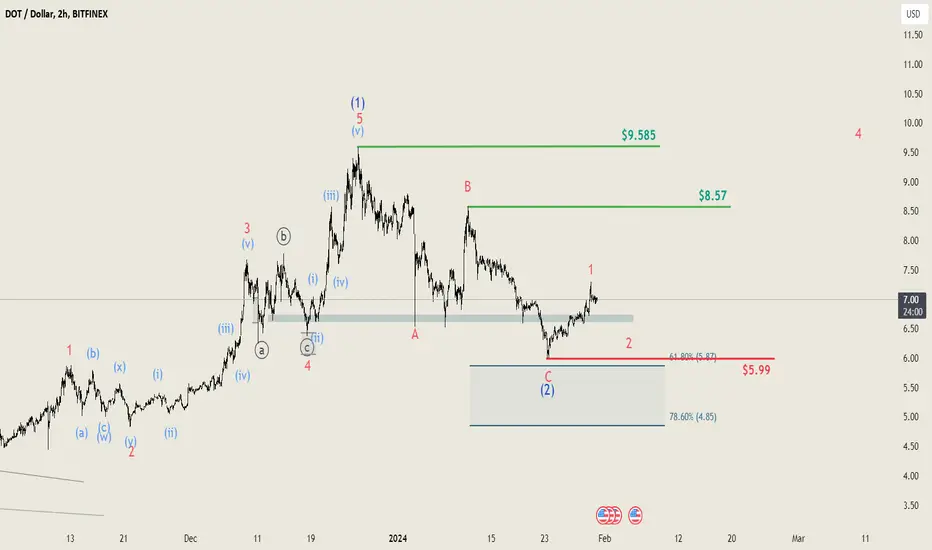
Polkadot: 2-Hour Chart AnalysisLet's take a deep dive into the Polkadot BINANCE:DOTUSD 2-hour chart. We may have already completed Wave (2). However, there's a possibility of a further descent to the 61.8 or 78.6% retracement levels. This wouldn't be surprising, given that it's quite brief for a Wave (2) in the time-based Fibonacci zone. Despite this, the overall chart still appears predominantly bullish and suggests we might have initiated a trend reversal.
🌊 Potentially, we should watch for a subordinate Wave 2 soon, which would lay the groundwork for an overarching Wave (3). Nevertheless, this Wave (3) seems to be in the distant future, with a target of at least near $16, which is considerably far off. It's entirely feasible that we'll see this in the future.
The key question is...when? Will we see it immediately, or will there first be a pullback that goes deeper, possibly filling our overarching chart limit order at $5.87? Only time can tell, be patient, we will keep you updated
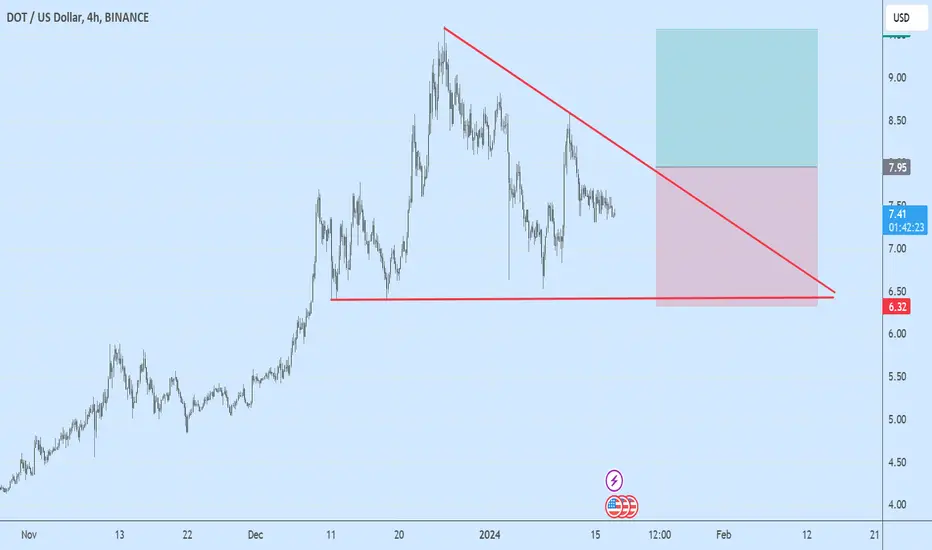
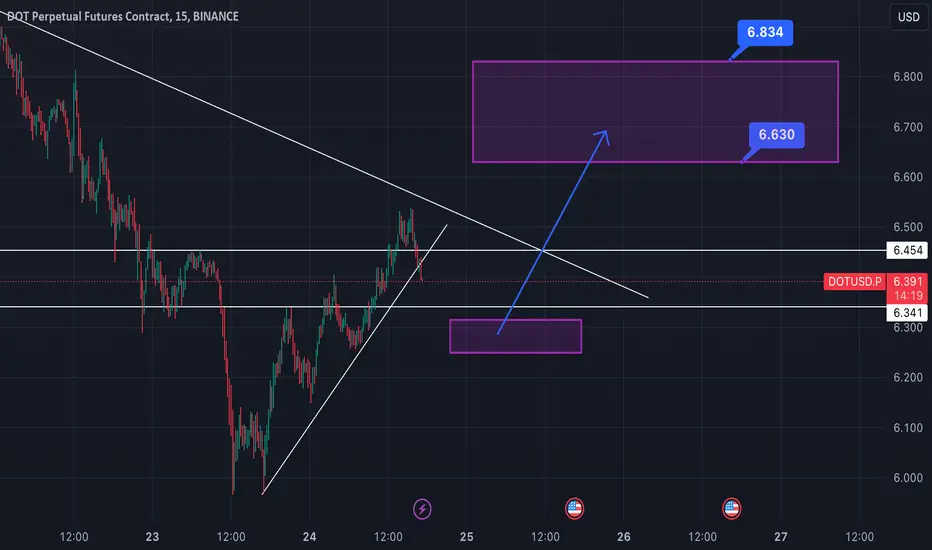
DOTUSD It looks long with a correction to the nearest level up to 6.34, perhaps even lower from the zone of 6.25-6.31, from there you can look for buy points up to the level of 6.63 - 6.83
Polkadot buy at USD5.85-65.85 is the .618 retracement on DOT, which lands perfectly on the support band.
If you would like to make more DOT, you could stake it as well for 1 year.

DOT Price Breakdown Warns 20% SlideHead and Shoulder Breakdown: DOT's daily chart shows a bearish reversal with a head and shoulder pattern breakdown.
Crucial $6.50 Support Breached: The bearish momentum intensifies as Polkadot's price falls below the key $6.50 level, aligning with the 50% Fibonacci level.
Risk of Dropping Below 200-Day EMA: If the current sell-off pushes DOT below the 200-day EMA, a further decline to around $4.80 is possible.
Increasing Selling Pressure: A noticeable increase in trading volume during the downtrend suggests a potential continuation of the bearish trend.
Technical Indicators Suggest Downfall: The MACD crossing below zero and growing bearish histograms point to a likely extended downturn.
Market Sentiment Turning Negative: Growing fears and uncertainty among investors could exacerbate the sell-off.
Potential Downside Targets: The current bearish dynamics could see DOT's price dropping below $5, possibly testing the $4.80 level.
Rebound Potential from 200-Day EMA: A recovery from the 200-day EMA could push DOT's price back towards $7.
Bearish 2024 Start for Altcoins: The year begins with a strong bearish trend for altcoins, including Polkadot.
Impact of Broader Market Trends: The broader market downturn is influencing DOT's price action.
Critical Level to Watch: The 200-day EMA stands as a decisive level for future DOT price movements.
Investor Sentiment Key: Investor reaction to ongoing market conditions will be crucial in determining DOT's short-term trajectory.