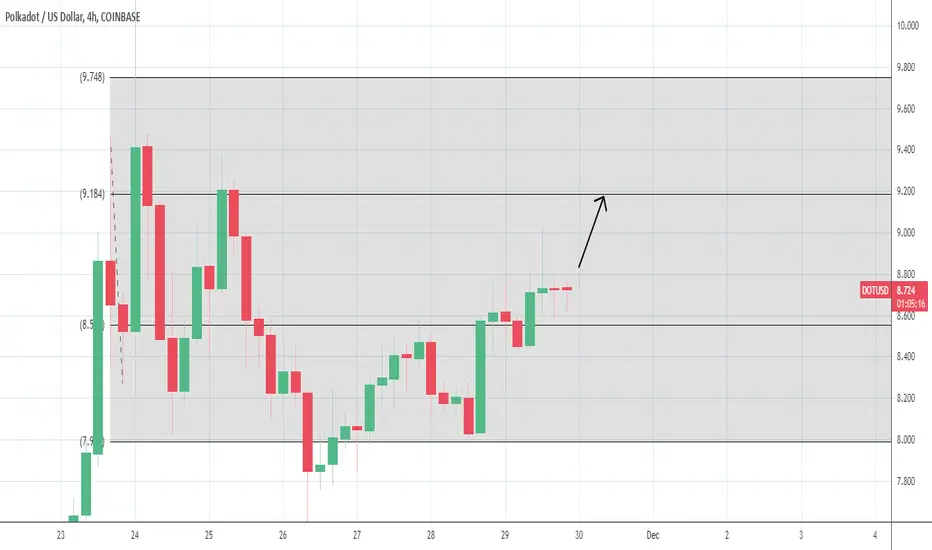
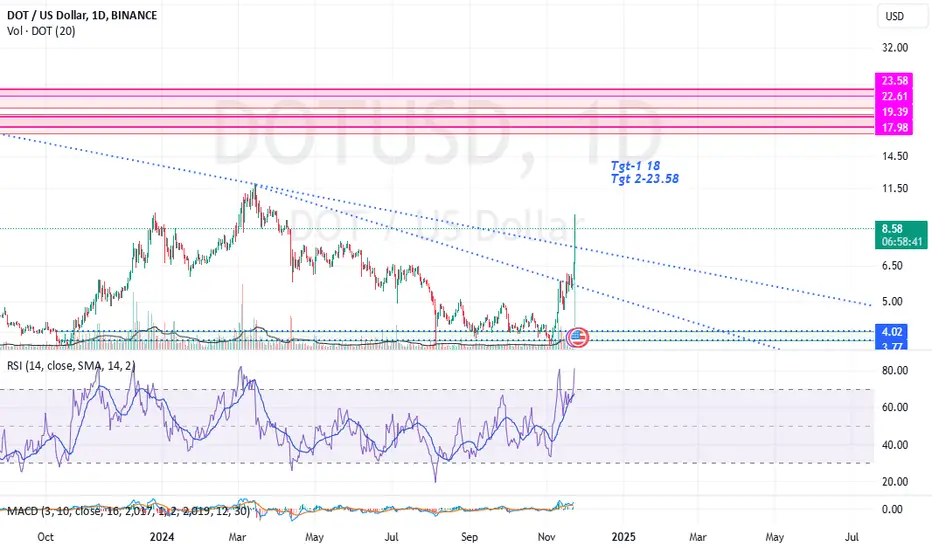
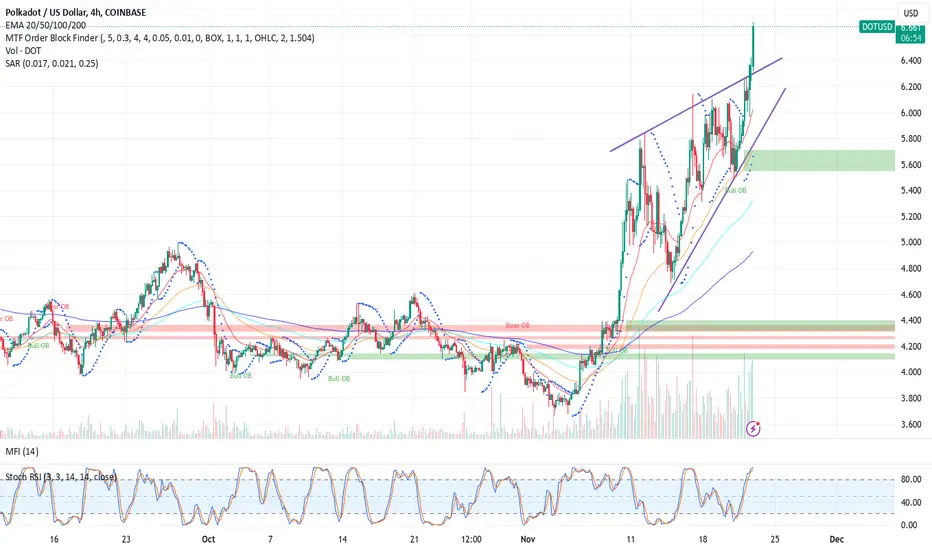
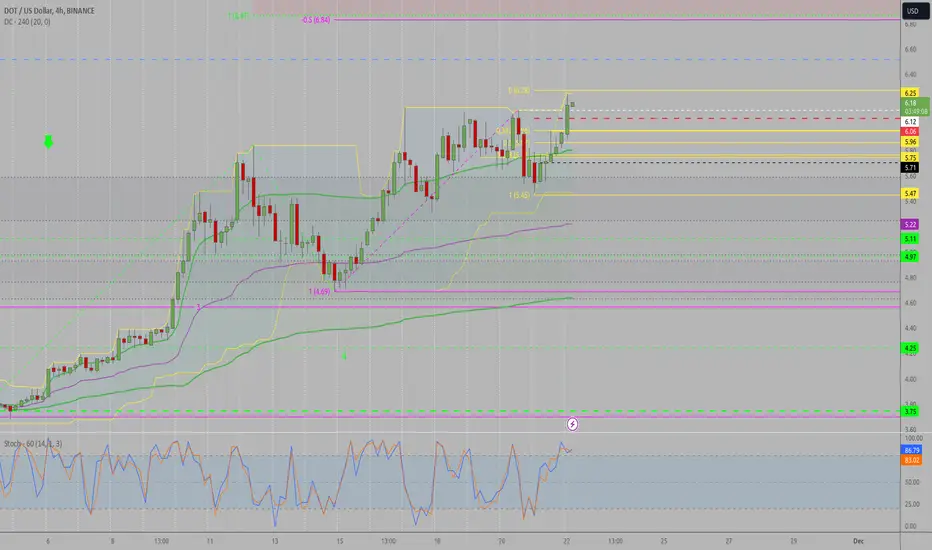
$DOT Will it continue the uptrend?Volumes seem promising for CRYPTOCAP:DOT to continue it's uptrend. Price action yet to support the idea. Another 15-20% rally could be seen very soon
DOTUSD trade ideas
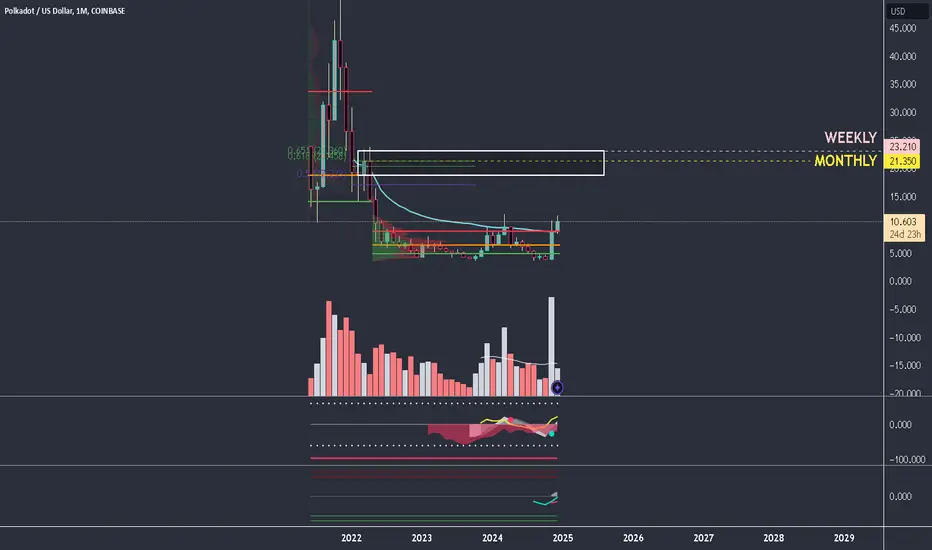
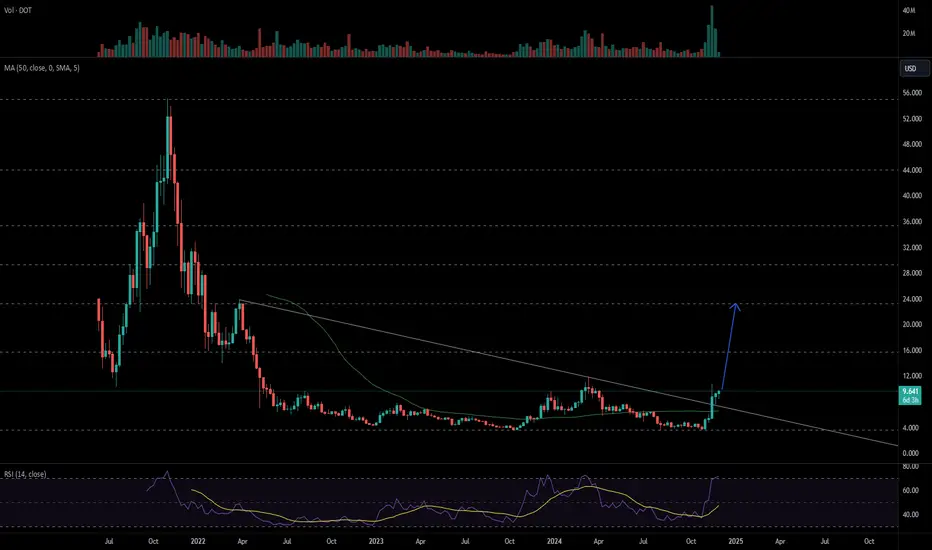
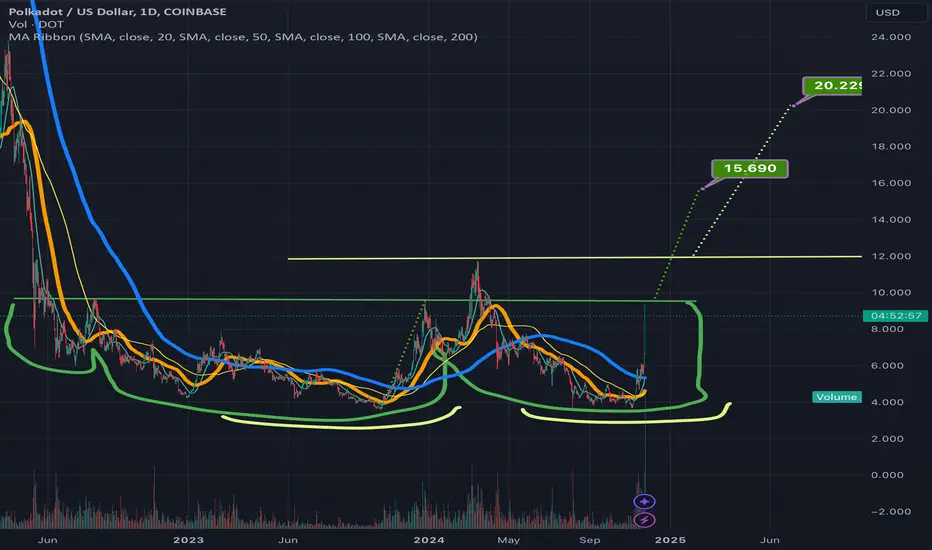
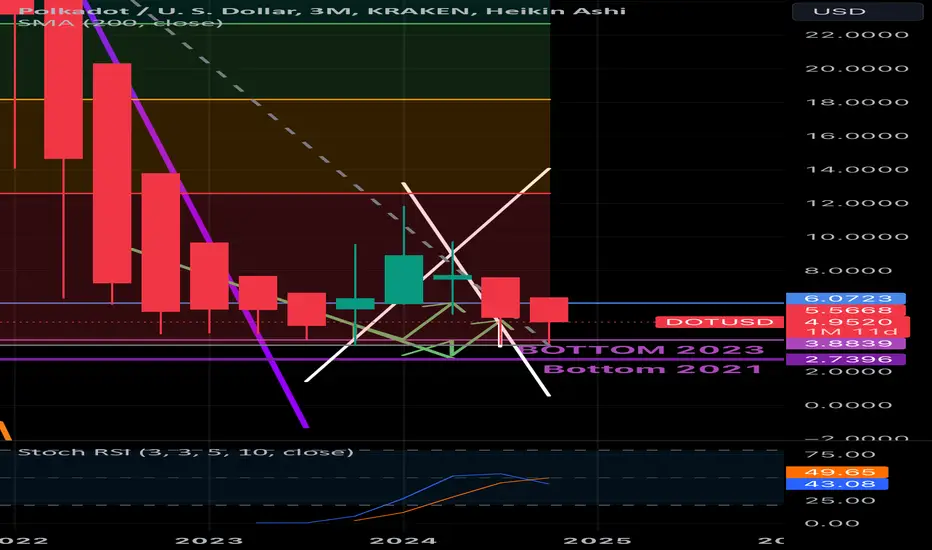
POLKADOT with an increase possibility of (+120%)Polkadot is shifting in the monthly timeframe to bullish, is getting supported by the value area high from may22 to now and above the anchored vwap from jan22 highs, if price stays above $9 till the end of this week will be good for that happen. Is showing great momentum to continue reaching higher prices. The target is situated between monthly/weekly level with fibonacci levels from dec21 highs, big resistance zone and point of control from last bull run.
TARGET: $18,70 to $23,20 up to (+120%)
Potential HVF on DOTCons, low slung. Biased to down side, if we were in a moderate market.
Pros, we are not in a moderate market. We're in an alt season. Other low slung hvfs have performed to upside repeatedly.
Other pro is W bottom on higher time frame gives bullish target that is much higher than hvf target.
Ambiguity, is that the hvf could break and perform but still sell off and not trigger the W bottom movement. It may come up to several weeks later.
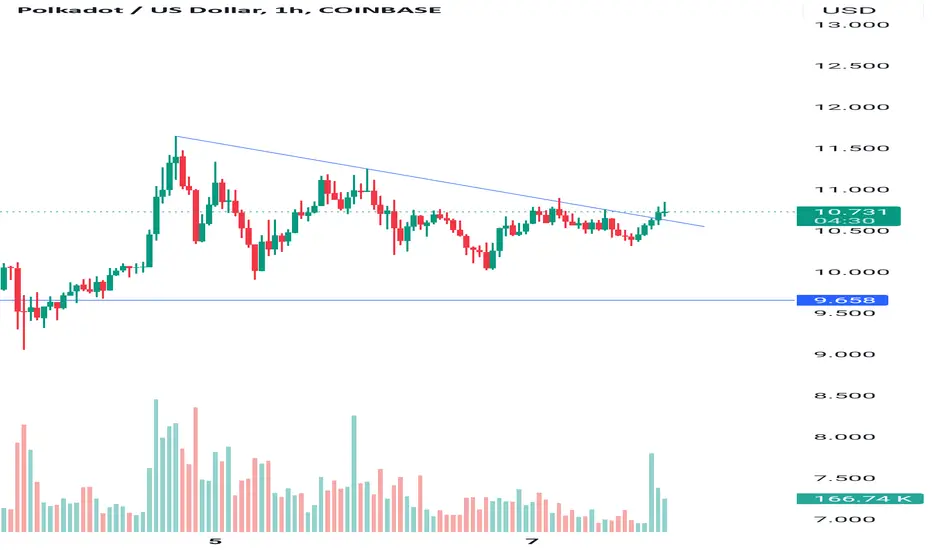
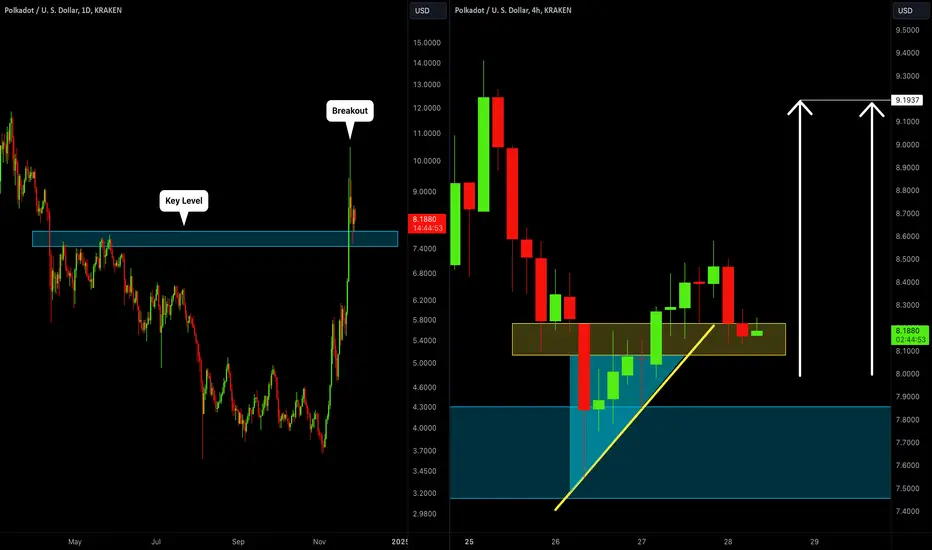
POLKADOT - Buy Idea (Short-term)The breakout above the key-level resistance at 8.54 is evident. Further move upwards is highly likely at this point. The defined range the Dot is trading in lately suggests that the next key-level is at 9.1480. Firing off a new Buy trade.
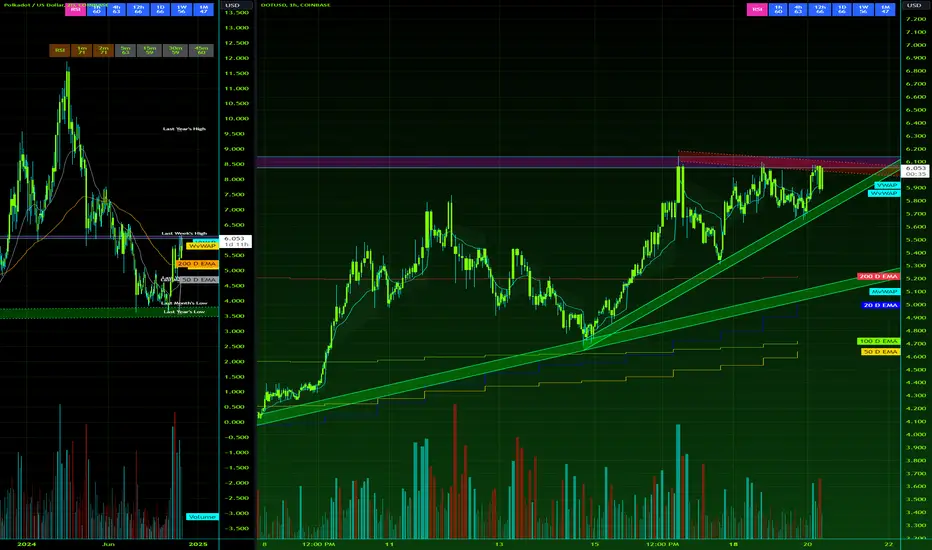
Polkadot / U.S. Dollar | Chart & Forecast SummaryKey Indicators On Trade Set Up In General
1. Push Set Up
2. Range Set up
3. Break & Retest Set Up
Notes On Session
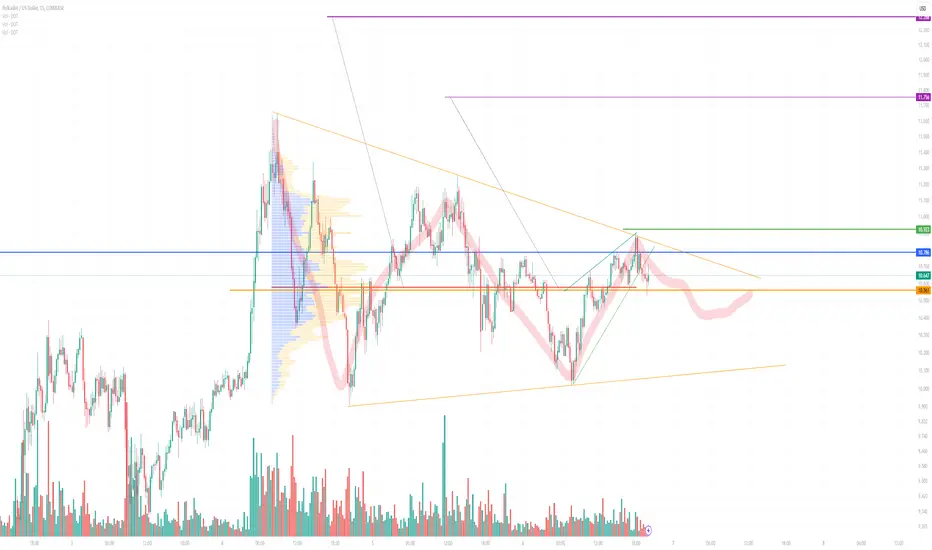
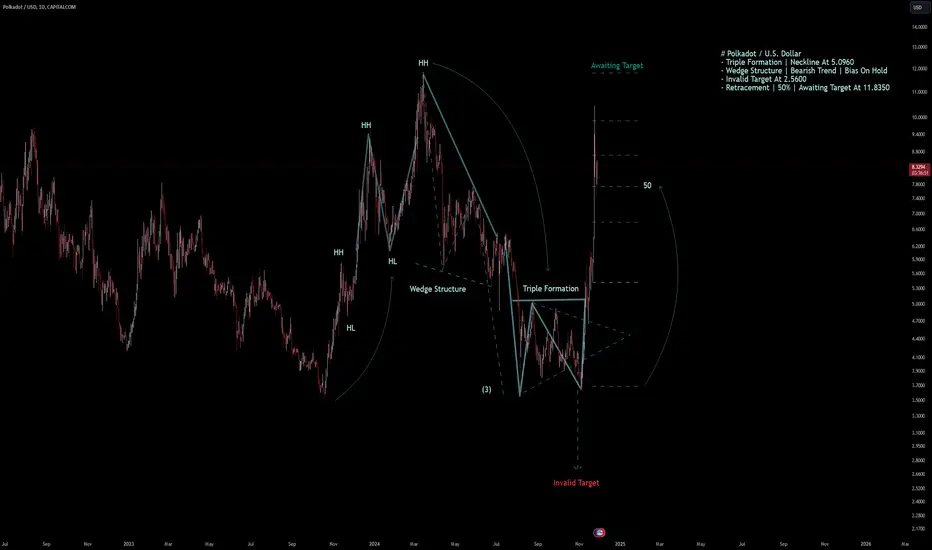
# Polkadot / U.S. Dollar
- Triple Formation | Neckline At 5.0960
- Wedge Structure | Bearish Trend | Bias On Hold
- Invalid Target At 2.5600
- Retracement | 50% | Awaiting Target At 11.8350
Active Sessions On Relevant Range & Elemented Probabilities;
London(Upwards) - NYC(Downwards)
Conclusion | Trade Plan Execution & Risk Management On Demand;
Overall Consensus | Buy
POLKADOT (DOTUSD): Great Buying Opportunity
I see a nice bullish signal on DOT after a retest of a recently broken
key daily horizontal resistance.
The price formed a tiny ascending triangle pattern on that
and violated its neckline.
I expect a growth at least to 9.19.
❤️Please, support my work with like, thank you!❤️
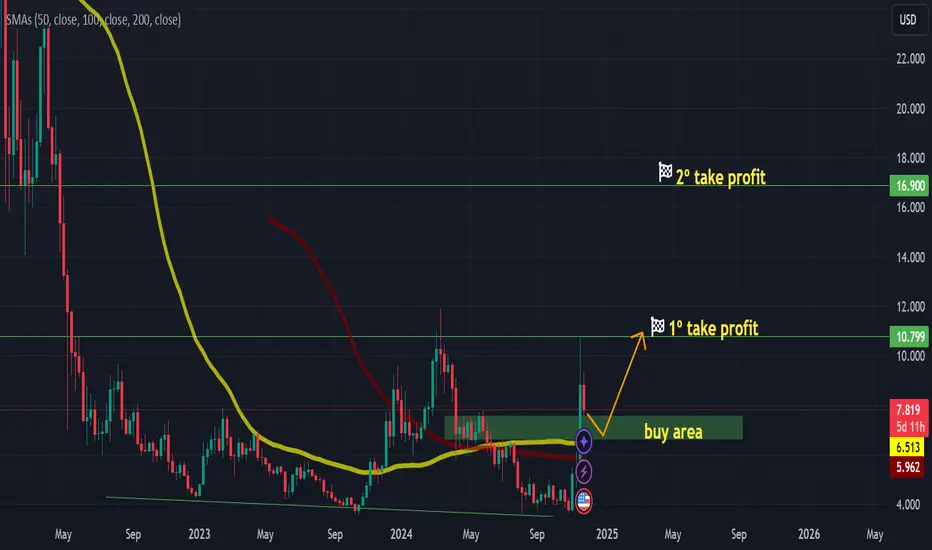
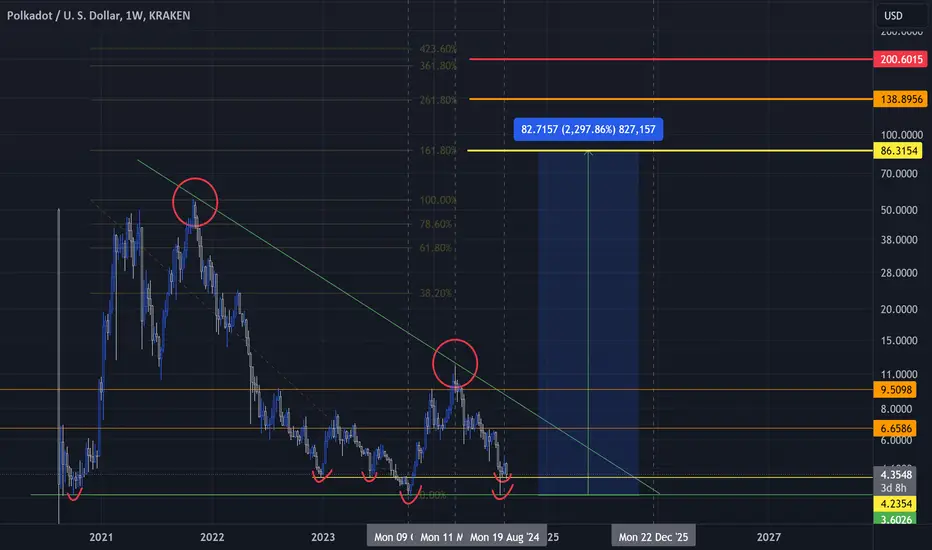
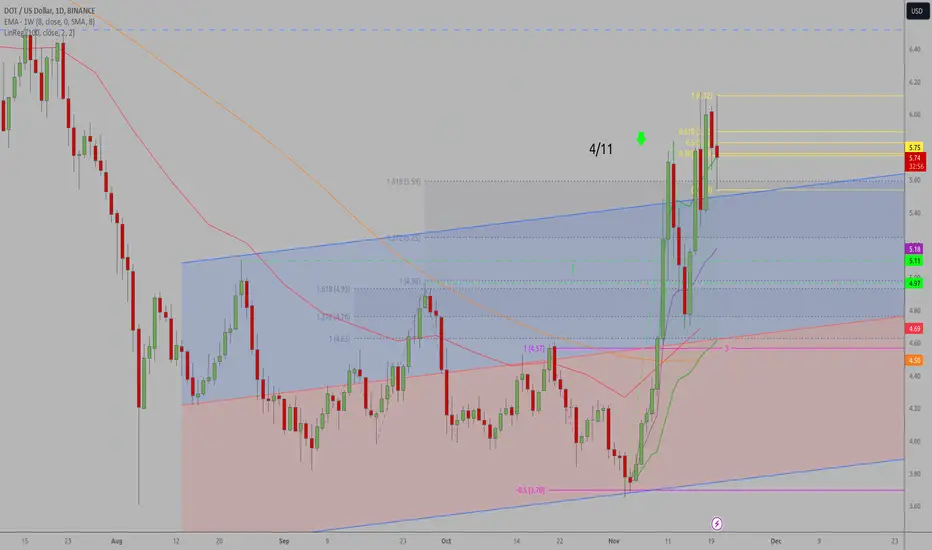
DOTUSD (1W) - buy the dip Hi traders,
Here it is my idea for a long position on DOTUSD (1 week time frame).
the price hit a local high in March 2024 and hit another high in November 2024, after that the price bounce back and is currently experiencing the pullback. The idea is to enter in the buy area, which is determined by a previous resistance zone that can be a support for a bounce up now. The best would be if the price will hit the SMA in the buy area and use it as a support too. The buy area is between 7.585 and 6.625.
We will put our first take profit at the level of the last high and the second take profit at 16.900 where there was a support in February 2022.
good luck
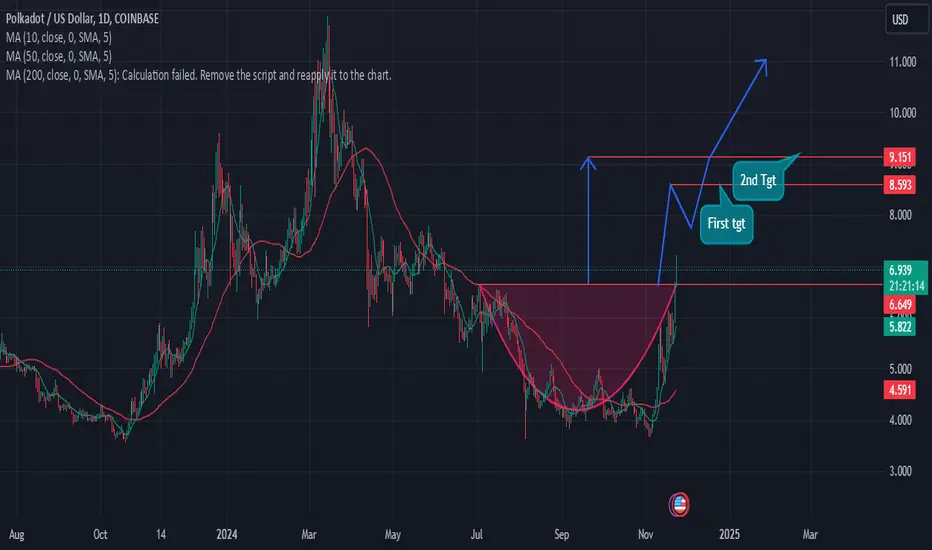
Triple Top - Ready to popLooking on the left 2 day chart, you can see this is the main support/resistance level from prior run ups. Ideally we get a breakout through this resistance and a retest of this level, confirming support, and buying pressure above.
This will send it over 7 easily, and to stay conservative, my first target is 7.5. Beyond that will be runners and dip buying.
Looking for Bitcoin to consolidate after its recent ATH break through 94k today. Consolidation will allow money to flow around through alts. With this one being so tight, we only need a little bit of that volume to breakout.
Polkadot working on an invh&s and a double bottomThis inverse head and shoulders pattern almost got nullified when price starting heading back towards the head but since price never went below the head it’s surprisingly still in play. It also got low enough to the head to create a double bottom pattern n the process. The double botto pattern has an even higher neckline than the inverse head and shoulders and thus a higher breakout target. *not financial advice*
Polkadot- I understand it may feel like a challenging time, but remember, fortune favors the bold.
- Using extreme leverage, whether 30X or 100X, won't lead to wealth.
- it often leads to losses.
- Instead, consider buying on the spot market; it's a more stable strategy. When the market dips, that's the perfect time to dollar-cost average (DCA) more.
- Hold your positions, stake wisely, and most importantly :
- exercise patience.
- it's the ultimate key to success.
- Keep an eye on the charts, watch for triple bottoms, track trends, and be mindful of bubbles and Fibonacci levels.
Happy Tr4Ding!
DEEKEY IDEA - POLKADOT SHORT TERM TARGETPOLKADOT is now in upward direction, and made Round Bottom formation Broken strong resistance at $6.55 USD and Short term target is $8.86 USD.
Disclaimer: - Please do research or consult your broker before investing.
DOT & Link and change of daily candlesBoth appear to be breaking out, trying to early warn. Transitioning from ada/xlm once they break down. Dont have time for more, look at the charts, see the break, dyor, be vigilant.
Oh one more thing another tool for your toolbelt. Watch the daily candle, it ends at 0000UTC which is in about 5 minutes from this post. Often it can shift directions, fuel fires, always look for changes in sentiment at the turn of the daily candle, lots of algorithms are making decisions based on how that last 24 hours printed.
DOT/USDT (Very Important) The MATIC chart I shared is almost identical to the DOT chart, with only minor, negligible differences. The same scenarios are active for both DOT and MATIC. The white scenario I’ve illustrated represents an initial correction followed by an impulsive rise, while the orange lines indicate a 1-2, 1-2 setup with minimal corrections.
For DOT, the invalidation level for the white scenario is $7.15. In my opinion, the probability of the white count is 51%, and the orange count is 49%. This is not investment advice. If you ask me, it looks like the last accumulation phase before a major rally in altcoins. Again, this is not investment advice.
BreakoutFinally we exceeded the 3 times tested top since Nov. 17th. I consider the corrective phase as finished. A further rise is likely now as the rising trend is still valid.
To ExtendetPolkadot has been rising very fast. The uptrend has been confirmed and is valid. But I expect a correction of this week's rise at least. Since yesterday buying has declined. And if at all then the time for a correction is now.
Is DOT broken? Only 6.5% for the year. This one has yet to give us 70-90%. Just gonna leave this here……..
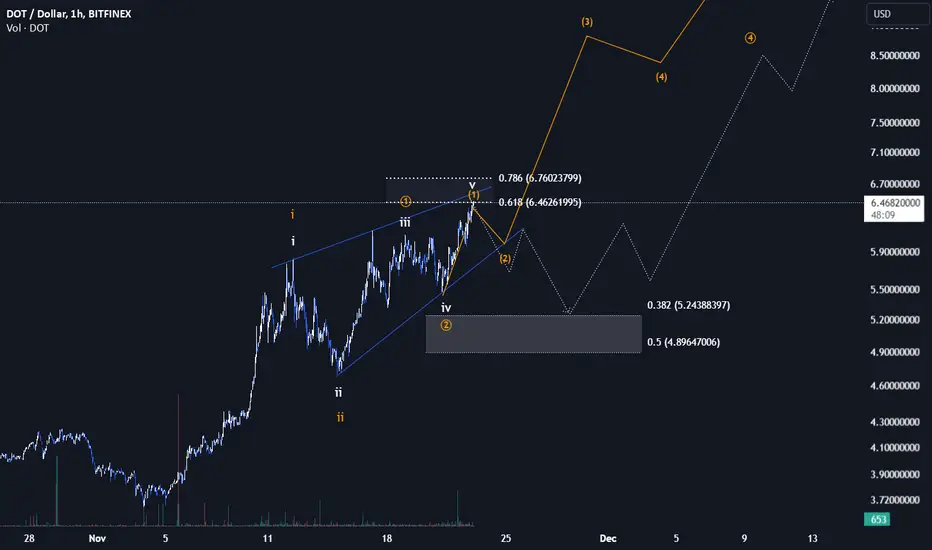
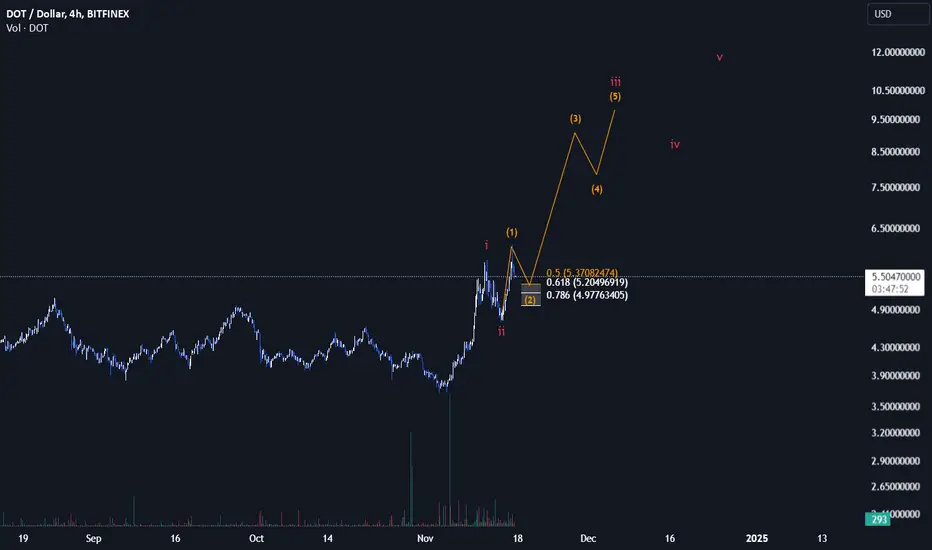
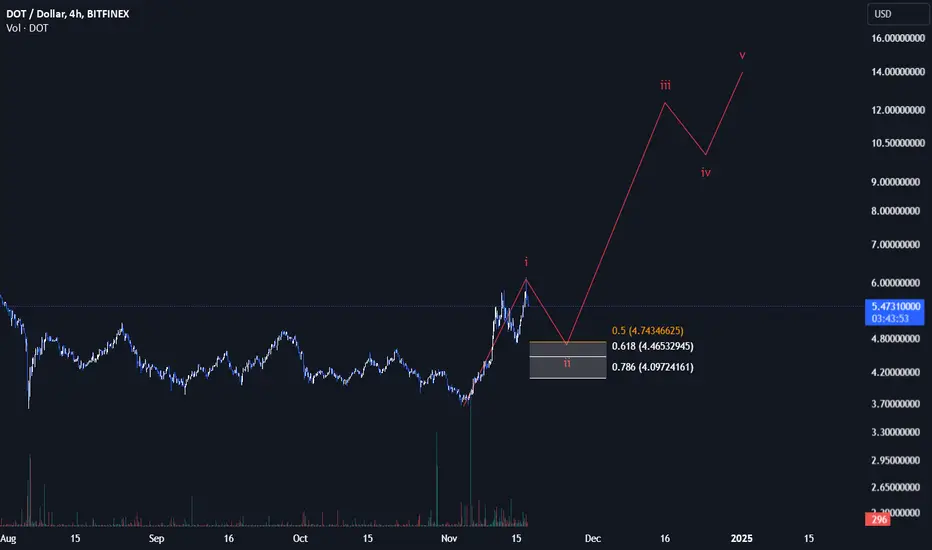
DOTUSDTPolkadot (DOT) - Elliott Wave Subwave Analysis
In Polkadot's short-term analysis, the current price action suggests that the market is forming the 2nd corrective subwave of a larger impulsive wave structure. This subwave is part of the initial stages of an Elliott Wave sequence.
Once this correction concludes, the next phase is anticipated to be the 3rd subwave, which is typically characterized by strong upward momentum within the wave hierarchy. If this scenario plays out, the 3rd subwave could potentially test or break key resistance levels.
Disclaimer: This analysis is purely for educational and informational purposes and should not be considered financial advice. Please conduct your own research or consult a professional before making any trading decisions.
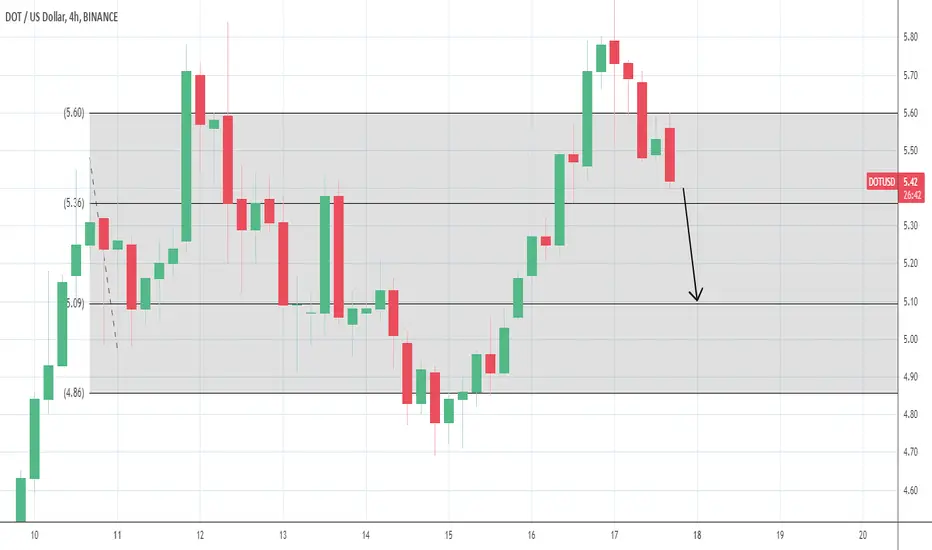
POLKADOT - Sell Idea (Short-term)A quick turn around correction is highly likely at this point. From a short-term perspective, price action can easily make contact with the local key-level support of 5.0934. We're jumping into a short-term sell position.
DOT/USDT (Alternative Count)I recently shared my main scenario, outlining the most probable outcome based on current market dynamics.
This, however, is my alternative scenario, which I consider to be less likely but still worth noting. It presents a different perspective on how the price structure could unfold. While it doesn't align perfectly with my primary expectations, it's always important to remain prepared for varying possibilities in the market.
Stay tuned for further updates as I continue to monitor and refine these analyses!
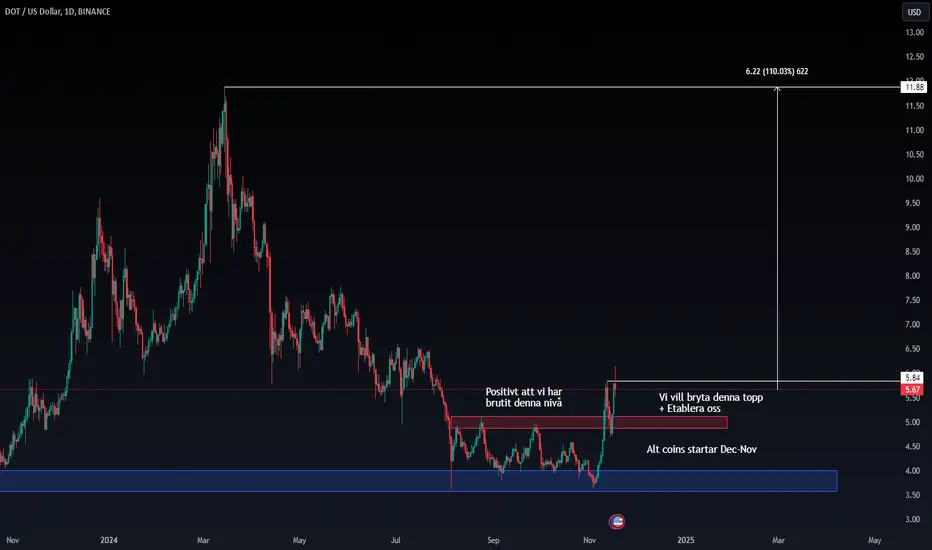
Polkadot 100% from hereMy thought is that we have at least 100% from here! As long as we don`t etablish under our last support zone. Don't make it any harder than this. All we want is an uppward trend!
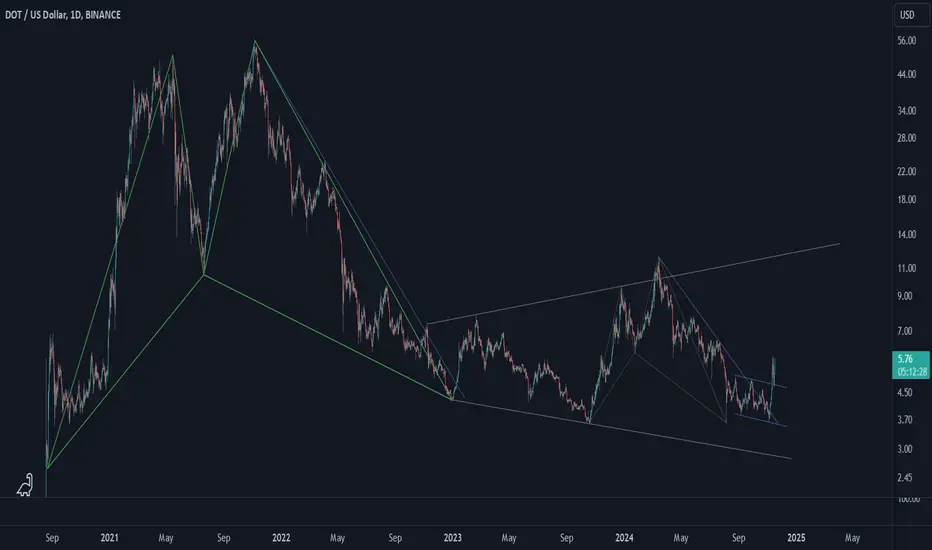
Polkadot (DOT)Polkadot is an open-source sharded multichain protocol that connects and secures a network of specialized blockchains, facilitating cross-chain transfer of any data or asset types, not just tokens, thereby allowing blockchains to be interoperable with each other.
Anyway, DOT chart is simple. First DOT made a big harmonic pattern. Then broke the harmonic pattern's right leg and entered an inverted wedge pattern. Now, it seems DOT has made a minor harmonic pattern, then broke the right leg and is going up. Let's see if DOT can reach the inverted wedge's upper line.