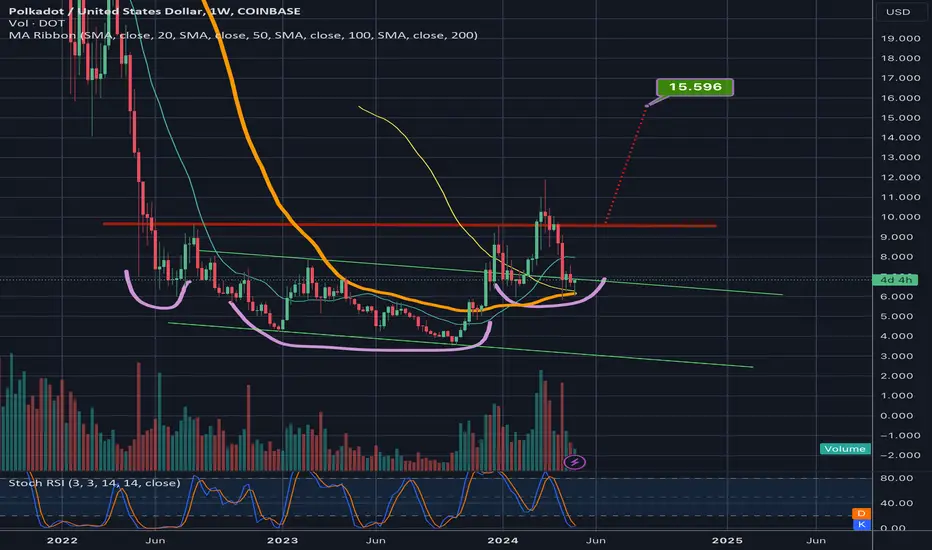
dot bottomas everyone waits for alt season we are seeing possibly some hope for alts, dot is currently seeing an inverse h/s hasn't broke yet but we will see what happens this week. i still think current alt markets look a little weak yet but at some point we will see a bottom pattern. if this pattern plays out we will have targets from $7 to $7.30. if neckline doesn't break this is invalid.
DOTUSD trade ideas
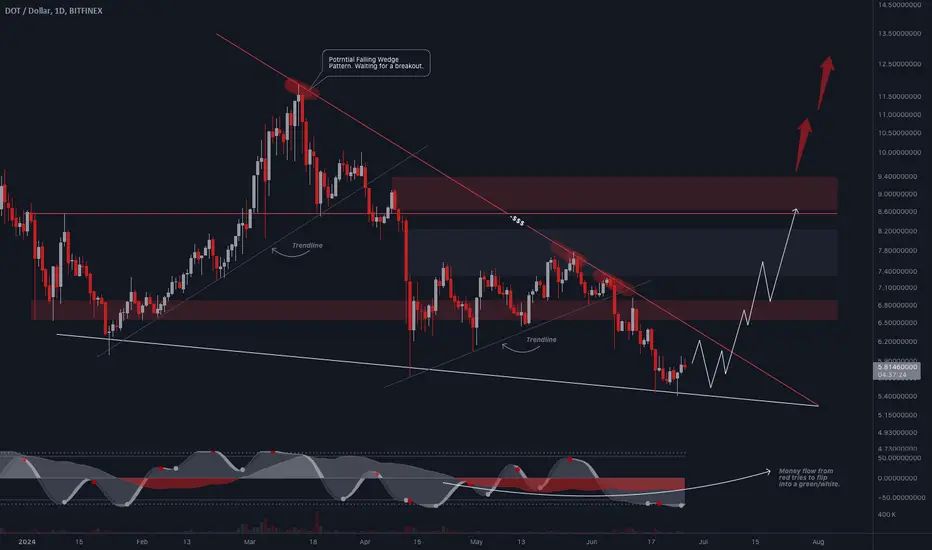
$DOT #Polkadot Trading IdeaDOT/USD (Polkadot) found some support and formed a potential falling wedge pattern on the 1D timeframe. Full send after a breakout. For Polkadot to get on track we need to beat these two resistance (around $6.5-$7.0 and $8.5-$9.4) zones and change the market structure.
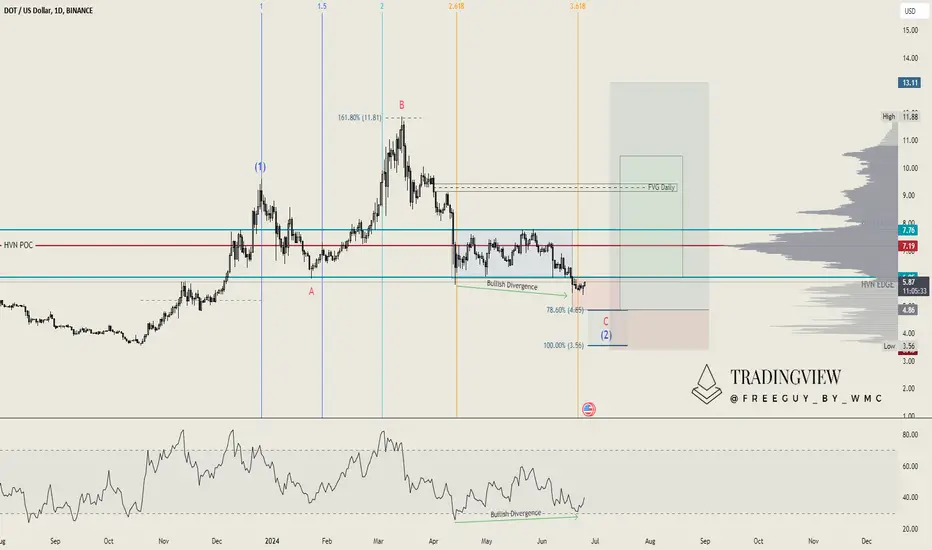
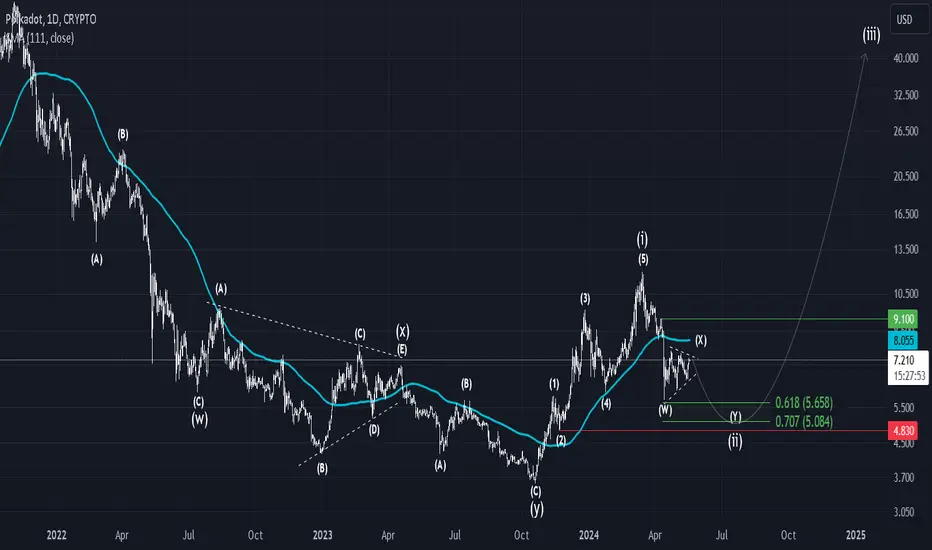
Polkadot (DOT): Setting Up for a Bullish ReversalBINANCE:DOTUSD has recently breached the $6 level, forming a bullish divergence, as indicated by the vertical lines on the chart. The exit from the 3.618 Fibonacci time zone should ideally mark the end of Wave 2, though the exact completion of Wave 2 may lie slightly outside this range. It appears that Polkadot has completed its accumulation phase and is now entering the manipulation phase, with potential for expansion to follow.
Given the current situation, we are planning to place an entry at $4.85, with a stop-loss set just below the 100% Fibonacci retracement to protect against a Wave 2 invalidation. Our initial target is $9.30, aligning with the Daily Fair-Value Gap. This strategy aims to capture the potential upward movement as Polkadot transitions from accumulation to expansion.
Yearly VWAP Analysis:
Polkadot is currently holding the 2021 VWAP level perfectly. However, if this level is lost, the price could move down towards the 2021 VAL (Volume Area Low) at $4.55, which might provide significant support. To resume a bullish trend, Polkadot needs to reclaim the 2021 VAH (Volume Area High) at $6.80. Overcoming this level is essential for a sustained bullish move. If these levels are breached, a drop to the 2021 VAL at $4.55 is possible, where we might find strong support. Overcoming the yearly VWAP resistance is crucial for a bullish continuation.
Monthly VWAP Analysis:
Polkadot has lost the April VAL (Volume Area Low) and recently touched the November 2023 VWAP. Holding the November 2023 VWAP is crucial to maintaining a bullish stance, although there is potential for further downside. We anticipate a possible drop to retest the November 2023 VWAP and VAL levels to gather momentum for a bullish reversal. To turn bullish again, Polkadot needs to reclaim the current month's April VAL and VWAP levels, suggesting a stronger bullish outlook.
Conclusion:
If Polkadot fails to hold the November 2023 VWAP, we expect a move towards $4.82. For a bullish reversal, reclaiming the April VAL and current monthly VWAP levels is essential. Until these levels are reclaimed, we remain cautious and anticipate further downside. Our trading strategy involves entering at $4.85, with a stop-loss at $3.55. The take-profit targets are set at $7.76, $9.50, and open for further potential gains.
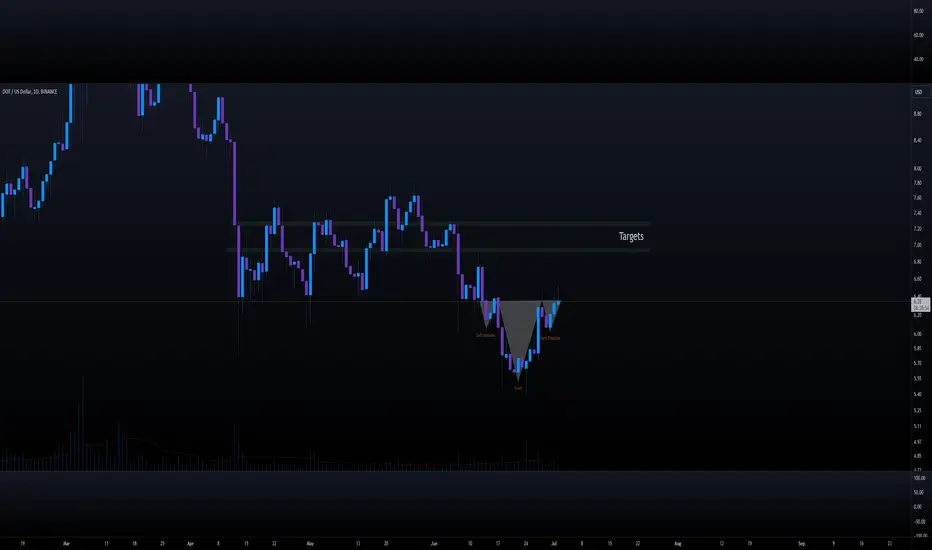
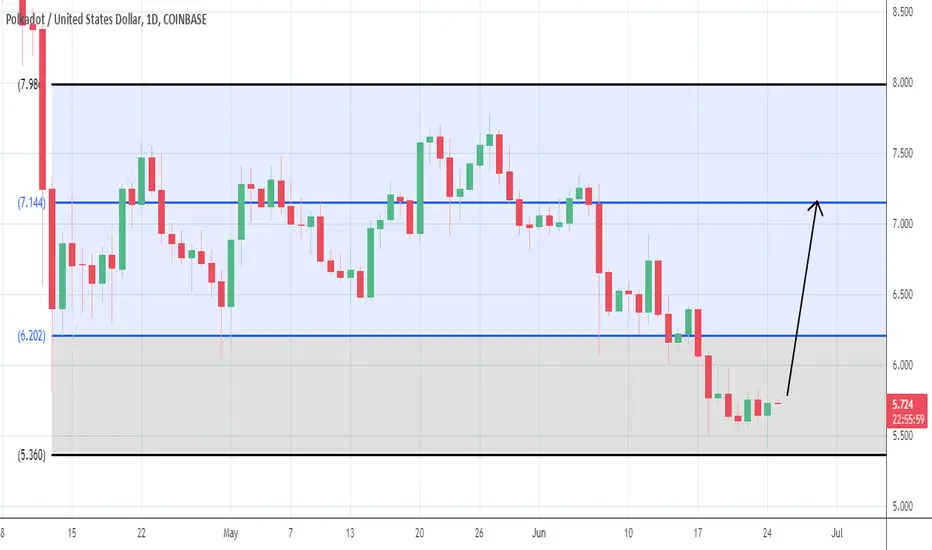
Polkadot - Bullish CampaignPolkadot presents a prime location for a potential turning point at these low levels. We are firing off a new bullish campaign aiming at the two next significant resistance levels of 6.1845 and 7.1460 respectively.
DOT Coin at Strong Support Potential for 24x Gains in Alt SeasonDOT Coin is currently positioned at a robust support level between $5.1 and $5.4, indicating a significant opportunity for a substantial gain during the upcoming altcoin season. Historically, these support levels have proven to be a launchpad for impressive bullish movements, suggesting that now is an ideal time to consider an investment in DOT Coin.
As we anticipate the altcoin season, the potential targets for DOT Coin are particularly promising. Based on historical data, the minimum target for DOT Coin during a bull run is $122, with a maximum target reaching up to $138. These targets highlight the considerable upside potential for DOT Coin, making it a compelling choice for traders looking to capitalize on the altcoin market.
In conclusion, DOT Coin’s current position and historical performance make it a strong candidate for substantial gains. With solid support levels and ambitious targets, DOT Coin is well-positioned to thrive in the upcoming altcoin season. Traders should consider this opportunity to potentially maximize their returns as the market conditions align favorably for DOT Coin.
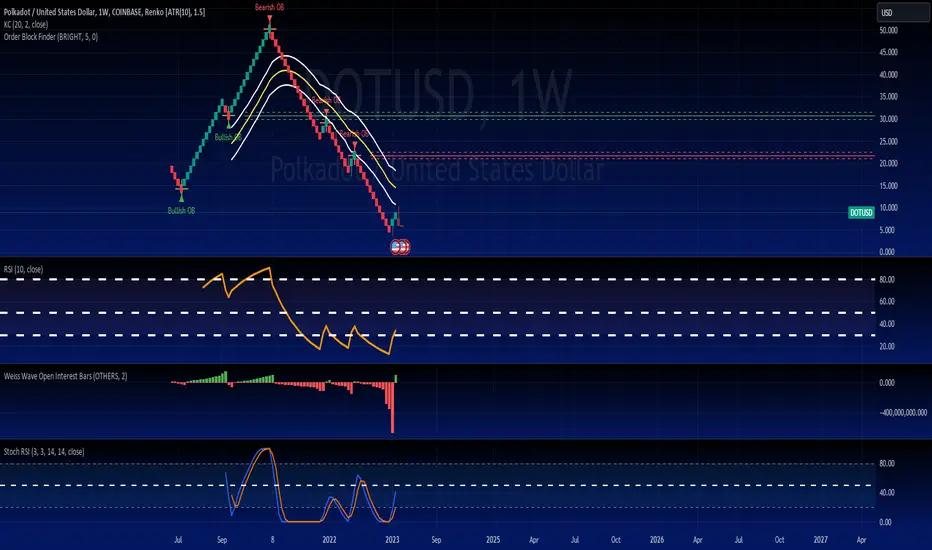
POLKADOT BUY OPPORTUNITYHi folks an interesting long position on DOT here. As we can see from the chart the DOT seems to have hit its bottom at $3.753. We can also see stochastic RSI, RSI and the Weiss open interest start to turn positive. On the Kellner channel we are outside at the extreme levels a time to buy. A long position can be opened as follows
TP 1 : $10.00 This is the when price action wicked up and fell back down indication the first possible resistance level
TP2: $14.00 This is the mean of the Keltner channel
TP: 3 $20.00-$22.00 This is the first bearish order block where price may struggle
SL: $3.00 Below the previous value of $3.753
If it gets above the previous bearish order block and finds support then DOT a further long position could be
TP 4: $30.00
SL : $25.00
Final long scenario is previous bullish order block at $30.00 and finding support then the Final take profit could be
TP 5 :$50.00
Polkadot Elliot Wave ABC Correction over. LONGPolkadot Elliot Wave Correction over. LONG target 23-30 next waves.
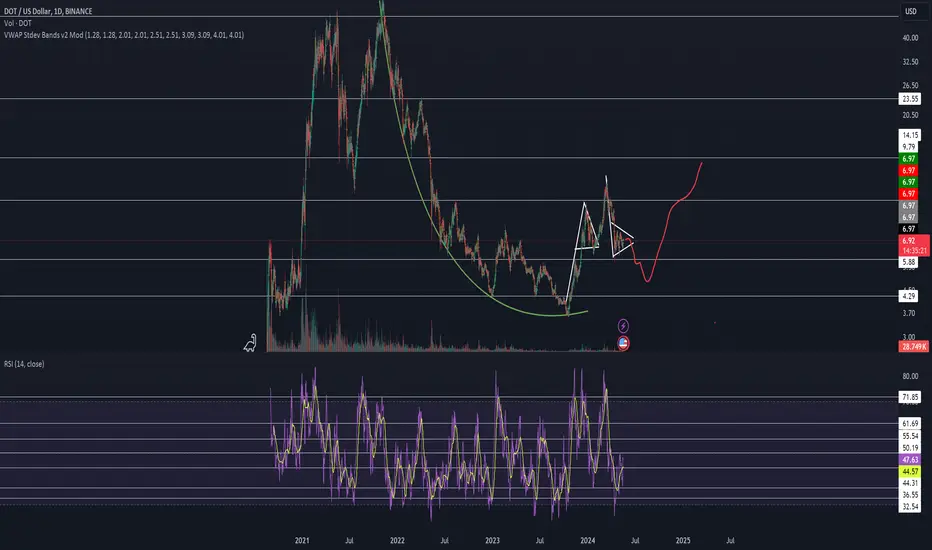
Polka(DOT). Will it Survive?DOT is a long way from its high of $55, back in 2021. And now, currently, price has been struggling to push higher. With the thought the BTC ETFs being a game changer along with the BTC halving, there was the anticipation that Crypto would sky rocket. But this hasn't been the case. With all other coins getting hit by the current environment Crypto is facing, it stands that DOT is no exception. On the daily chart, DOT price is showing a head and shoulders pattern that could spell a push lower to the $5 lvl and maybe even to the $3.50. Since the FED interest rates seem to be the catalyst for the direction of crypto price so far, any data pointing at FED officials wanting to hold rates for longer (being hawkish) will continue to put pressure on Crypto's price.
Well with this said, how is Polkadot going to survive? There is things going for it that can get it through this rough patch:
-There are around 66 interoperability Cryptos and in that sector, DOT is the #1 coin, followed by Chainlink(LINK) and Cosmos(ATOM). DOT boasts close to a $8.5 billion market cap and LINK close to a $8.4 billion market cap (not too far behind), respectively.
-Amongst all the other Cryptos out there, it sits at #14 out of 10,127.
-Staking is currently at 11.78%, which has risen from 2023 when staking was around 9%, which if held for a year would be more then what some hedge funds can make. So not too bad.
-While not as much PR as some of the more prominent coins out there, it does have PR coming out which shows that it is still relevant
What do I think? I think DOT will survive and will likely drop which would be a buying opportunity. The Crypto Market as a whole is taking a drip (sitting at around 2.37 trillion currently, hitting a high this year in March of around 2.64 Trillion, and all time high of around 2.8 trillion back in 2021) and if price does continue to drop, it may test the support around 2.33 trillion. But majority of cryptos are taking a hit and as catalyst start popping up in favor of crypto, it is likely that DOT will join in this.

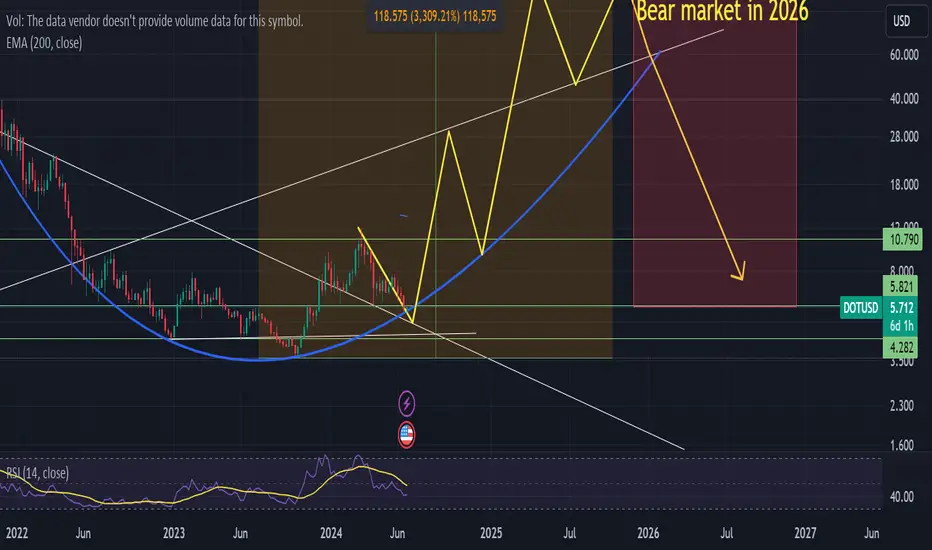
Polkadot Next BullRun- Okay now that we got the Bottom ( 4.3$ ish).
- We can try to calculate the highest points for the next bull run.
- i am not in patterns too much but we can see that DOT formed a kind of Cypher Bullish Pattern.
- A resistance was created around 9.80-10$.
- So Polkadot will have to go retest this zone and breakout to climb more.
--------------------------------------------------------------------------------------------------
- TP Zones :
--------------------------------------------------------------------------------------------------
- TP1 : 50$ ish (ATH 2021).
- TP2 : 85$ ish (161.8 Fibo).
- TP3 : 200$ ish (Max Fibo 423.6).
--------------------------------------------------------------------------------------------------
- Like Always :
-- Take your train ticket before the mass.
-- Sell when others rush to buy :D.
Happy Tr4Ding !

DOT - at the beginning of the returnIt seems that Polkadot, the DOT, has made a harmonic pattern. And the downtrend line has broke due to the uptrend wave started by the BTC.
However, be careful since there probably be a retest or pullback down to shake some of the buyers.

$DOTUSDNot financial advice.
COINBASE:DOTUSD
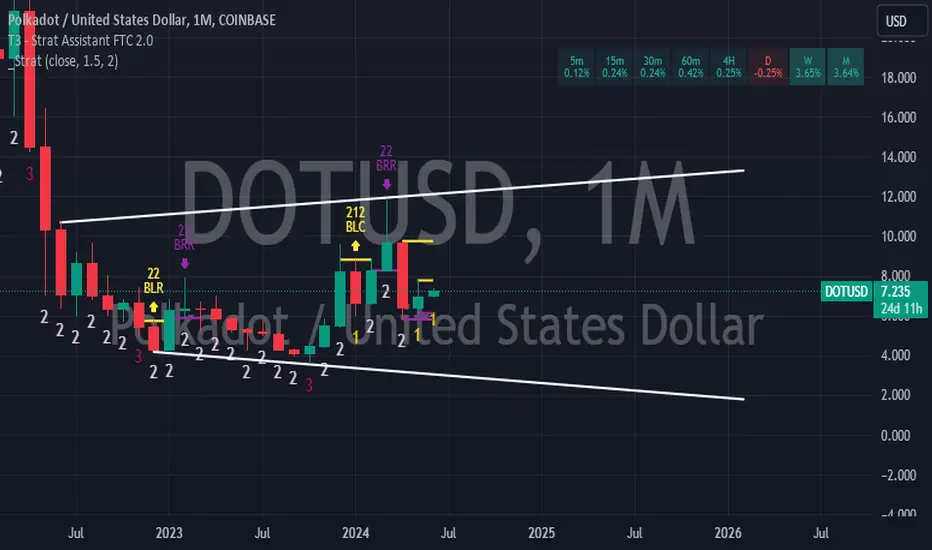
For those familiar with the STRAT on the monthly chart is an inside candle so far looks like bulls want to jump on it but it can go either way. yellow lines bull side, purple lines downside.
Like and follow.
Thanks.
Updat dot /usd analysis by ict price action Tp 1 of dot/usd reached successfully
Waiting for tp2 and .....
Good luck dear traders..
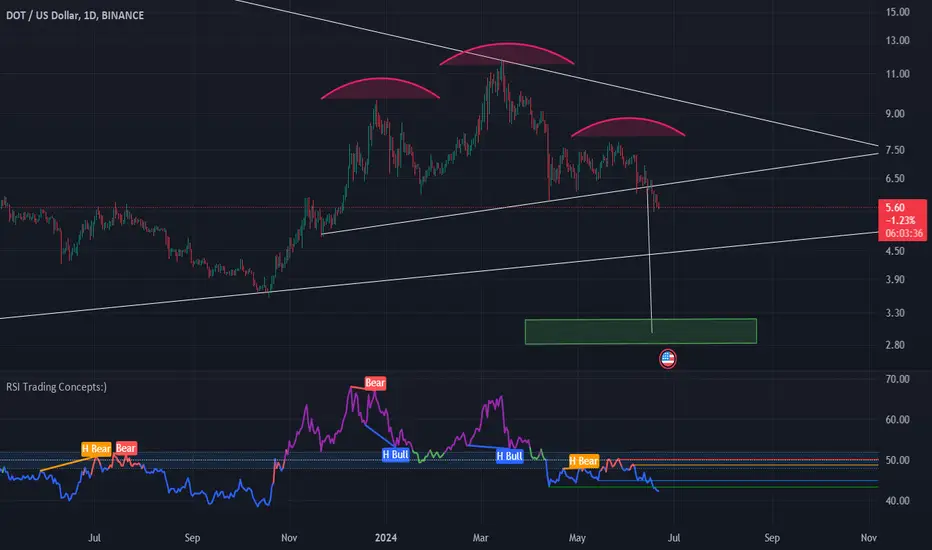
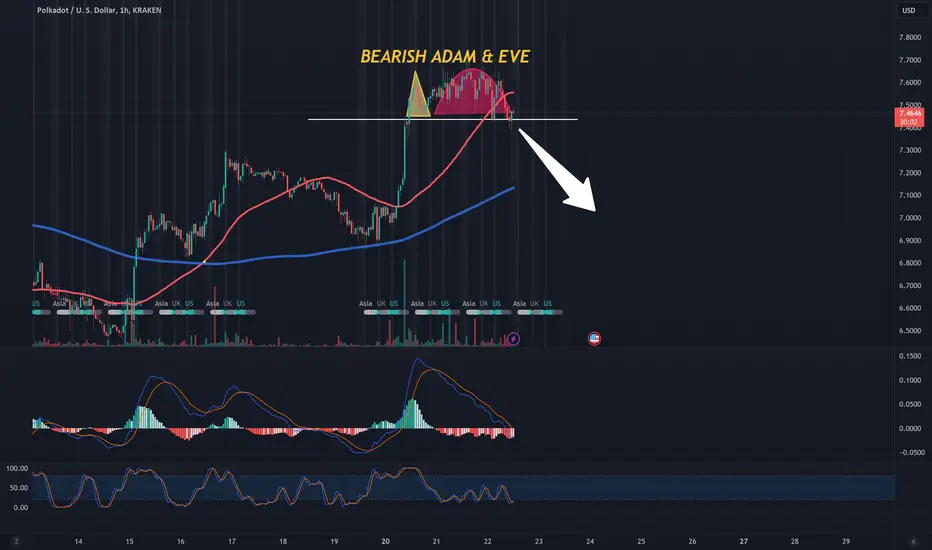
DOT forms Bearish Adam and Eve patternOn the 1 hour time frame, you can clearly see that the recent breakout has formed a Bearish Adam and Eve pattern.
The recent breakout was more of a "Sell the News" event when the SEC tweeted that all of the ETH ETF applications needed to be updated.
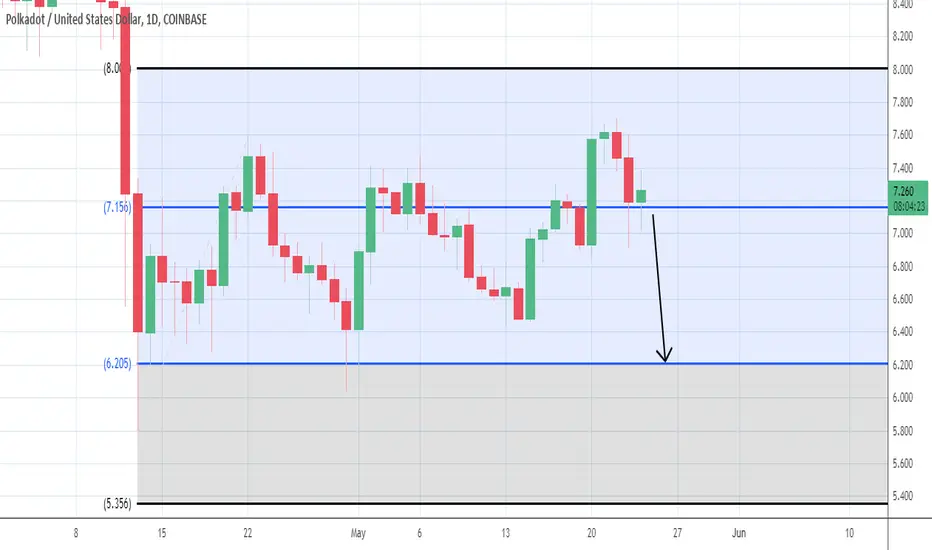
If the price action of DOT falls below $7.20 (the likely retest of the breakout against the symetrical tiangle it broke out of...) then the price will testt he next leg down at $6.90.
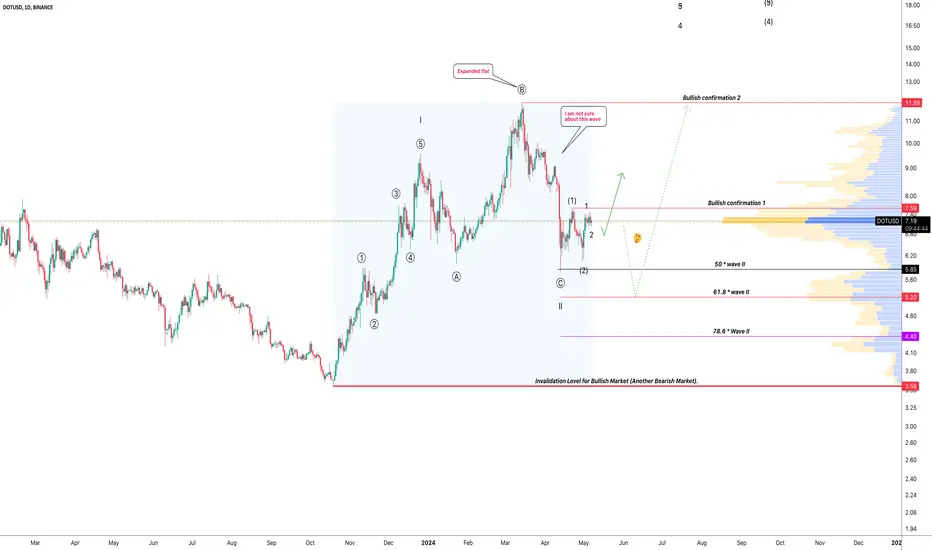
PolkaDOTDOT seems to be finalizing it's wave (2) of the alleged main motive wave that was started back in Oct2023.
I expect one last dip before the impulsive wave (3) starts.
Getting in the green area would be a good buying opportunity in my opinion.
The best stoploss would be under Oct2023 bottom but breaking the red line seems like a good close stop-loss.
passing the green line without dropping first invalidates my view.
Polkadot: Test of Strength 💪DOT experienced a decline last week. However, we consider this to be primarily part of the internal substructure of the orange wave (iii), which should extend well above the resistance at $8.50. In the short term, further setbacks to our orange Target Zone (between $4.85 and $6.58) are theoretically possible, which is why we are keeping this range active.

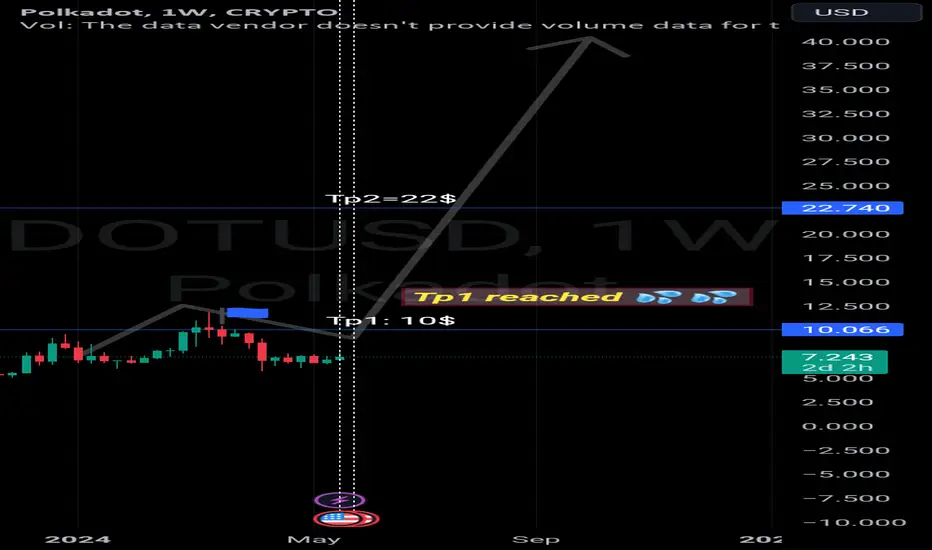
DOTUSD approaching a buy zoneHi traders
Let's take a look at DOTUSD chart on 1D time frame.
DOTUSD is approaching a buy zone: 3.60 - 4.00$ which is the area where we expect a heavy accumulation for the next bull market.
Long term target would be around 23 $ which is also an important fib level 0.618
Patience is a key as it may be a slow bleed.
Good luck

DOT in daily chartHello everyone
What is happening in some of Altloins is really weird and I guess it is because they have to take time and wait for BTC to start its next rally.
I mean these patterns for wave 2 are not so common but we should not forget that we are talking about Crypto market with the least liquidity among all other markets so mass psychology can be more unstable than the others.
By the way, if we are near to the next Altcoin Season, so this counting might be correct and DOT has made an Expanded Flat for its wave II cycle.
Another problem I have is the last correction which is not very similar to wave 1 and 2 and might be possible we have one more correction down to more common support level of wave 2.
Thanks
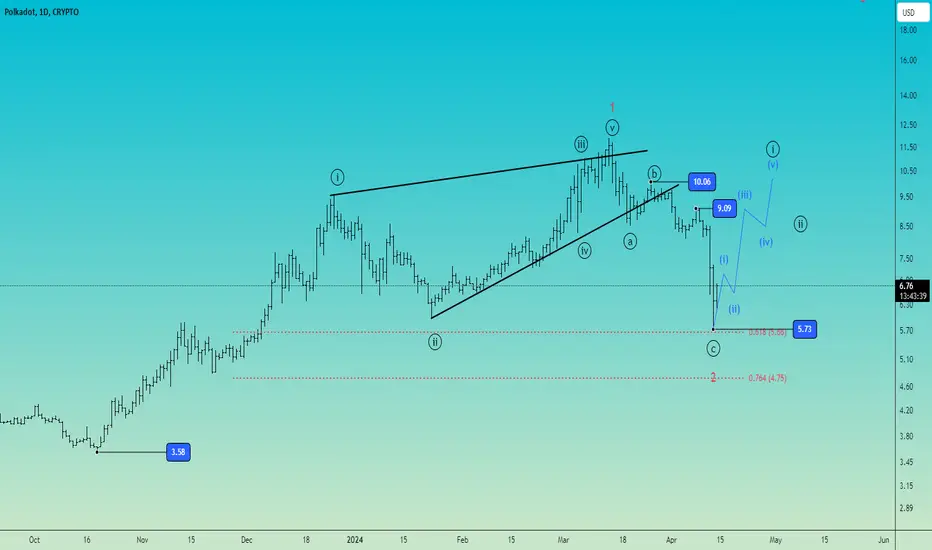
DOTUSD Elliott wave countWatching for evidences wave 2 ended 5.73 and now we start to build the wave 3.
What we want to see before taking action is an impulse to the upside that clears 9.09 and 10.06 levels that will be the wave ((1)) of 3.
Polkadot: Ready For Take-Off! 🛫DOT has been rising strongly since Tuesday, after it had previously re-entered our orange Target Zone (between $6.58 and $4.85). We currently locate the coin in the orange wave (iii) and expect a break of the resistance at $8.50 next. This should then provide further bullish momentum. We anticipate the high of this movement only well above the top of the green wave B.

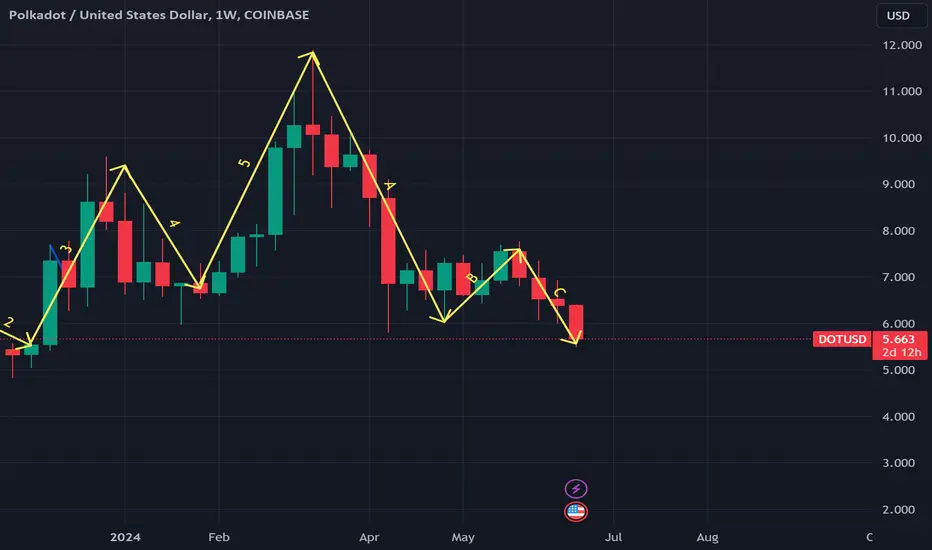
Dotusd chartSince I posted a chart on the dotusdt pair showing the double bottom and the bearish head and shoulders pattern, I also wanted to post a polkadot idea that showed the bigger inverse head and shoulders pattern thats still very much in play as well. We can see how dot did a very convincing fake breakout above the neckline before dipping back down below it. It’s common for price to go above the neckline multiple times and then back below it in between those times before the actual breakout, usually it doesn’t go this high above the neckline without validating the breakout, but let this chart be a rare example that shows it can happen. We can see that the weekly 50ma in orange and the weekly 100ma in yellow is currently holding double reinforced support and could easily end up being the lowest part of the right shoulder of the inverse head and shoulders. On the previous dotusdt chart that I posted shortly before this one (which I will link to below) you can see the weekly 50 ma is double reinforced support with the top trendline of the channel also suggesting the bottom of the right shoulder may be in. The top trendline maintained support on the usdt pair but we can see price action had dipped below the trendline here on the usd pair and is still currently just below it. Need to reclaim that trendline as support on the usd pair too to help insure we won’t breakdown from the bearish smaller head and shoulder I posted on the usdt pair chart. *not financial advice*