Polkadot (DOT): Strong Signs of Potential Bullish MovementPolkadot caught our attention with rather good potential for upward movement from here, which can be seen both on 30M timeframe and 4H timeframe
More in-depth info is in the video—enjoy!
Swallow Academy

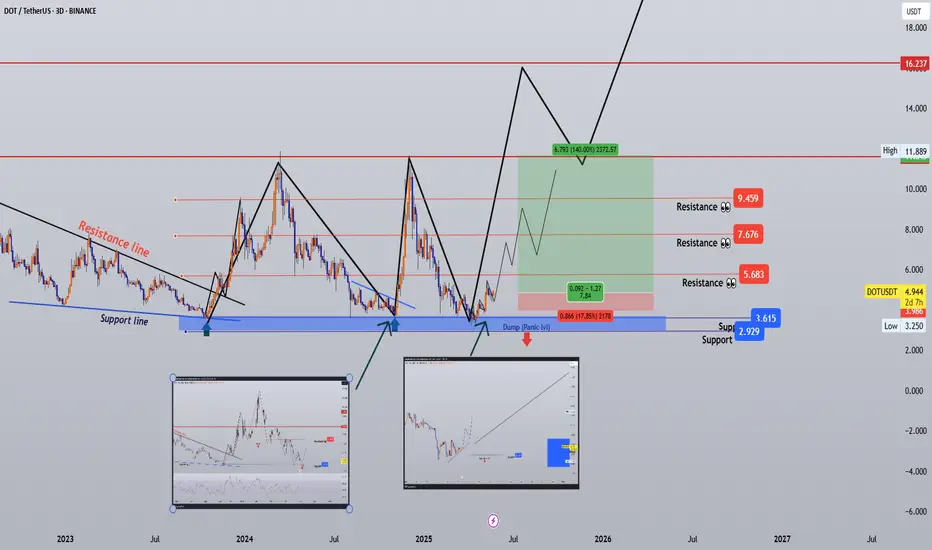
#DOTUSDT 3D Analysis — Triple Base Defense, Macro Wave Ready?🎯 #DOTUSDT 3D Analysis — Triple Base Defense, Macro Wave Ready?
🗓 Published: May 22, 2025
📊 Timeframe: 3D | Exchange: Binance
Author: @HamadaMark
🔍 Technical Overview
DOT has confirmed a triple bottom structure over 18+ months, defending the same demand zone around $2.9–$3.6.
This zone has acted as
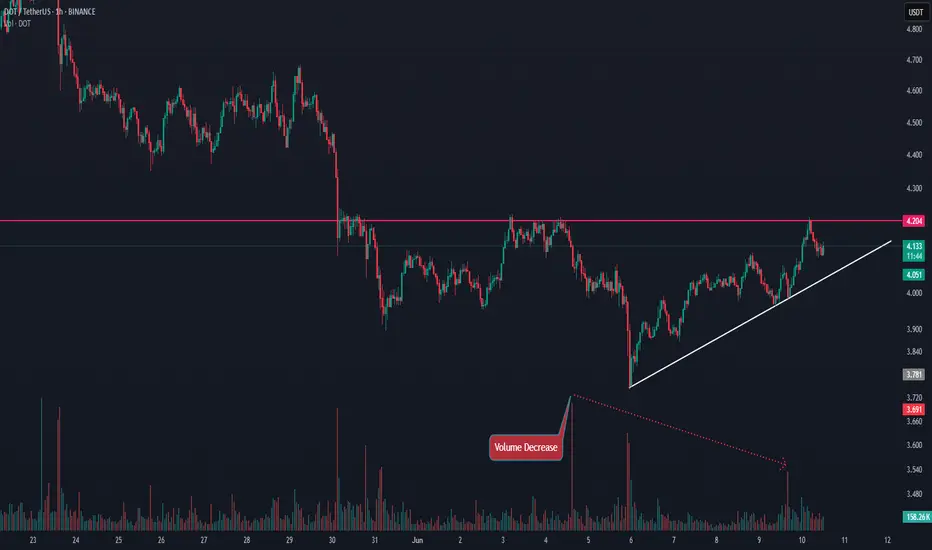
DOTUSDT|1H ANALYSIS🔍 In the 1-hour timeframe, DOT is currently holding above a valid ascending trendline 🔻 which has acted as support multiple times and prevented further downside 🛡️📉
This suggests that buyers are stepping in at lower levels, showing accumulation interest 🧲💰
👁️🗨️ Now, the price is approaching a key
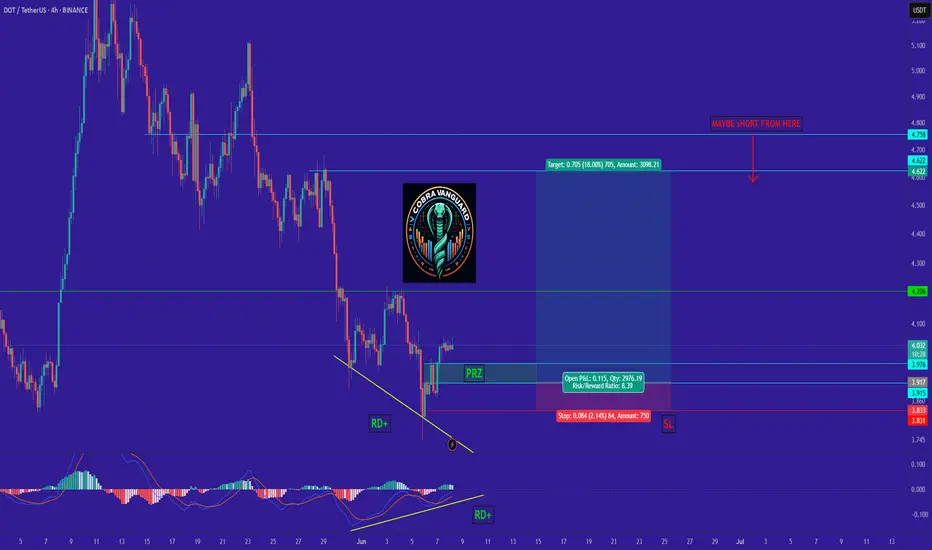
DOT.Give me some energy !!!What I currently expect is that the price could correct slightly, as shown on the chart, and then pump by about 18% from the PRZ (Price Reversal Zone). This signal is strengthened by the presence of strong positive divergence. In summary, the PRZ is a good entry point, derived from the confluence of
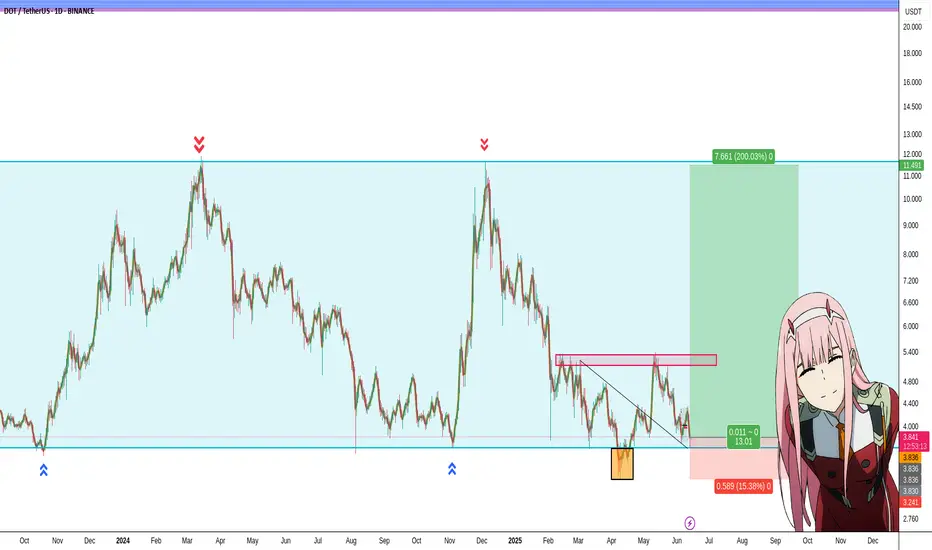
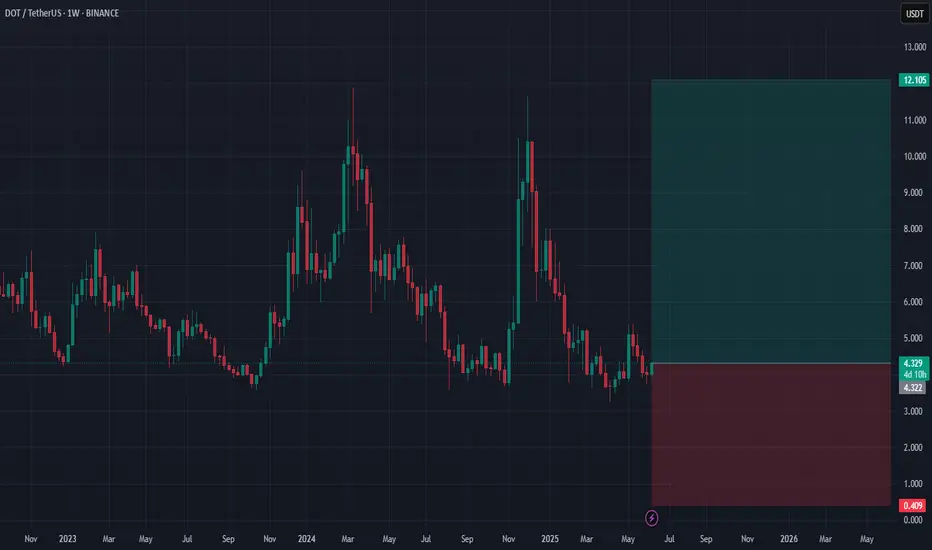
DOT Will Pump 200% Next Few MonthsWe are headed to 12$ - 11$ over this year - Profiting 200%
STOP LOSS : Dailly Close Bellow 3.30$ (-15%)
Low Risq Big WIN!
Not Financial Advice , But I'm in Baby ;)
CRYPTOCAP:DOT BINANCE:DOTUSDT COINBASE:DOTM2025 BYBIT:DOTUSDT.P BYBIT:DOTUSDT COINBASE:DOTUSDT BINANCE:DOTBTC
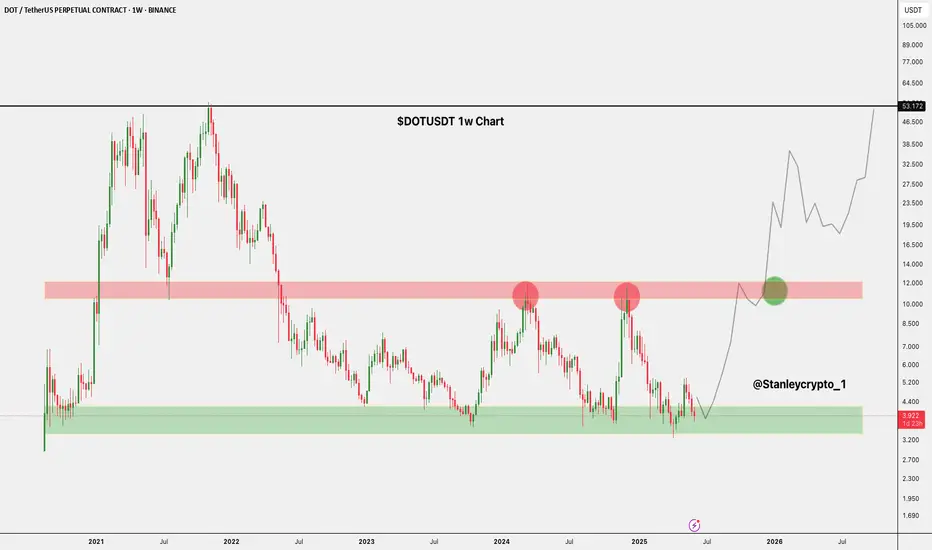
$DOT Setup: Watch This BreakoutCRYPTOCAP:DOT is trading in a clear range between $3.544, $4.022 support and $10.132, $12.564 resistance.
The current pullback to the demand zone hints at potential accumulation.
A breakout above $12.423 could trigger a strong rally toward $23.654, $32.756, $53.172, and higher.
DOT is gearing
DOTUSDT 1W AnalysisDOT ~ 1W Analysis
#DOT Buy back gradually from this support block with a short term target of at least 20%+ from this support.

DOT/USDT - Bullish On the 4-hour chart, DOT/USDT has shown a clear bullish rejection from its significant horizontal support zone around $3.80 - $3.85. This strong bounce indicates robust buying interest at this critical level, signaling a potential reversal and a buying opportunity. The price action here underscores
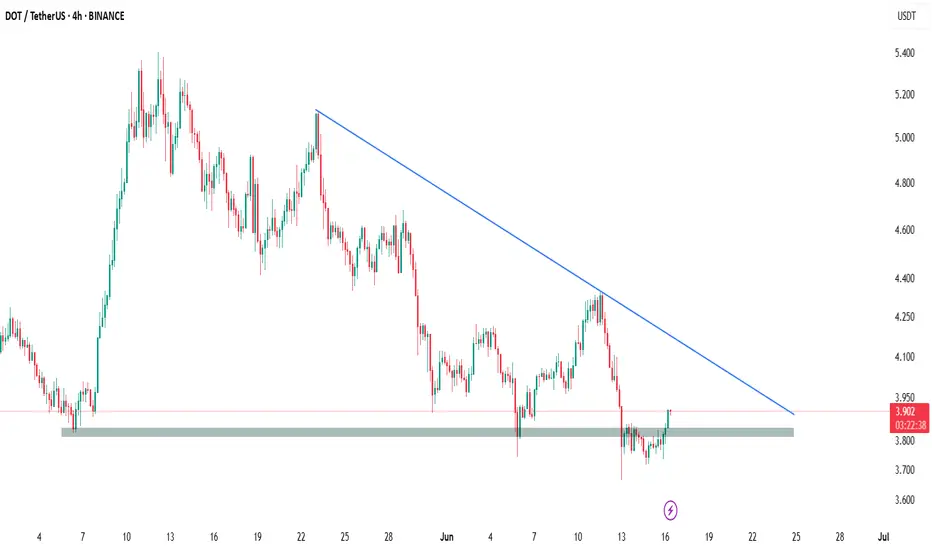
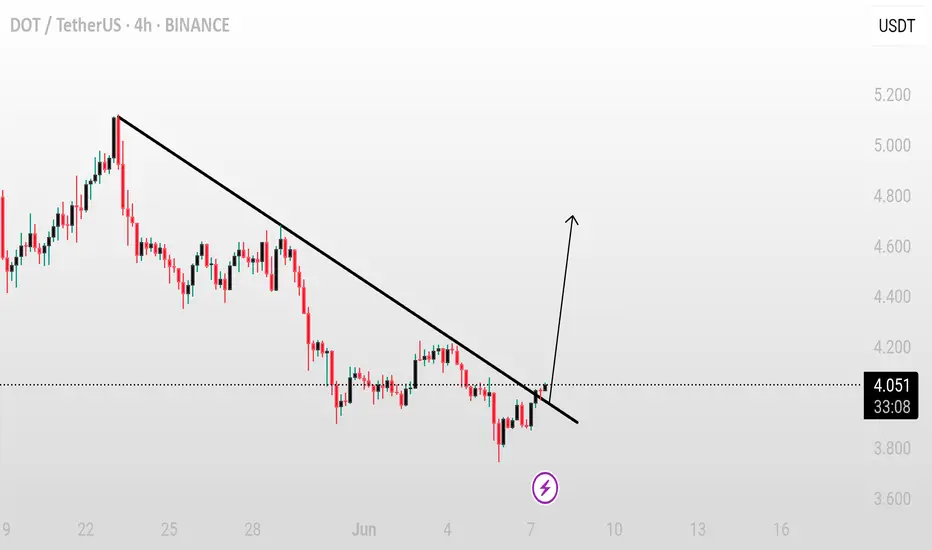
DOT/USDT – Trendline breakout confirmedHere’s a trading idea for DOT/USDT:
---
DOT/USDT – Trendline breakout confirmed
DOT has confirmed a breakout above its descending trendline, signaling a potential shift in momentum. If the price holds above the breakout level, a 10–20% pump could follow in the short term.
Key levels to watch:
–
See all ideas
Summarizing what the indicators are suggesting.
Oscillators
Neutral
SellBuy
Strong sellStrong buy
Strong sellSellNeutralBuyStrong buy
Oscillators
Neutral
SellBuy
Strong sellStrong buy
Strong sellSellNeutralBuyStrong buy
Summary
Neutral
SellBuy
Strong sellStrong buy
Strong sellSellNeutralBuyStrong buy
Summary
Neutral
SellBuy
Strong sellStrong buy
Strong sellSellNeutralBuyStrong buy
Summary
Neutral
SellBuy
Strong sellStrong buy
Strong sellSellNeutralBuyStrong buy
Moving Averages
Neutral
SellBuy
Strong sellStrong buy
Strong sellSellNeutralBuyStrong buy
Moving Averages
Neutral
SellBuy
Strong sellStrong buy
Strong sellSellNeutralBuyStrong buy
Displays a symbol's price movements over previous years to identify recurring trends.