Polkadot (DOT): Strong Signs of Potential Bullish MovementPolkadot caught our attention with rather good potential for upward movement from here, which can be seen both on 30M timeframe and 4H timeframe
More in-depth info is in the video—enjoy!
Swallow Academy

Polkadot - BEWAREI have been checking out some news and fundamentals lately on this coin.
LMAO makes me laugh people still look into trading memes, investing, whatsoever... Those might get burned once again, cause this BTC.D party aint nowhere to being done. It will continue to remove liquidity from coins with no
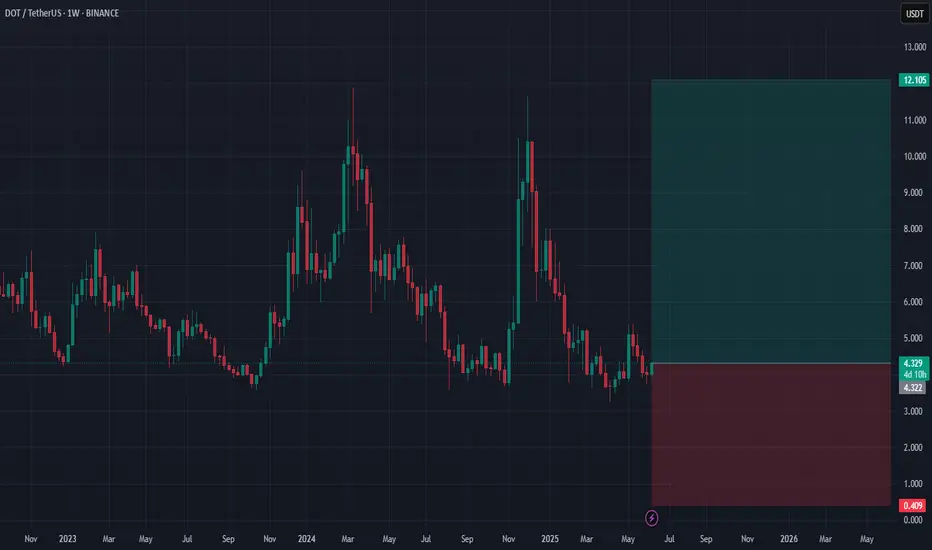
DOTUSDT 1W AnalysisDOT ~ 1W Analysis
#DOT Buy back gradually from this support block with a short term target of at least 20%+ from this support.

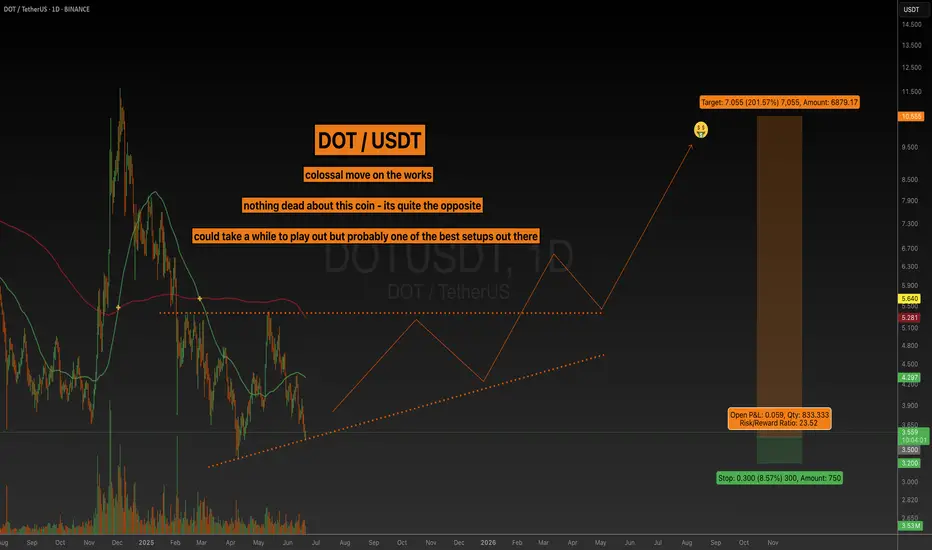
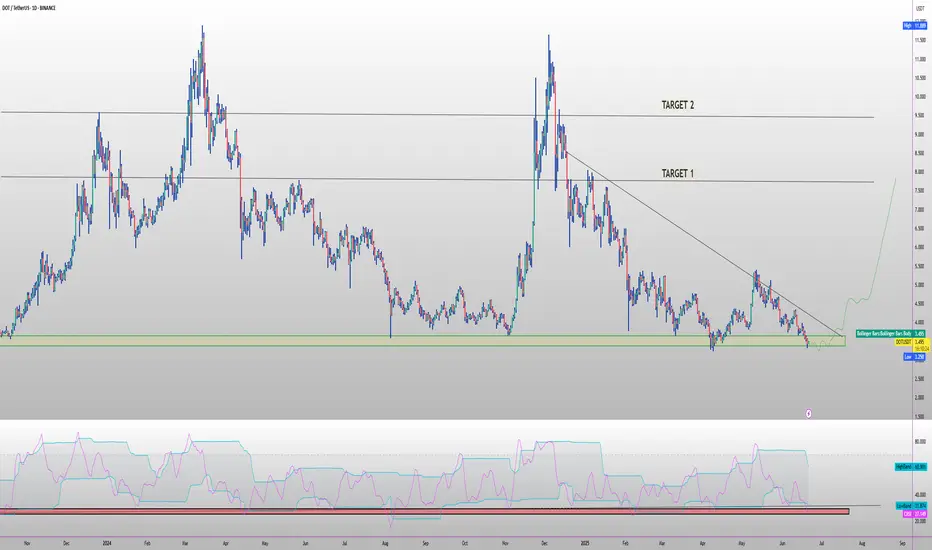
DOT Will Pump 200% Next Few MonthsWe are headed to 12$ - 11$ over this year - Profiting 200%
STOP LOSS : Dailly Close Bellow 3.30$ (-15%)
Low Risq Big WIN!
Not Financial Advice , But I'm in Baby ;)
CRYPTOCAP:DOT BINANCE:DOTUSDT COINBASE:DOTM2025 BYBIT:DOTUSDT.P BYBIT:DOTUSDT COINBASE:DOTUSDT BINANCE:DOTBTC
DOTUSDT Long IdeaPolkadot appears poised for a potential move, having taken liquidity and expanded impulsively. The recent fill of the fair value gap (FVG) at the consequent encroachment level, coupled with holding above the order block, suggests a bullish outlook. Continued accumulation at these levels could potent

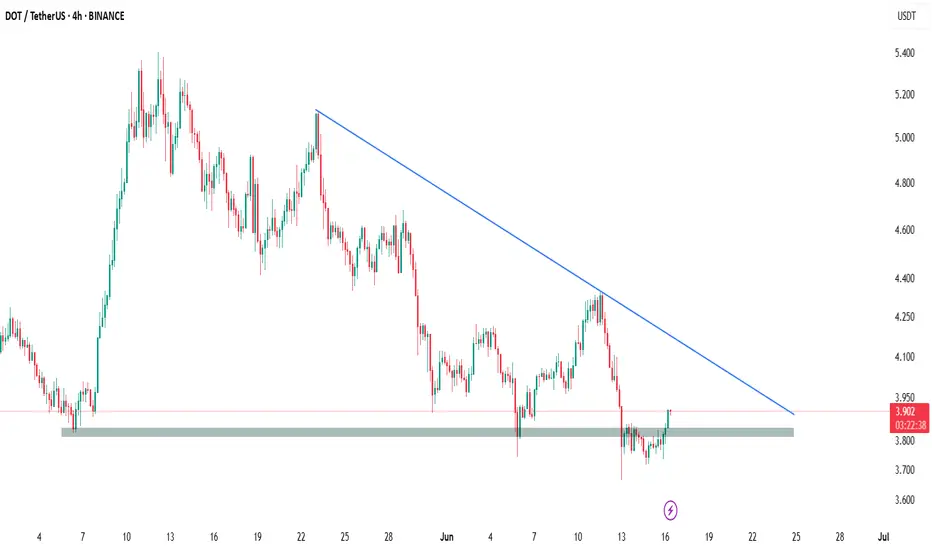
DOT/USDT - Bullish On the 4-hour chart, DOT/USDT has shown a clear bullish rejection from its significant horizontal support zone around $3.80 - $3.85. This strong bounce indicates robust buying interest at this critical level, signaling a potential reversal and a buying opportunity. The price action here underscores
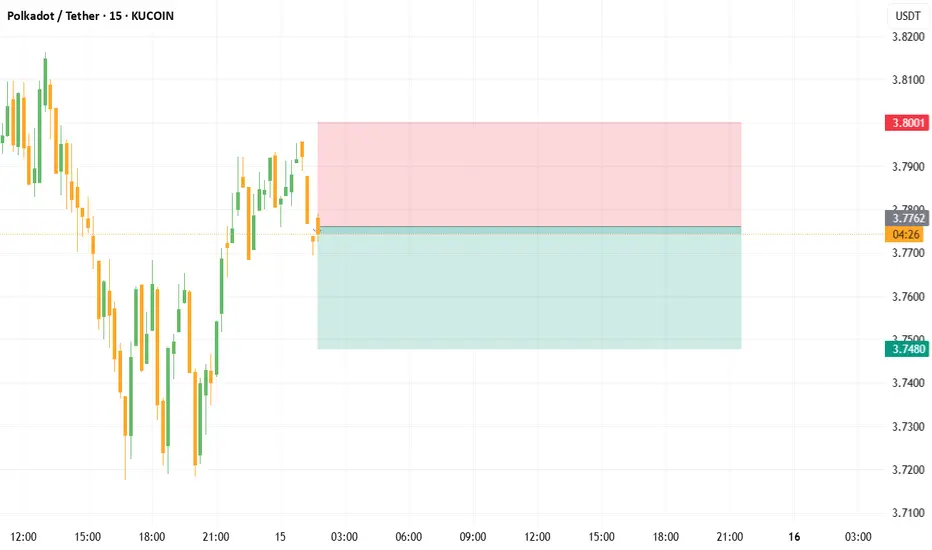
DOT/USDT High win rate scalping signals in 15 minutes (TEST)- Signal: Empty
- Entry: 3.778 ~ 3.782
- Take Profit: 3.761, 3.748
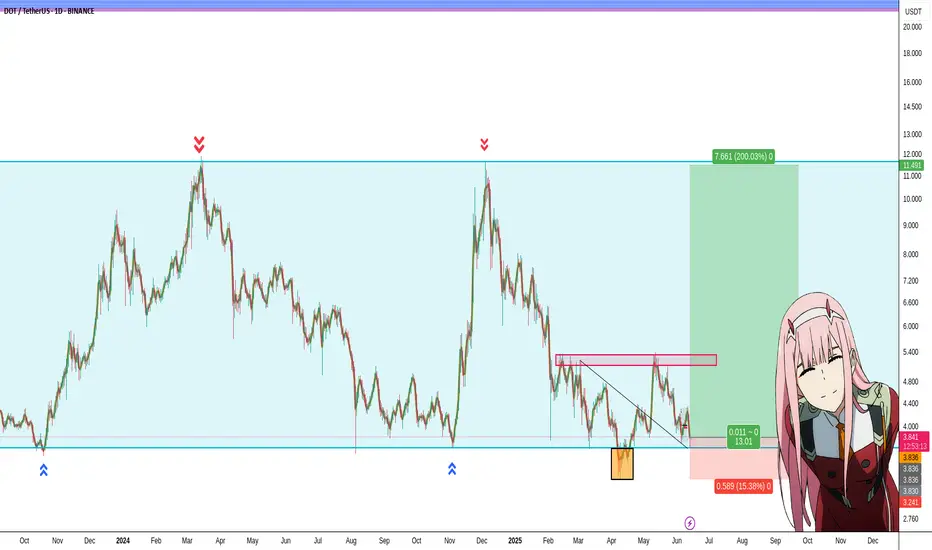
DOT PLAN FOR 2025🔥 MIL:DOT long setup (1D) 🚀
✅ Entry Zone: $3.10 – $3.40 (triple-tested demand)
🎯 Targets
• TP-1: 8.80 (’24 breakdown line)
• TP-2: $10.40 (pre-bear support)
⛔ Stop-Loss
Daily close < $2.5
📊 Thesis
Polkadot 2.0 is rolling out NOW: Agile Coretime marketplace, JAM smart-contract hub & 6-sec bloc
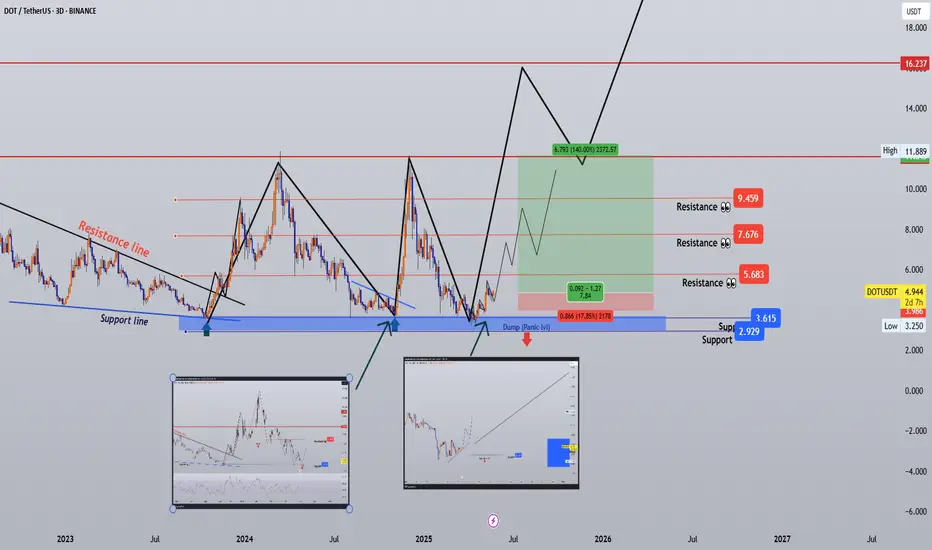
#DOTUSDT 3D Analysis — Triple Base Defense, Macro Wave Ready?🎯 #DOTUSDT 3D Analysis — Triple Base Defense, Macro Wave Ready?
🗓 Published: May 22, 2025
📊 Timeframe: 3D | Exchange: Binance
Author: @HamadaMark
🔍 Technical Overview
DOT has confirmed a triple bottom structure over 18+ months, defending the same demand zone around $2.9–$3.6.
This zone has acted as
See all ideas
Summarizing what the indicators are suggesting.
Oscillators
Neutral
SellBuy
Strong sellStrong buy
Strong sellSellNeutralBuyStrong buy
Oscillators
Neutral
SellBuy
Strong sellStrong buy
Strong sellSellNeutralBuyStrong buy
Summary
Neutral
SellBuy
Strong sellStrong buy
Strong sellSellNeutralBuyStrong buy
Summary
Neutral
SellBuy
Strong sellStrong buy
Strong sellSellNeutralBuyStrong buy
Summary
Neutral
SellBuy
Strong sellStrong buy
Strong sellSellNeutralBuyStrong buy
Moving Averages
Neutral
SellBuy
Strong sellStrong buy
Strong sellSellNeutralBuyStrong buy
Moving Averages
Neutral
SellBuy
Strong sellStrong buy
Strong sellSellNeutralBuyStrong buy
Displays a symbol's price movements over previous years to identify recurring trends.