Polkadot (DOT): Strong Signs of Potential Bullish MovementPolkadot caught our attention with rather good potential for upward movement from here, which can be seen both on 30M timeframe and 4H timeframe
More in-depth info is in the video—enjoy!
Swallow Academy
DOTUSDT.P trade ideas

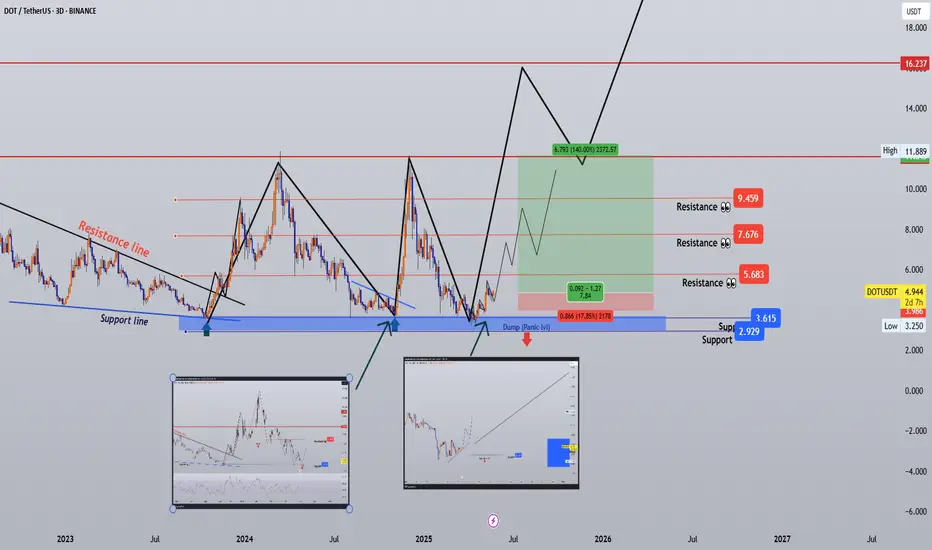
#DOTUSDT 3D Analysis — Triple Base Defense, Macro Wave Ready?🎯 #DOTUSDT 3D Analysis — Triple Base Defense, Macro Wave Ready?
🗓 Published: May 22, 2025
📊 Timeframe: 3D | Exchange: Binance
Author: @HamadaMark
🔍 Technical Overview
DOT has confirmed a triple bottom structure over 18+ months, defending the same demand zone around $2.9–$3.6.
This zone has acted as a launch base for all major rallies since mid-2023, and we're now setting up for another potential macro leg.
📌 Pattern Insights:
✅ Triple base with equal lows
✅ Falling wedge breakout (past) with measured rallies
✅ Major structure respected — bulls still in control
✅ Weekly momentum flipping from deep oversold
🟦 Key Support Zones:
Main Support: $3.615 – structural neckline
Final Floor: $2.929 – cycle base
📛 Panic Level: Daily/3D close below $2.9 = invalidation & full reset
🎯 Target Zones (Next Macro Leg):
TP1: $5.683 – structure resistance
TP2: $7.676 – major horizontal supply
TP3: $9.459 – breakout zone before 2024 top
TP4: $16.237 – macro range high (2021 echo)
📈 Current setup offers +140% upside to TP3 with a clean R:R of ~7.84 from entry
🧠 Strategy Insight
• DOT is a macro structure play — entries near $4 are ideal
• Add size if price reclaims $5.68 with volume
• Swing traders may hold partial exposure into Q3–Q4
• SL below $3.6 or $2.9 depending on position size + risk appetite
💡 When altcoins defend the same base 3x, that level becomes legendary.
🗣 What’s Next?
Hold → push toward $5.68 → consolidation → leg toward $7.6+
Break below $3.6 = caution
Close below $2.9 = reset
📢 DOT is quietly building energy. The longer it holds this zone, the harder it breaks out. Respect the base.
we ask Allah reconcile and repay
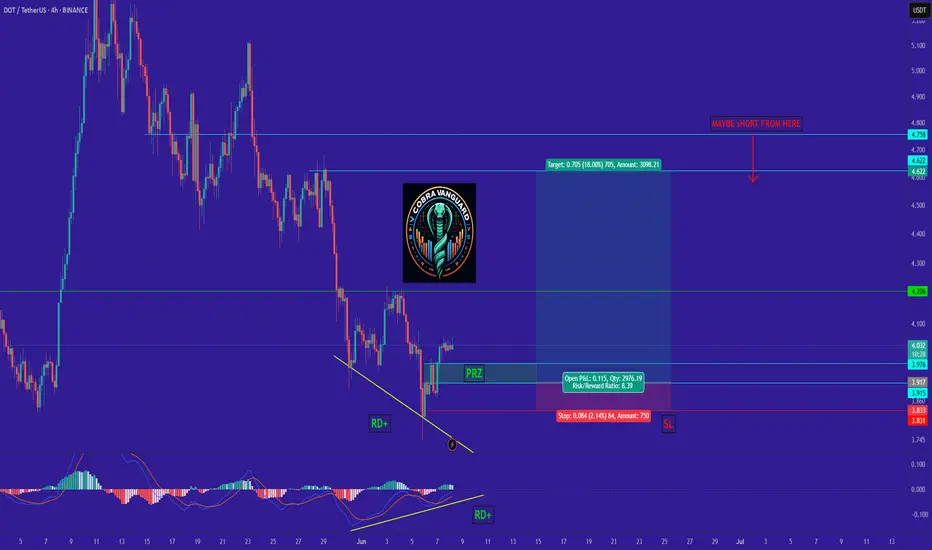
DOT.Give me some energy !!!What I currently expect is that the price could correct slightly, as shown on the chart, and then pump by about 18% from the PRZ (Price Reversal Zone). This signal is strengthened by the presence of strong positive divergence. In summary, the PRZ is a good entry point, derived from the confluence of touchlines and pivots. However, if the price ignores this zone and drops below it, my analysis will be invalidated.
Best regards CobraVanguard.💚
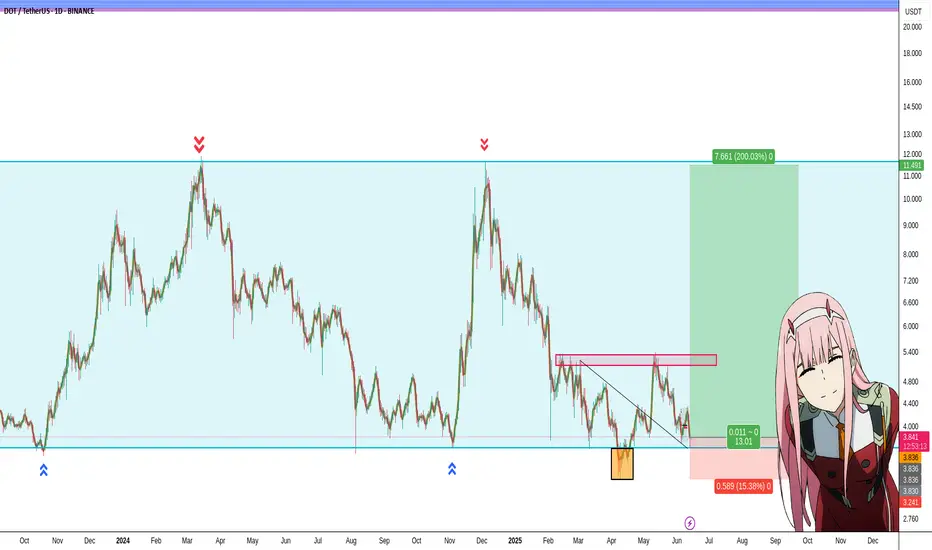
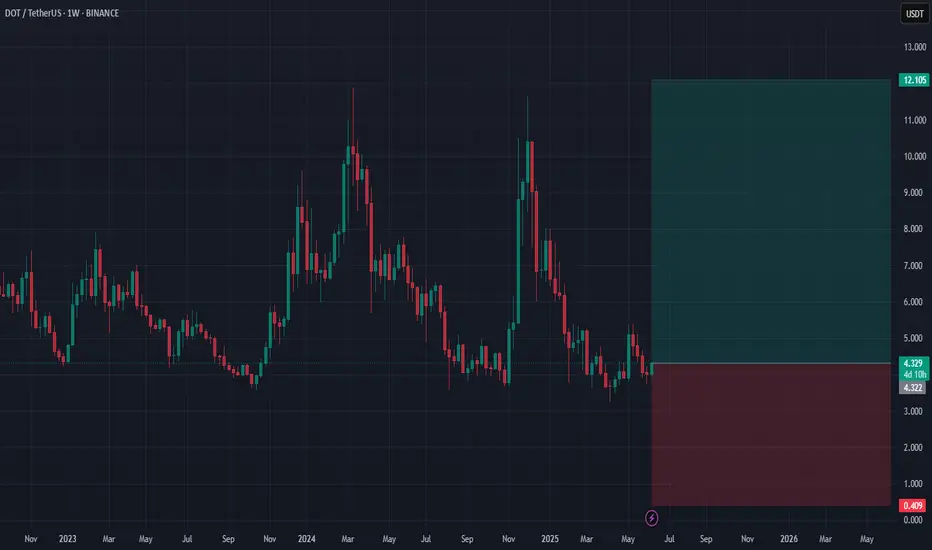
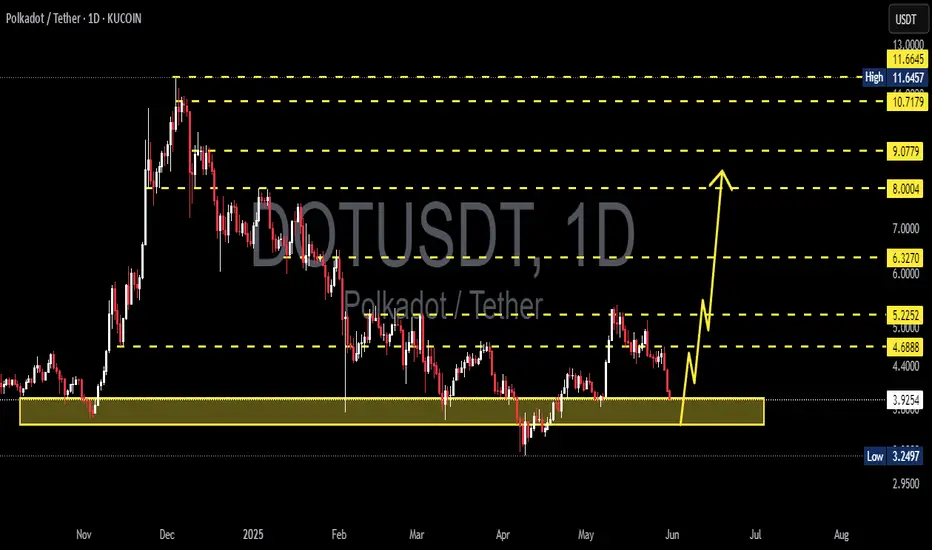
DOT Will Pump 200% Next Few MonthsWe are headed to 12$ - 11$ over this year - Profiting 200%
STOP LOSS : Dailly Close Bellow 3.30$ (-15%)
Low Risq Big WIN!
Not Financial Advice , But I'm in Baby ;)
CRYPTOCAP:DOT BINANCE:DOTUSDT COINBASE:DOTM2025 BYBIT:DOTUSDT.P BYBIT:DOTUSDT COINBASE:DOTUSDT BINANCE:DOTBTC
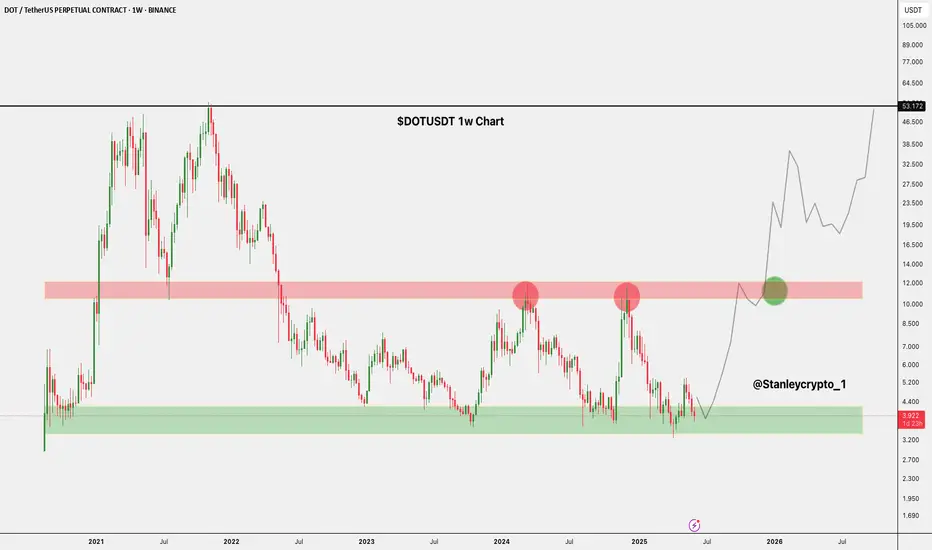
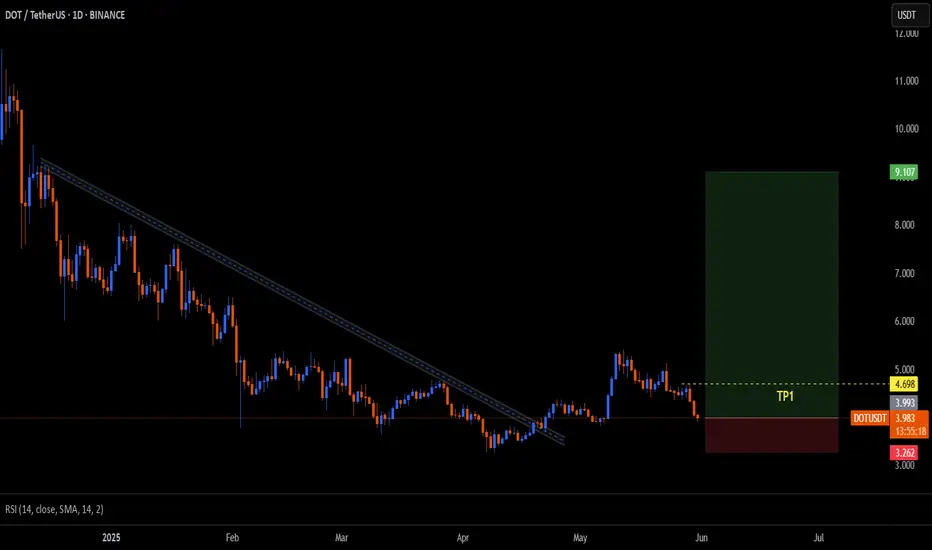
$DOT Setup: Watch This BreakoutCRYPTOCAP:DOT is trading in a clear range between $3.544, $4.022 support and $10.132, $12.564 resistance.
The current pullback to the demand zone hints at potential accumulation.
A breakout above $12.423 could trigger a strong rally toward $23.654, $32.756, $53.172, and higher.
DOT is gearing up for a major move once resistance clears.
DYRO, NFA
DOTUSDT 1W AnalysisDOT ~ 1W Analysis
#DOT Buy back gradually from this support block with a short term target of at least 20%+ from this support.

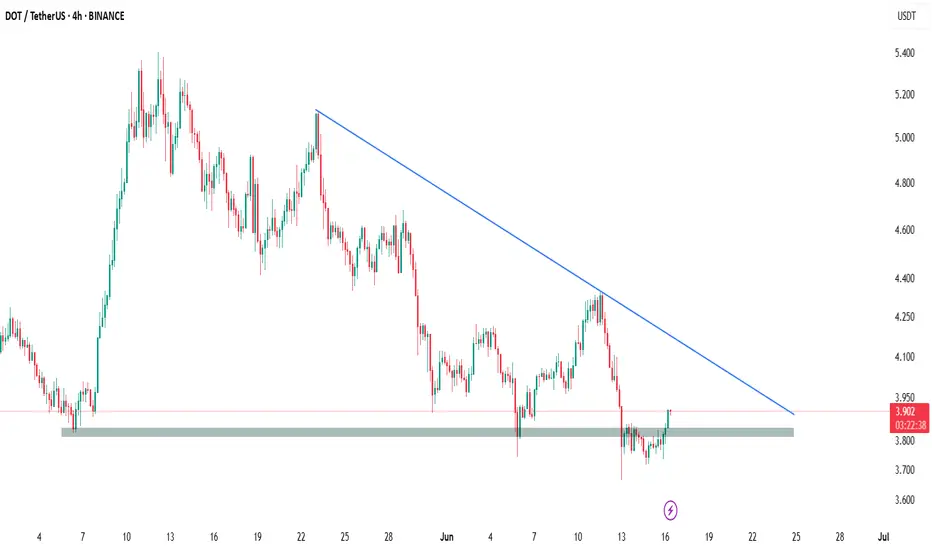
DOT/USDT - Bullish On the 4-hour chart, DOT/USDT has shown a clear bullish rejection from its significant horizontal support zone around $3.80 - $3.85. This strong bounce indicates robust buying interest at this critical level, signaling a potential reversal and a buying opportunity. The price action here underscores the validity of this support, suggesting diminishing selling pressure.
While a descending trendline remains overhead as dynamic resistance, the current rebound sets the stage for a potential challenge to this overhead barrier. A confirmed break above this trendline would further strengthen the bullish outlook. Traders may consider long positions with a prudent stop-loss placed below the $3.80 support to manage risk effectively.
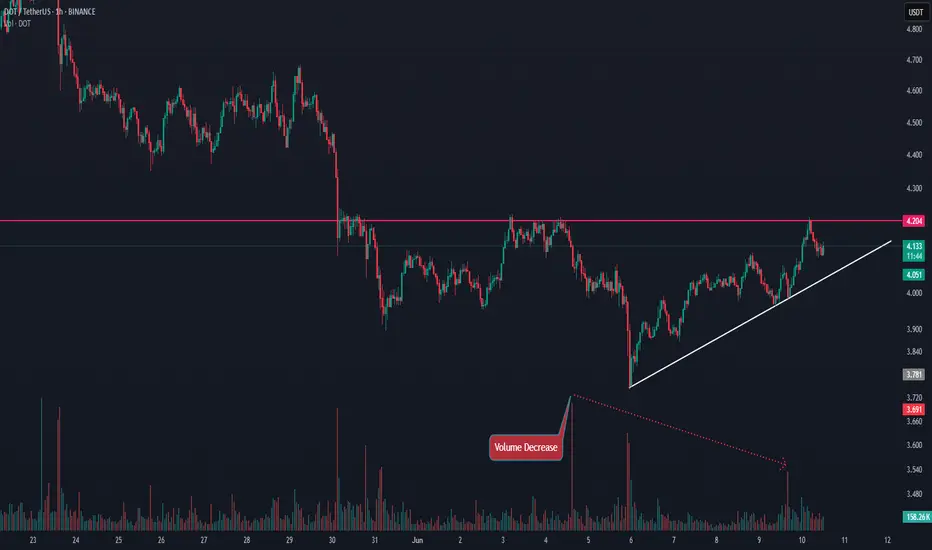
DOTUSDT|1H ANALYSIS🔍 In the 1-hour timeframe, DOT is currently holding above a valid ascending trendline 🔻 which has acted as support multiple times and prevented further downside 🛡️📉
This suggests that buyers are stepping in at lower levels, showing accumulation interest 🧲💰
👁️🗨️ Now, the price is approaching a key resistance zone around 4.204 🚧🔥
This level has previously rejected price action multiple times and is now being tested again! 😤📍
🛎️ Keep an eye on volume, confirmation candles, and beware of fake outs❗🔍
Monitor the chart closely, as market conditions can shift quickly ⏳⚠️
📅 Analysis Date:
📢 Drop your thoughts in the comments – I’d love to hear your outlook on DOT 🤝💬
If you enjoyed this analysis, don’t forget to like and follow for more updates ❤️🙌
#DOT #Polkadot #CryptoAnalysis #TechnicalAnalysis #TradingView #CryptoSignals #TA #Bitcoin #Altcoins
DOT/USDT High win rate scalping signals in 15 minutes (TEST)- Signal: Empty
- Entry: 3.778 ~ 3.782
- Take Profit: 3.761, 3.748
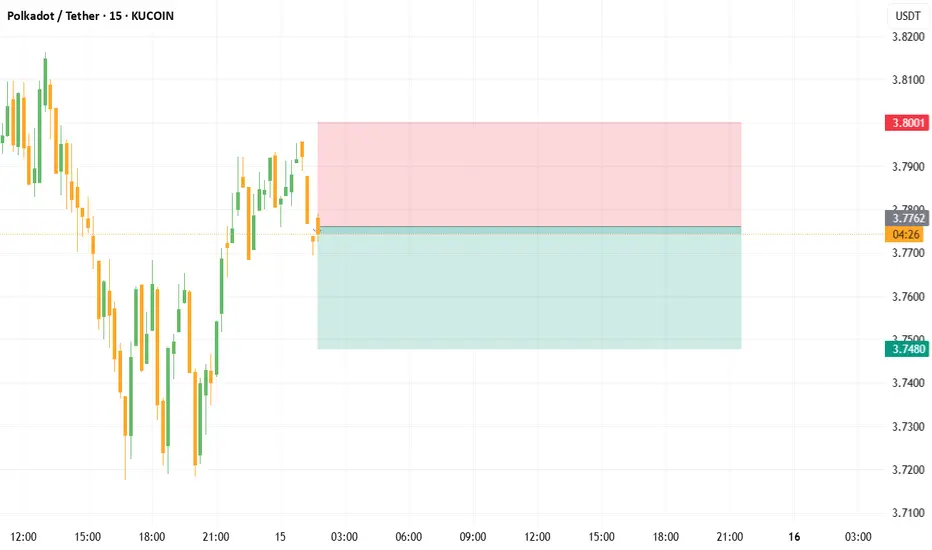
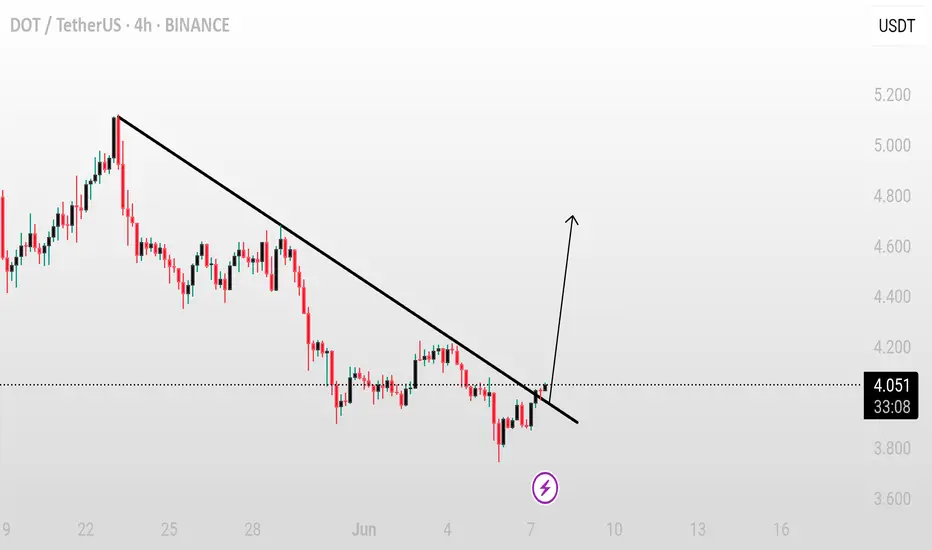
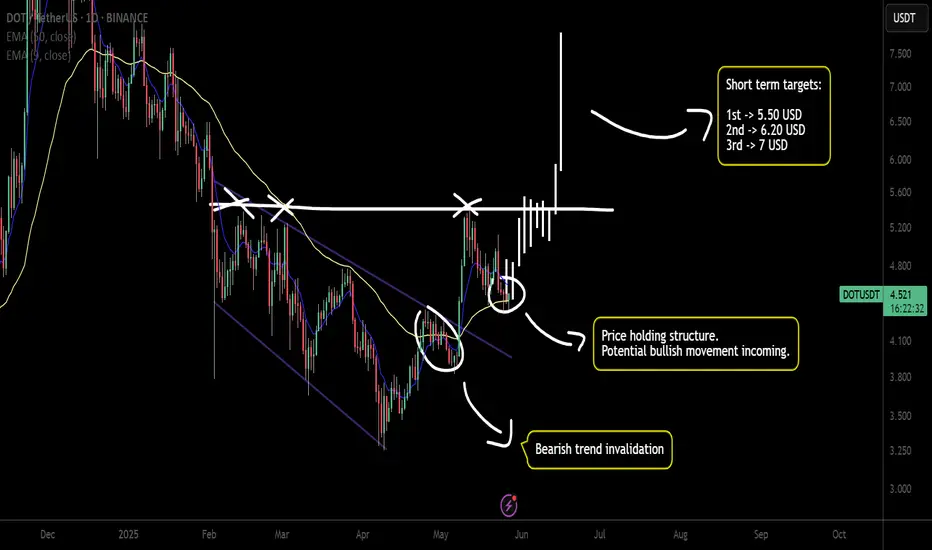
DOT/USDT – Trendline breakout confirmedHere’s a trading idea for DOT/USDT:
---
DOT/USDT – Trendline breakout confirmed
DOT has confirmed a breakout above its descending trendline, signaling a potential shift in momentum. If the price holds above the breakout level, a 10–20% pump could follow in the short term.
Key levels to watch:
– Breakout support zone
– Volume confirmation
– Immediate resistance ahead
Hold above the trendline could lead to further bullish continuation. Keep it on your radar.
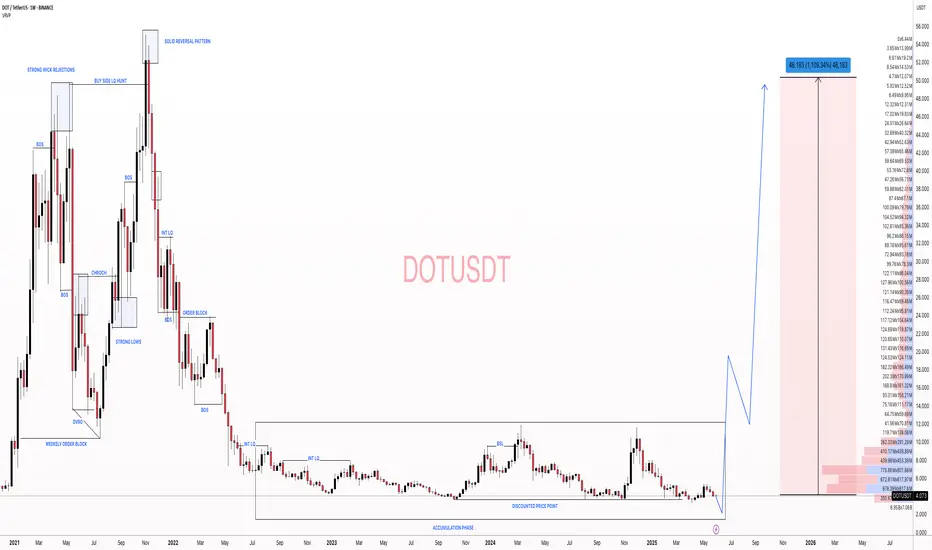
#DOTUSDT: Targeting $50 By End Of The Year! Wait For Volume ? Hey everyone!
So, about DOTUSDT, it’s been trading sideways at $4 lately. However, it has the potential to break through and hit new highs in the coming weeks or months. We’re not sure exactly what will happen next, but once it does, we expect it to start distributing its value. If this happens, we could see it reach our $50 mark by the end of the year.
I know this is just our speculative view, and we can’t rely solely on technical analysis to make this happen. We also need strong fundamental support. But hey, it’s worth a shot, right?
If you like our work, please give it a like and let us know what you think in the comments. We’d love to hear your thoughts!
Wishing you all the best and happy trading! 😊
We really appreciate your unwavering support! ❤️🚀
And if you’d like to lend a hand, here are a few ways you can contribute:
- Give our ideas a like
- Share your thoughts in the comments
- Spread the word about our ideas
Cheers,
Team Setupsfx_
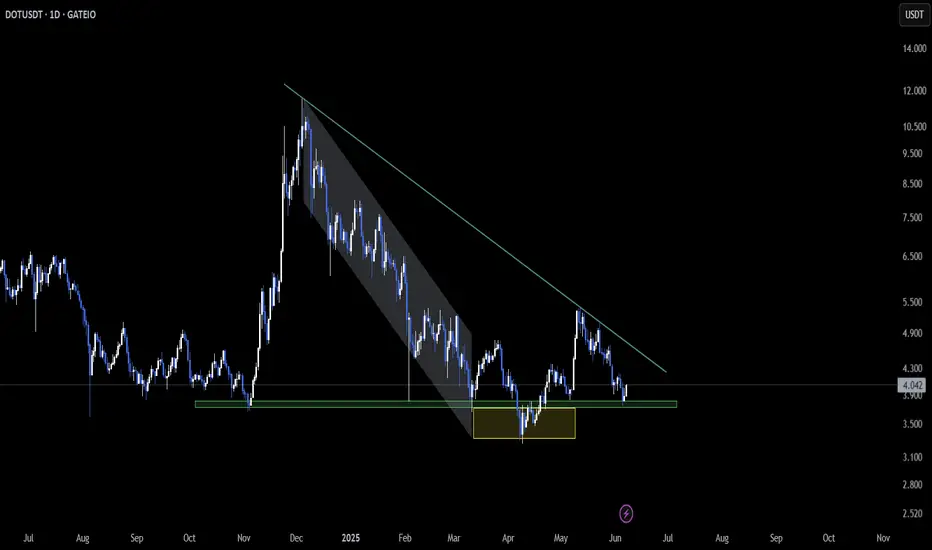
DOT – Descending Triangle Setup & Support ReactionDOT is shaping up within a descending triangle pattern on the daily chart 📉. Price is currently testing the support zone — this level is key for what comes next 🚀. Will DOT gather strength to break out of the triangle, or will sellers keep the pressure on? It’s a critical juncture for this altcoin 👀. Stay tuned for the next move! GATEIO:DOTUSDT
DOT/USDT About to Explode or Crash?Yello Paradisers! Are you ready for DOT's next explosive move, or will you be caught in the trap again? Right now, #DOTUSDT is sitting at a key decision point inside a textbook ascending channel — and what happens next could either print profits or wipe out the unprepared.
💎After respecting both the ascending resistance and support lines with high precision, it has now pulled back into a crucial area of interest: the Fair Value Gap (FVG). If DOT continues to hold above this level, the probability of a bullish continuation increases significantly. The area around $3.90–$3.95 is aligning perfectly with the demand zone, adding to the confluence and giving bulls a strong foundation to build on.
💎However, the real test lies ahead. POLKADOT must clear the immediate resistance around $4.10–$4.30 for the bullish momentum to gain traction. A successful break and retest of the $4.30 level would likely open the doors to a fast move toward the high-value resistance zone at $4.50 and above.
💎But here’s the twist: if DOT fails to defend the demand zone and instead closes below $3.683, the entire bullish setup becomes invalid. Such a breakdown could trigger a deeper correction, targeting the $3.40 region and possibly flushing out the overleveraged players in the process.
Stay focused, Paradisers. Be the hunter, not the hunted
MyCryptoParadise
iFeel the success🌴

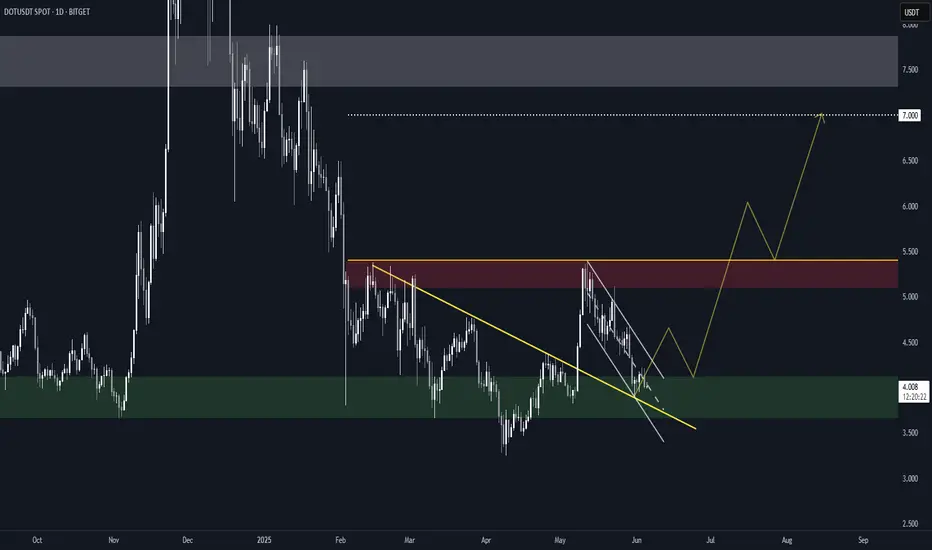
PolkaDot (DOT) Structure Analysis (1D)BITGET:DOTUSDT is showing signs of strength after a deviation below the long-standing $3.70–$4.10 demand zone.
Key Levels
• 🟢 Demand Zone: $3.70–$4.10, respected since October 2023
• 🟡 Broken downtrend resistance, retested as support
• ⚪ Current falling channel (compression) following range high retest
• 🟥 Sell Order Block: $5.10–$5.40
• 🟧 Range Resistance: $5.40
• 🎯 Target on breakout: ~$7.00, potential extension to ~$7.50
Thesis
• The recent breakdown was quickly reclaimed, hinting at a possible spring/fakeout. After retesting the range high, price is now compressing within a descending channel, building energy just above demand.
• A breakout from the channel followed by an S/R flip of the $4.40–$4.60 region could trigger a rally toward the upper range.
Watching for
• Channel breakout with volume
• Clean break above $5.40 to confirm range expansion
Invalidation
• Sustained break below the $3.70–$4.10 demand zone
#DOT/USDT#DOT
The price is moving within a descending channel on the 1-hour frame, adhering well to it, and is heading towards a strong breakout and retest.
We are experiencing a rebound from the lower boundary of the descending channel, which is support at 4.120.
We are experiencing a downtrend on the RSI indicator, which is about to break and retest, supporting the upward trend.
We are heading towards stability above the 100 Moving Average.
Entry price: 4.170
First target: 4.220
Second target: 4.246
Third target: 4.323

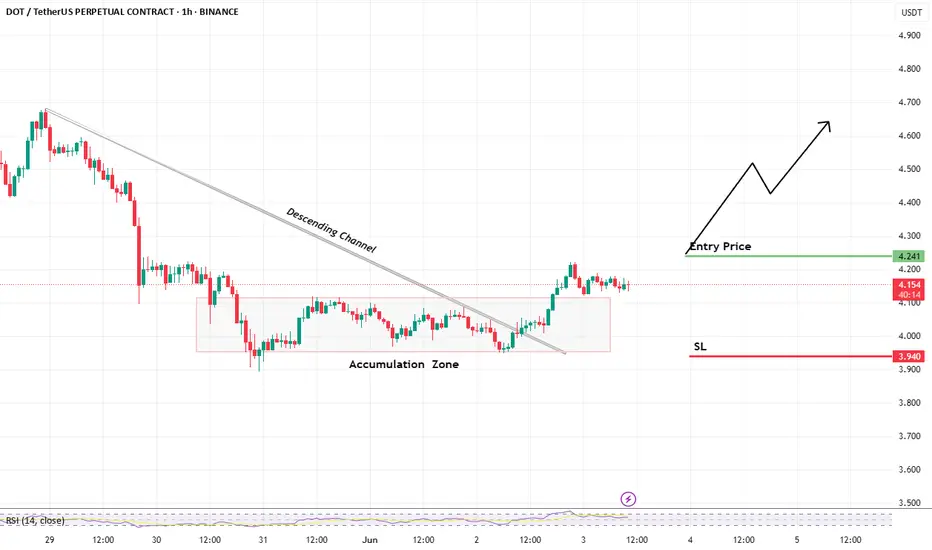
DOT/USDT – 1-HOUR TECHNICAL OUTLOOKKey Observations
Factor : Details
Trend-Shift Signal Breakout above the long-standing Descending Channel and the most recent Lower High.
Accumulation Sideways base fuel for the breakout.
Harmonic Confluence Back-testing shows this zone aligns with a bullish harmonic reversal area on the 1-hour chart, reinforcing the probability of trend change.
Trade Plan
Entry : $4.241 (post-breakout retest)
Stop-Loss: $3.940 (below accumulation floor)
Profits should be booked according to your personal risk appetite and reward targets.
🔒 Risk Management Tip:
"True discipline in trading means waiting for the right setup and respecting your stop loss."
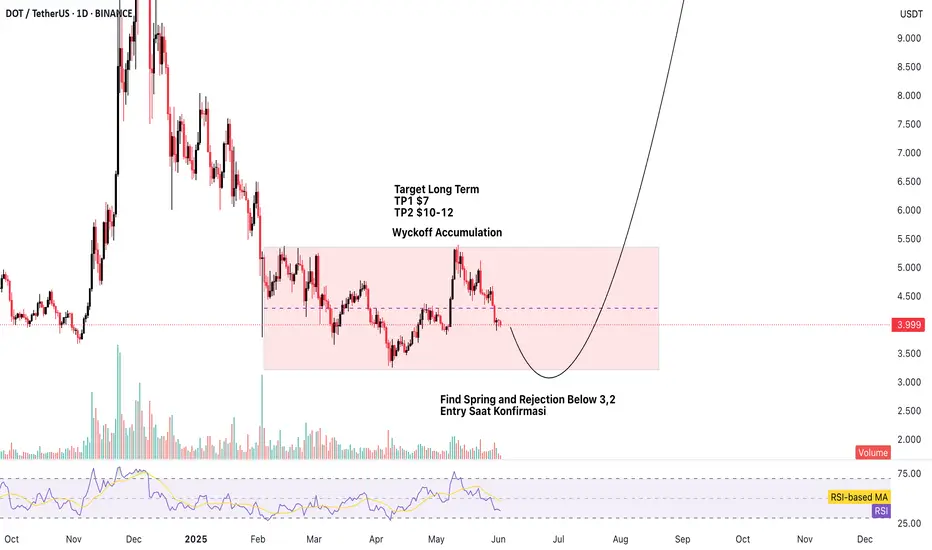
POLKADOT Wyckoff AccumulationHere is my long term and swing trade.
Target 1 7$
Target 2 10-12$
Usually DOT will be aggressive after ETH Rocketting
DOTUSDTThe first higher high after a downtrend indicates a potential trend reversal to the upside. It shows that buyers are starting to regain control, signaling the possibility of a new bullish trend.
Trendline Break: A break above a significant trendline further confirms the shift in sentiment from bearish to bullish. The trendline break signifies that selling pressure has weakened, and the market is poised for further upward movement.
DOTUSDT 1D AnalysisDOT ~ 1D Analysis
#DOT Maybe you can consider this support block to start buying back from here with a short term target of at least 10%+, long term target $11.5
$DOT - Polkadot imminent bullish momentumHey traders!
Hope you are doing GREAT!
On this occasion I've decided to spot on CRYPTOCAP:DOT as its showing a clear bullish momentum ( as other alts). The chart is clear about the movement. There is no need to use fancy indicators neither a complex analysis.
Just price action.
As a brief comment, $Polkadot broke a clear bearish trend with confirmation on the daily timeframe. That's why I'm looking for a speculative trade (just in and out).
What I'm targeting? Prices between 6.00 USD and 7.00 USD in short term could be a nice zone to take profits.
Stay tuned!
4.7 / 1.9 RRDot is in an uptrend, the idea would be to catch the next move up. The higher RR is likely to miss the entry--and if entry is filled not reach the indicated target but something more local. The lower RR entry (higher price) is not as rewarding however. Of course you may use local breakout etc entry techniques.

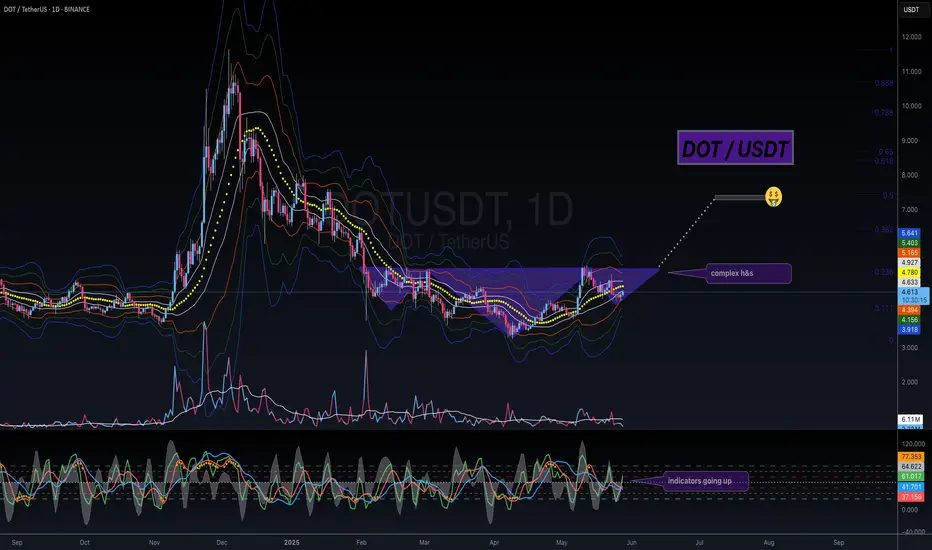
DOT / USDT - Complex H & SMorning fellow traders,
Looking into this market lately, and after the previous short term uptrend the coins have been consolidating a little bit. When looking at DOT / USDT pair we can see something like a cup & handle easier that's starting to develop a handle, but I believe it's a complex head & shoulders.
Take a look at it, I think that before any major move down, creating a possible spring, we could see another move to the upside.
Trade thirsty, my friends.