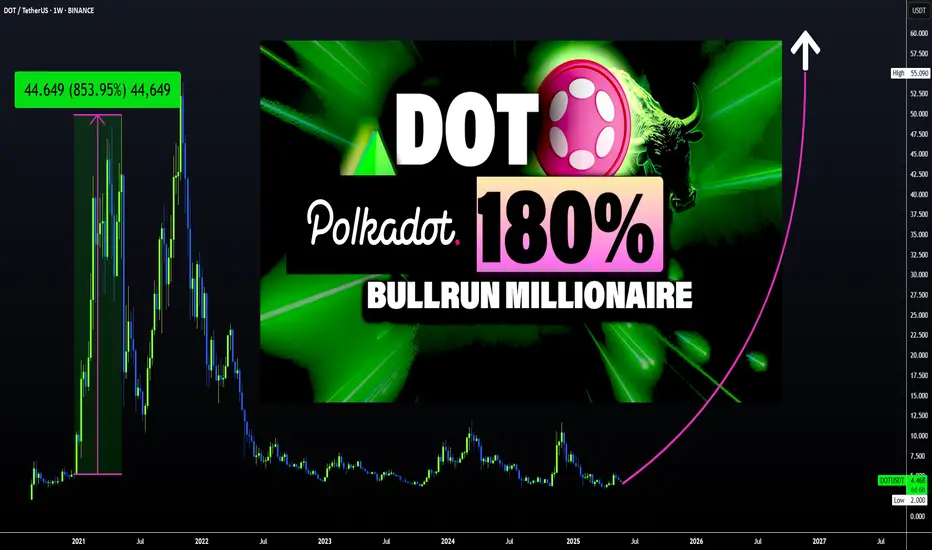
DOT has HUGE UPSIDE Potential | PolkadotPolkadot could be a late bloomer this season, but there's still much room for growth on this altcoin.
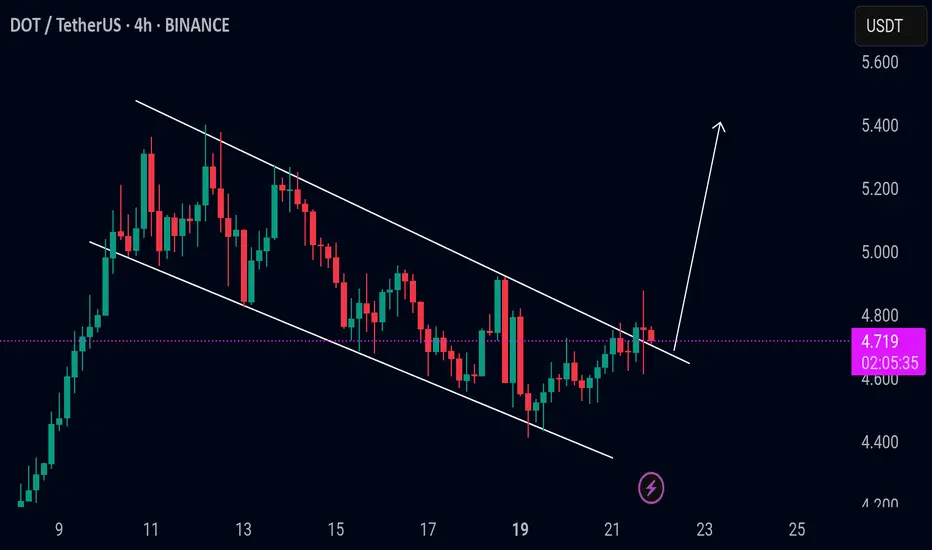
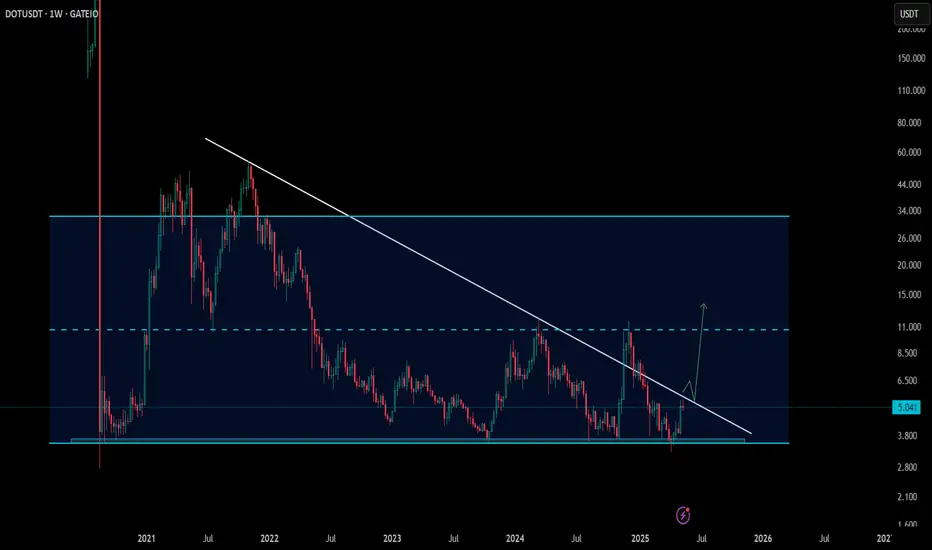
Taking a look at DOT from a macro timeframe, we clearly see the bearish cycle after the ATH, and then a bottom out when we start to see the price making higher lows.
This undoubtedly shows us that Polkadot IS CURRENTLY bullish - even though we're not seeing the big increases just yet. After a retest here in the pointed out area, it's likely DOT can run. DOT and other alts will likely retrace as ETH gears up and starts increasing, before they get their turn to run:
It should be noted that DOT is trading over 1000% away from its previous ATH. And even though that may be a stretch, I'd be happy with a 100%!
Don't miss the SOLANA update with a trade setup 🎁 :
____________________
BINANCE:DOTUSDT
DOTUSDT.P trade ideas
Polkadot Eyes $5.38 – Is a 17% Rally on the Horizon?As of May 26, 2025, DOT/USDT is showing signs of a potential bullish reversal on the 4-hour chart, forming a strong setup for upward movement. Key technical levels and chart structures support this bullish outlook.
1. Strong Support Zone
• Zone: $4.30 – $4.37
• This area has acted as a major support, where buyers previously stepped in, leading to strong upward moves. Currently, the price has rebounded from this support zone, suggesting renewed bullish pressure.
• A bounce from this zone with increasing volume confirms the strength of this level and validates it as a demand zone.
2. Bullish Entry Setup
• The entry appears to be positioned slightly above the support zone, near $4.60.
• The risk-to-reward ratio is favorable (~2.7), indicating a well-placed setup for swing traders.
• A small stop-loss (~6.36%) below the support at $4.30 protects against a false breakdown.
3. Key Resistance and Target Levels
• TP1 / Recent Resistance: $4.93
This level marks a recent swing high and minor resistance. A breakout above this would confirm short-term bullish continuation.
• TP2 / Major Resistance: $5.38
This is the major resistance level and final take-profit zone. It aligns with a previous market top, and its breach could lead to further bullish continuation into a higher timeframe breakout.
4. Projected Path and Price Action
• The chart outlines a bullish projection path, anticipating higher lows and higher highs forming a stair-step rally.
• This dotted path suggests a bullish trend structure with gradual momentum buildup.
• Buyers may continue pushing the price upward through TP1 toward TP2 in the coming sessions, especially if macro conditions or Bitcoin price action remain favorable.
5. Market Structure & Candlestick Behavior
• The market recently transitioned from a short-term downtrend into a consolidation phase.
• Bullish candlestick formations around the support zone imply accumulation.
• The recent bullish engulfing near the support further confirms buyer dominance and a potential trend reversal.
6. Risk Management and Outlook
• Stop-Loss: Below $4.30 to manage downside risk.
• Target Zones: $4.93 (TP1), $5.38 (TP2).
• A break below $4.30 would invalidate the bullish thesis and suggest caution.
• As long as DOT remains above the $4.37 zone, the bullish scenario remains intact.
Conclusion
DOT/USDT is currently in a bullish setup on the 4-hour chart with a high-probability reversal from the support zone. Traders may look for confirmation candles and volume support to enter long positions with TP1 at $4.93 and TP2 at $5.38. Risk remains contained below the $4.30 level.

Polkadot (DOT): Seeing Good Shorting EntryPolkadot is showing a decent entry forming where price has been pressuring the upper side of the bullish trend and even formed a nice fakeout above it.
We are looking for further weakness to kick in where price will fall back to bullish trends support line from where we might be heading toward the resistance zone. After that we will be looking for bigger downward movement.
Swallow Academy

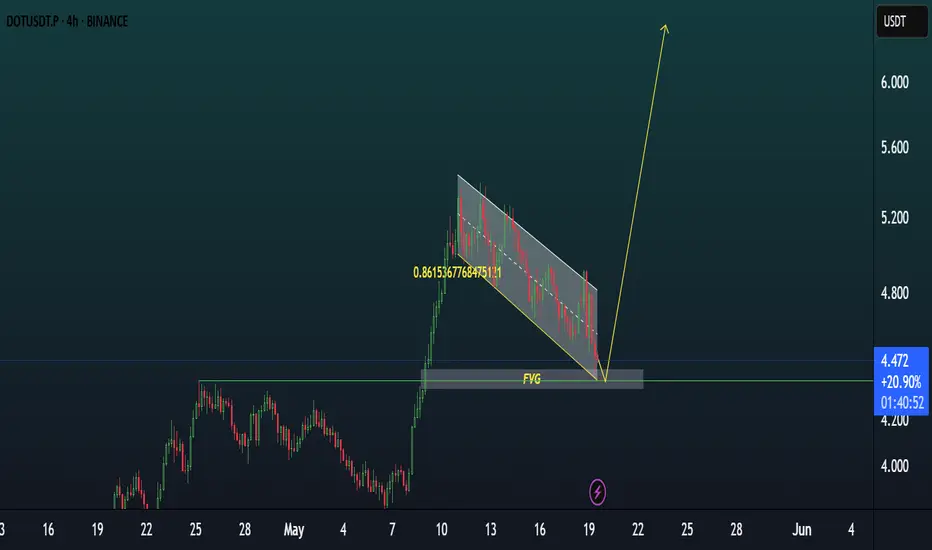
DOTUSDT Long IdeaPolkadot appears poised for a potential move, having taken liquidity and expanded impulsively. The recent fill of the fair value gap (FVG) at the consequent encroachment level, coupled with holding above the order block, suggests a bullish outlook. Continued accumulation at these levels could potentially lead to higher targets in the coming weeks.
Please note, this is not financial advice; manage your risk accordingly.

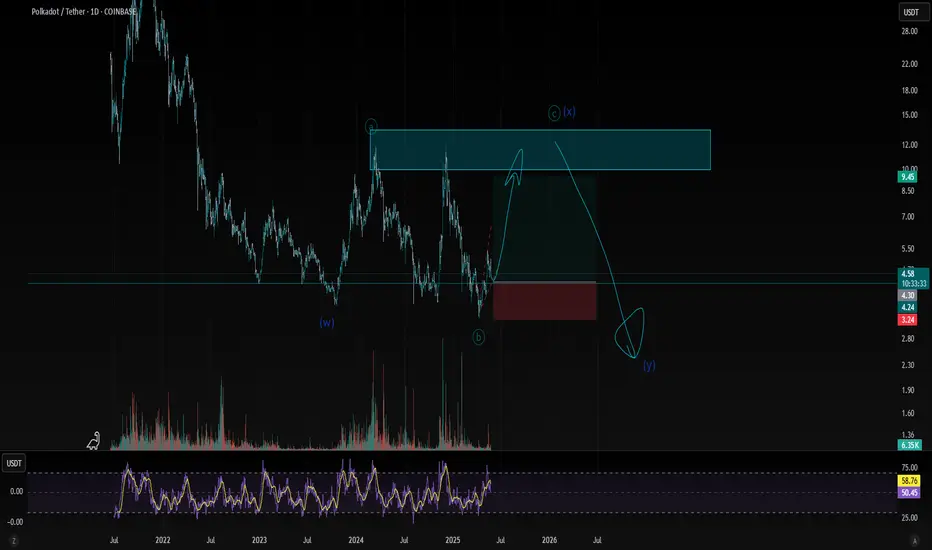
DOT/USDT: Elliott Wave Setup - Potential Rally to $9.60-$13.60Polkadot (DOT) Daily Elliott Wave Long Setup: Targeting Key Resistance
Polkadot (DOT) | Timeframe: 1 Day (1D) | Exchange: Coinbase
Current Price (approx.): $4.60 - $4.80 (as of May 24, 2025)
Market Cap (approx.): $7.3 Billion USD
Analysis:
Based on my Elliott Wave analysis on the 1-day timeframe, DOT appears to be positioning for the next significant leg up within its broader structure.
Trade Setup:
Trade Type: Long
Entry Zone: $3.80 - $4.80
Expected Target Range: $9.60 - $13.60
Invalidation / Stop-Loss: $3.23 (Crucial level for the Elliott Wave count)
Rationale (briefly):
This setup anticipates a strong bullish move for DOT, supported by the specific Elliott Wave count and the defined invalidation point. The entry zone aligns with current price action, offering a potential re-accumulation area before the projected rally.
Your Elliott Wave count (labeling the waves you are trading).
The entry zone ($3.80 - $4.80).
The target range ($9.60 - $13.60).
The invalidation level ($3.23).
Any supporting technical observations (e.g., trendlines, support/resistance, indicators) that led to this setup.
Risk Management:
Always implement proper risk management. This trade idea has a clear invalidation point at $3.23. A break below this level would negate the bullish Elliott Wave count and necessitate exiting the position.
Disclaimer: This is not financial advice. Elliott Wave Theory is subjective and can be interpreted differently. Always conduct your own research and manage your risk. Cryptocurrency trading is highly volatile and carries significant risk of loss.

Polkadot (DOT): 3 Trading Setups We Are Looking For The Most Sellers are slowly overtaking the current zone near the 100EMA, where we might go and grab the bearish CME gap. We have detected 3 possible trades that we can take so let's wait for confirmations!
More in-depth info is in the video—enjoy!
Swallow Team

Polkadot (DOT): Similarity Can Be Seen, Another Smaller Drop?Since the last time when we noticed this movement and similarity, price has formed the first drop and smaller recovery, where now we are looking for the second drop to happen on the coin.
Nothing much, just a smaller movement but still a good place to take a trade!
Swallow Team

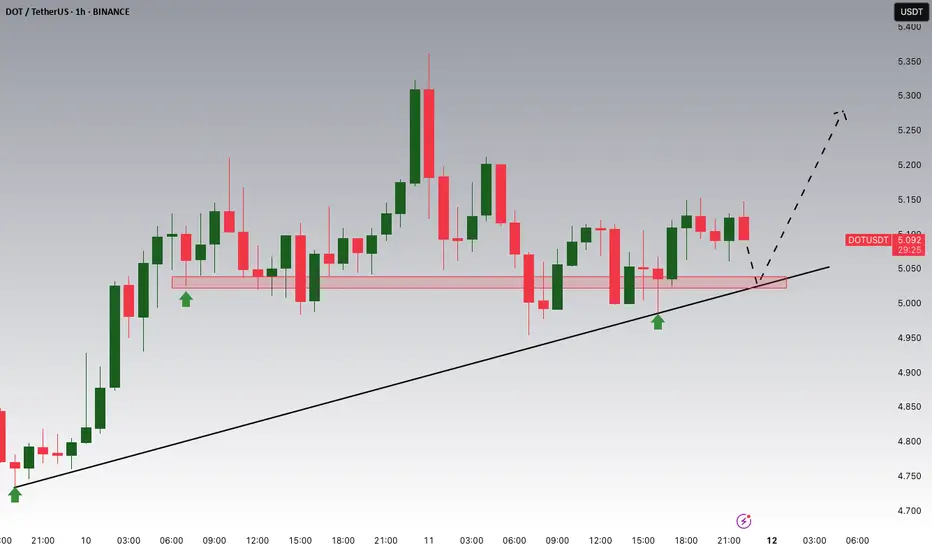
DOTUSDT , 1HrPattern is looking Good , If BTC is Sustaining Above 1,06,834 this level then , This DOT pattern will Give a Good Breakout ,
Enter only When Upper Trendline is Breakout
Take Your Own Risk According to your Capital .
Follow for More Ideas Like This
DOT Testing Bull Flag – Breakout or Retest Incoming?🔥 CRYPTOCAP:DOT – Bull Flag Watch (4H TF)
On the 4-hour timeframe, DOT is attempting to break out of a bull flag — a pattern that often signals continuation if confirmed 📊
📈 A breakout with strong volume and close could push DOT toward its previous highs and beyond 🚀
📉 But if momentum fades, a retest of the midline or lower boundary may follow.
⚠️ The next few candles are critical — stay sharp and watch closely!

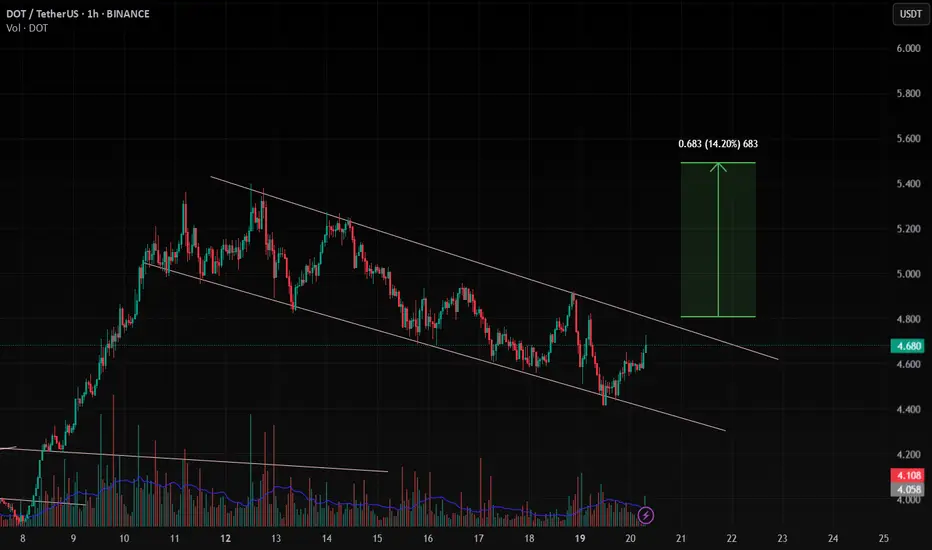
DOT/USDT breakout alertDOT/USDT breakout alert
DOT has broken out of the bull flag pattern and is currently showing bullish momentum. The bull flag is a continuation pattern, and this breakout suggests the potential for further upward movement if the breakout holds with strong volume.
However, if the price falls back into the flag channel, it could be a fakeout, so it's important to monitor closely.
Key levels to watch:
* Breakout confirmation zone
* Flag support area
* Volume strength for confirmation
Keep an eye on DOT — a confirmed move above the flag could trigger the next leg up.
DOTUSDT Potential UpsidesHey Traders, in today's trading session we are monitoring DOTUSDT for a buying opportunity around 4.20 zone, DOTUSDT is trading in an uptrend and currently is in a correction phase in which it is approaching the trend at 4.20 support and resistance area.
Trade safe, Joe.

Polkadot (DOT/USDT) Ready to Explode? Full Technical Breakdown Hello everyone!
In today’s idea, I’ll be breaking down the technical analysis of BINANCE:DOTUSDT . I hope you find this analysis valuable and insightful for your trading decisions.
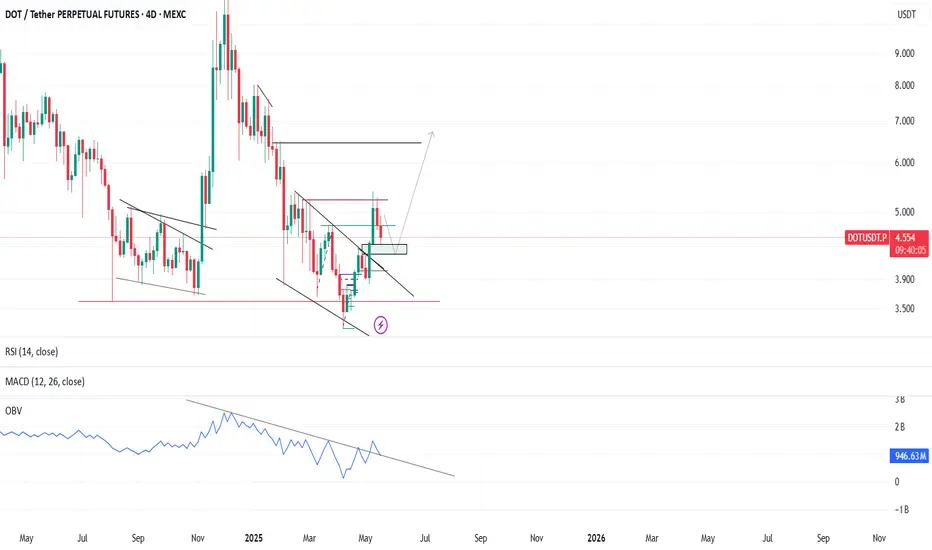
On weekly TF
- There was a huge liquidity sweep on the bottom of 4 AUG 2024 on APRIL 2025
- As shown in the chart above, the MACD has started to cross bullishly on 1W timeframe. The last time this occurred, DOT rallied by approximately 200%.
- Two weekly candles have closed above the previous high that led to the last bottom (around $4.772), signaling a market structure shift from bearish to bullish.
On 4D TF
- On the OBV , a downtrend line was broken, and a retest is currently in progress.
- There is a very important Fair Value Gap (FVG) being retested right now.
- Note: The 4D candle closes today. Monitor closely to see if it closes above the FVG — respect the FVG.
- A good potential entry zone is between $4.44 – $4.241.
In conclusion, DOT/USDT is showing promising bullish signals across higher timeframes, with a potential entry zone between $4.44 – $4.241. As always, manage your risk and wait for confirmation before entering. I’ll be watching the 4D close closely — stay sharp!
DOT: Possible support and targetsHi,
As always, this is just for fun. To hit play on the future and see how correct or wrong I was :)
My strategy is to buy low (and keep buying if it gets lower) and sell high (in fractions) on the way up when hitting important areas. There is no more magic or secrets.

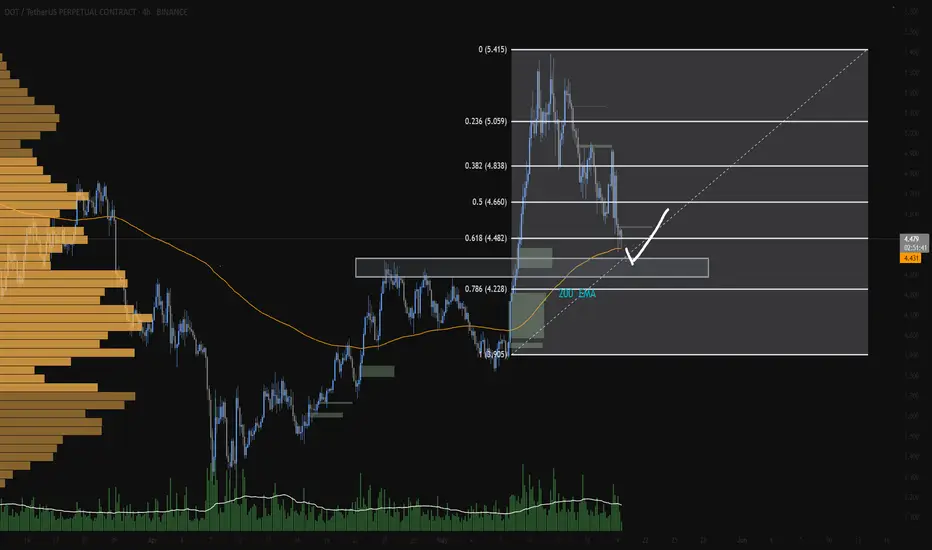
DOT/USDT Swing Long Setup | 4H Chart AnalysisDOT has retraced into a multi-layered support zone that presents a high-probability long opportunity:
Golden Pocket: Price is reacting near the 0.618–0.786 Fib retracement from the latest impulse
200 EMA (Dynamic Support): Clearly acting as a trend defender and bounce area
Previous structure flip zone: Former resistance around $4.25 is now tested as potential support
Volume Profile: Strong participation and activity around the current zone
Current price is showing signs of buyer interest with long lower wicks and has yet to break below key EMAs or structural levels, keeping the bullish thesis valid.
Trade Plan:
Entry Zone: $4.25–$4.35
Stop Loss: Below $4.10 (structure + Fib zone invalidation)
Target 1: $4.66 (Fib 0.5 + local resistance)
Target 2: $4.95–5.05 (Fib 0.236 + prior high region)
RR Ratio: ~1:2+ depending on entry
A clean breakdown below $4.10 with strong bearish volume would invalidate the long setup and potentially signal deeper retracement.
Like & follow if this setup adds value to your trade planning
#DOT #Crypto #SwingTrade #TechnicalAnalysis #Altcoins #USDT #TradingView #Fibonacci #200EMA #BullishSetup #MarketStructure
DOT MASSIVE PUMP LOADINGDOTUSDT did bullish BOS and now its retesting it and also trying to fill internal liquidity FVG. i will buy here as a swing trade.
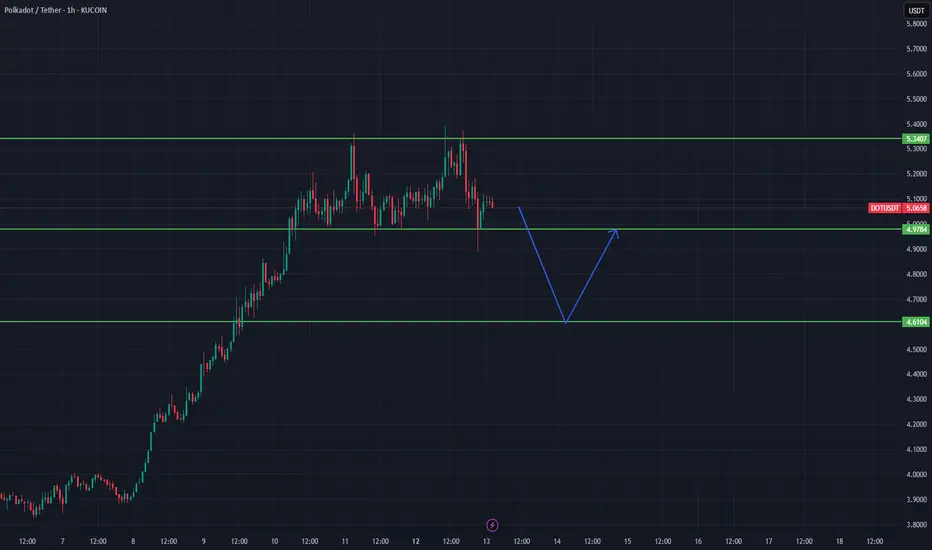
dot 1hThere is a double top image in many coins. Polkadot may also close below 4.95 and bring 4.61 levels.
DOT Breakout Setup – Major Resistance Test Ahead🚨 DOT – Key Breakout Levels in Focus
🗓️ Daily Chart: DOT has broken out of an ascending channel and completed a clean retest—momentum looks solid. 🔥
📉 Weekly Chart: Price is now approaching the trendline resistance of a descending triangle—this is a crucial level.
👀 Watch closely—if DOT breaks through, it could spark a much bigger move!
DOTUSDT Potential UpsidesHey Traders, in today's trading session we are monitoring DOTUSDT for a buying opportunity around 5.030 zone, DOTUSDT is trading in an uptrend and currenty is in a correction phase in which it is approaching the trend at 5.030 support and resistance area.
Trade safe, Joe.
DOT - Yippie's Cup & Handle DelightHiya!
Check out this treat! & don' miss out on it! :D
Yippiekiaye says cheers!
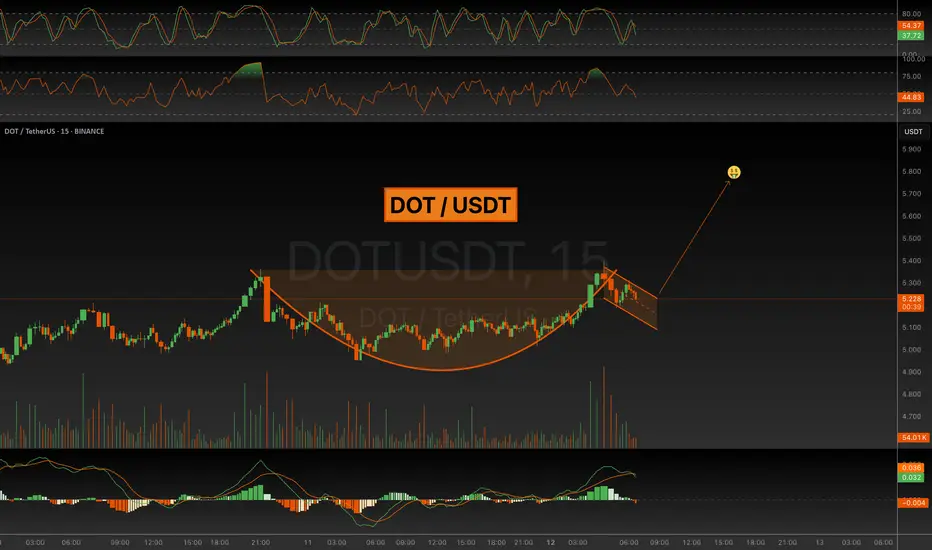
Polkadot (DOT): Should Jump By 120% | Might Jump By 1000%Polkadot has finally reached the 200EMA mark and might be off to a bright start here. The pattern seems to repeat, and we are starting to enter the bull market so eyes wide open now!
More in-depth info is in the video—enjoy!
Swallow Team

PolkaDot DOT Let's Wait Agains The CrowdHello, Skyrexians!
As I mentioned in the recent BINANCE:DOTUSDT analysis the bounce to approximately $6 was predictable and very likely. Now it's happening. Green candles caused a lot of greed again, yesterday I checked the sentiment sharing some bearish minds in Tradingview and got a lot of negative. What's a pity, but the market again is not ready for altseason.
In this case we have now the following scenario. Recent divergence on Awesome Oscillator was just the wave 5 in 3 finish, now we have wave 4 which can be finished inside the $5.2-6.4 area. Then I expect wave 5 which has the target inside $2-3 in the best case. About the worst scenario I don't want even to talk now. Bear market is not over for alts, don't be greedy.
Best regards,
Skyrexio Team
___________________________________________________________
Please, boost this article and subscribe our page if you like analysis!

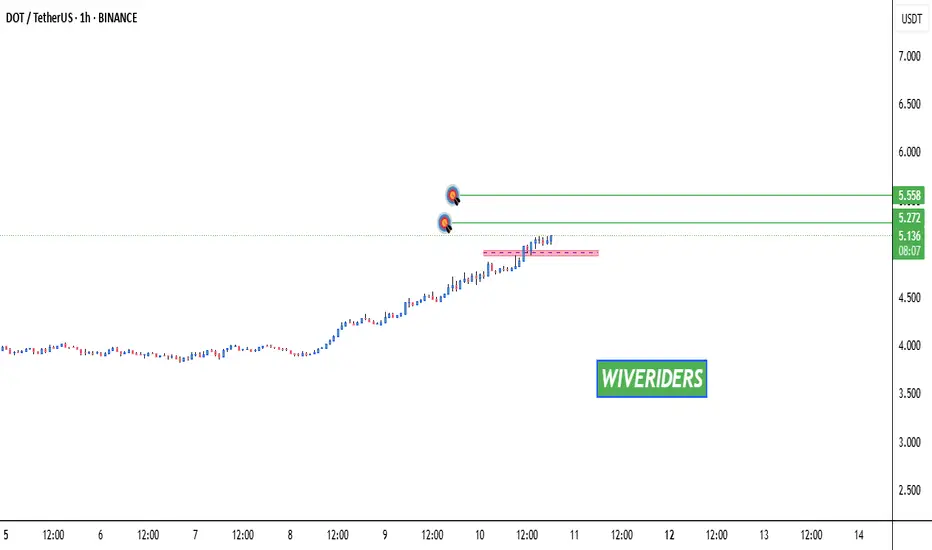
DOT Breakout from Red Resistance – Target Ahead!🚀 CRYPTOCAP:DOT Breakout from Red Resistance – Target Ahead! 📈
CRYPTOCAP:DOT has broken out of the red resistance zone! 📊 The target could be the green line level as the price continues to rise! 🔥
Let’s catch this breakout together! 💼💸