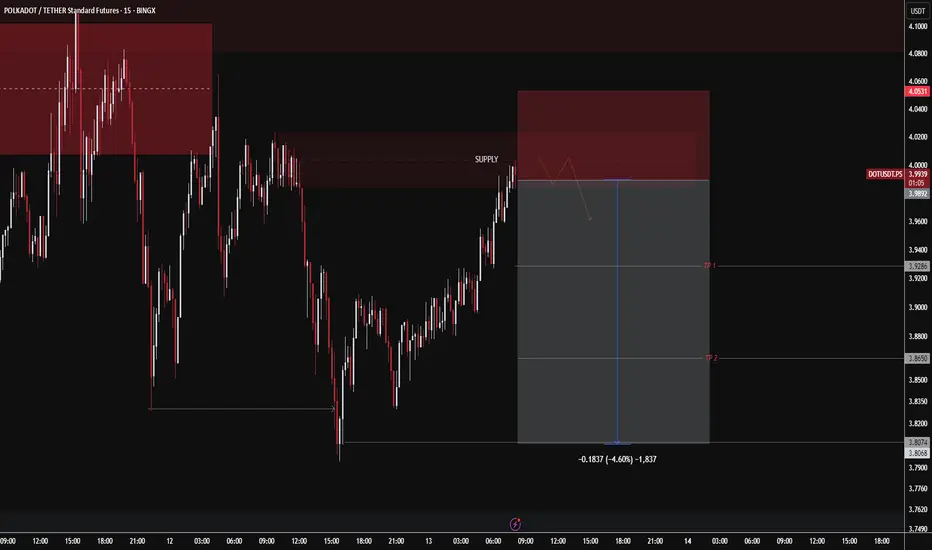
$DOT short positioning CRYPTOCAP:DOT 💰
u Can short now Sl And Tp see in chart .
I just see he break stucture low low
Related pairs
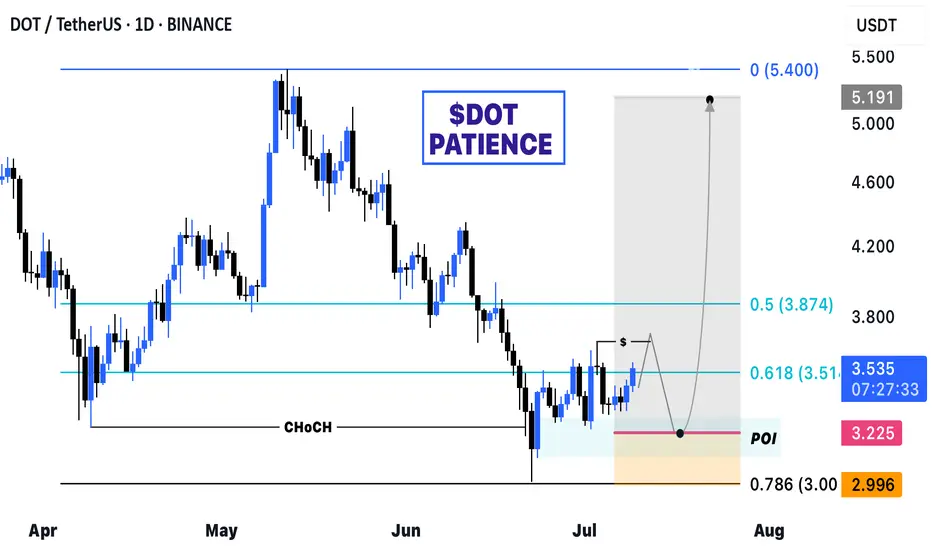
UPDATE ON $DOTUpdate on CRYPTOCAP:DOT
Patiently wait for a pullback, there are some liquidity uncleared below, which aligns with our entry.
Patience is key.
Remember to Like, Comment and Share the post.
#DOT #POKADOT #BITCOIN
Polkadot DOT price analysisAt night, only CRYPTOCAP:BTC impressively updated its ATH, while the rest of the altcoins... haven't really woken up yet after many months, if not years, of hibernation.
For example, if memory serves, in 2020, CRYPTOCAP:DOT was buying at $1.7-1.9 during the presale (please correct me in the com
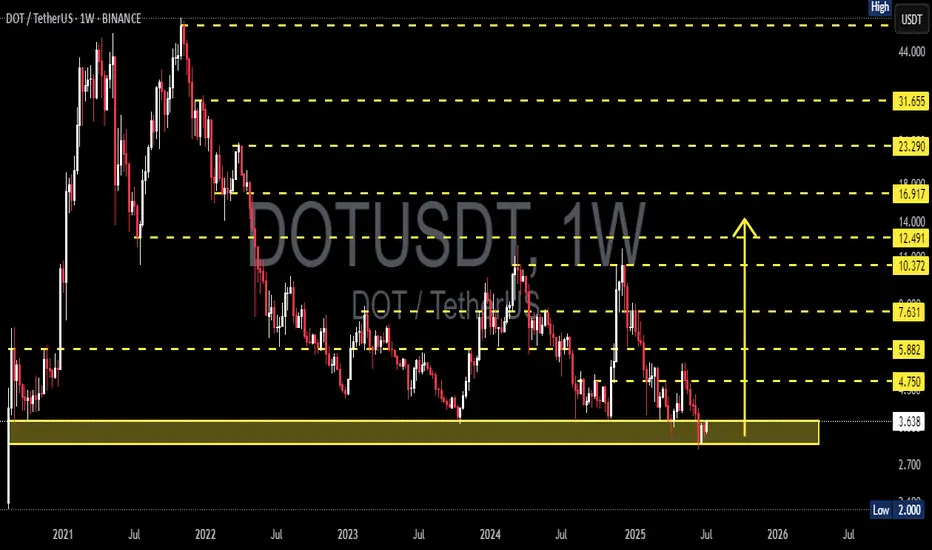
DOT/USDT Weekly Accumulation or Annihilation?📌 Overview & Market Context
Polkadot (DOT) is currently testing one of the most critical technical zones in its price history. Price action is revisiting a multi-year demand zone between $2.70 and $3.60, which has previously served as the springboard for explosive upward moves — including the 2021
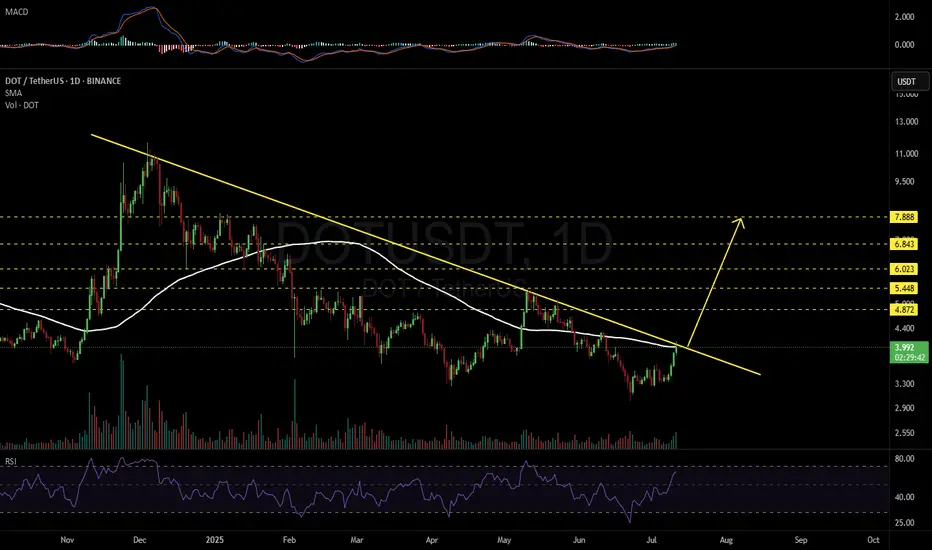
DOTUSDT 1D#DOT is testing the descending resistance and the SMA100 on the daily chart. In case of a solid breakout with strong volume, the following targets are on the table:
🎯 $4.872
🎯 $5.448
🎯 $6.023
🎯 $6.843
🎯 $7.888
⚠️ As always, use a tight stop-loss and apply proper risk management.
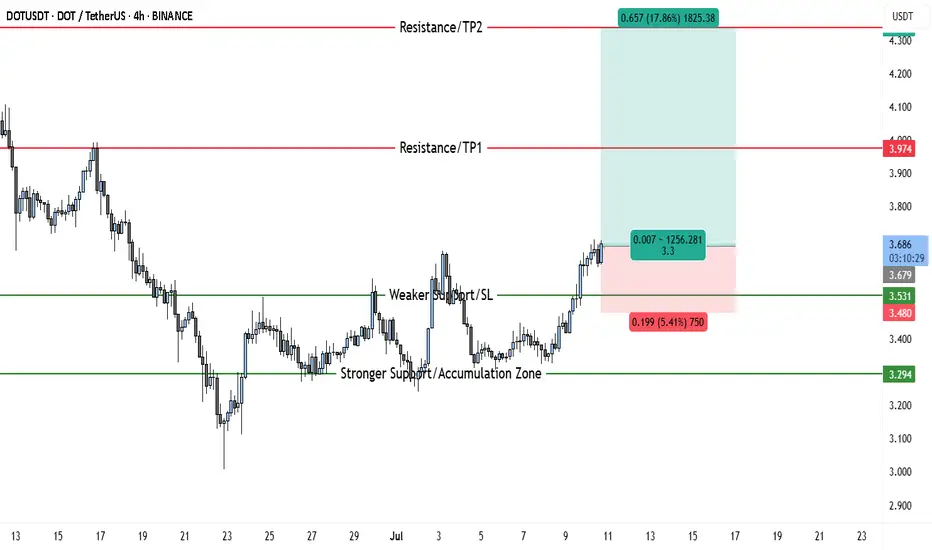
$3.48 Is the Line in the Sand—If DOT Holds, Next Stop $4.35DOT/USDT has shifted from a persistent downtrend into an early-stage recovery after forming a clear base near the stronger support area at $3.294. This accumulation zone attracted steady buying interest, eventually fueling a breakout past the previous resistance near $3.531, which has now become a s
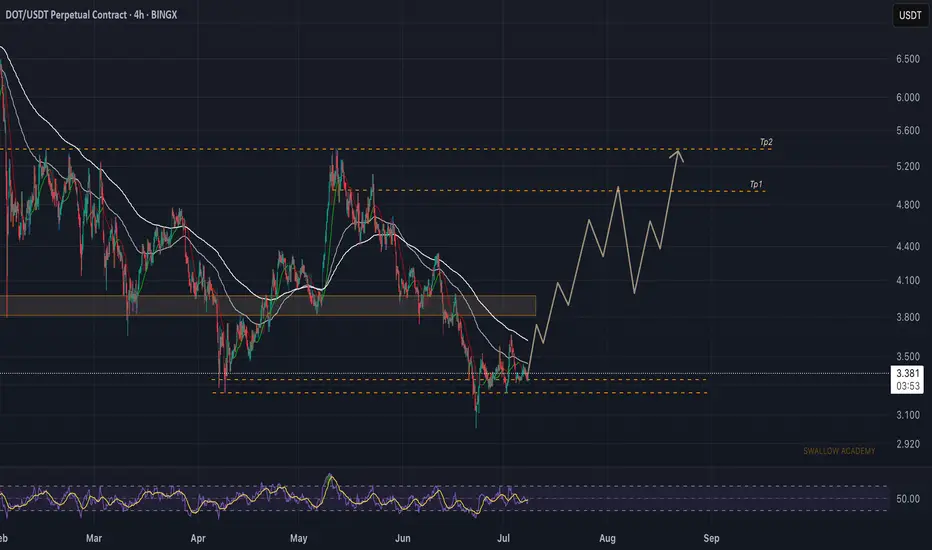
Polkadot (DOT): Might Be Best Buy Entry, Might Be Not...Well, DOT is building up something here, where the price is at the local support zone, which has been holding the price pretty well.
SInce we touched that zone we have been also forming a smaller bullish trend which might result in an explosive movement towards the upper target zones (which would
dotusdtThe DOT currency is in a very old daily demand zone and may start an upward move from these areas (this is just a personal opinion) Good luck
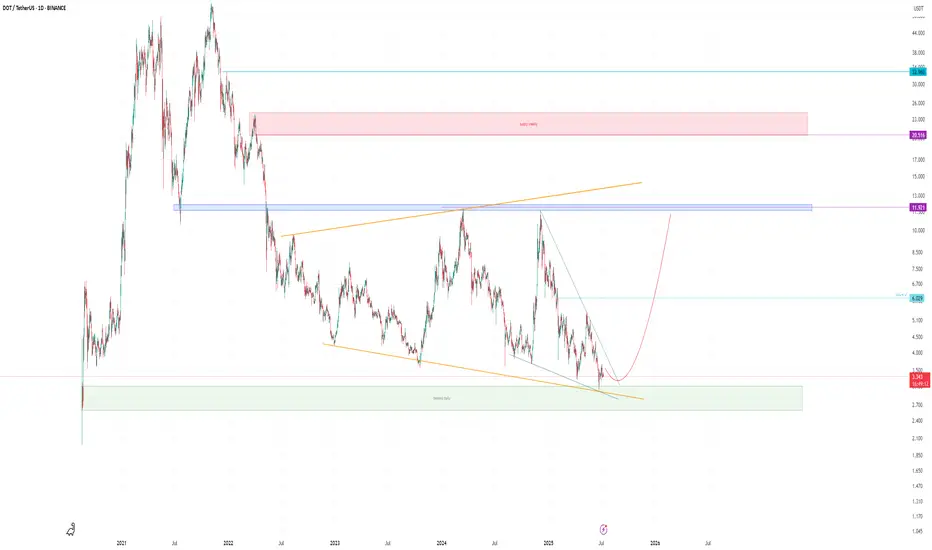
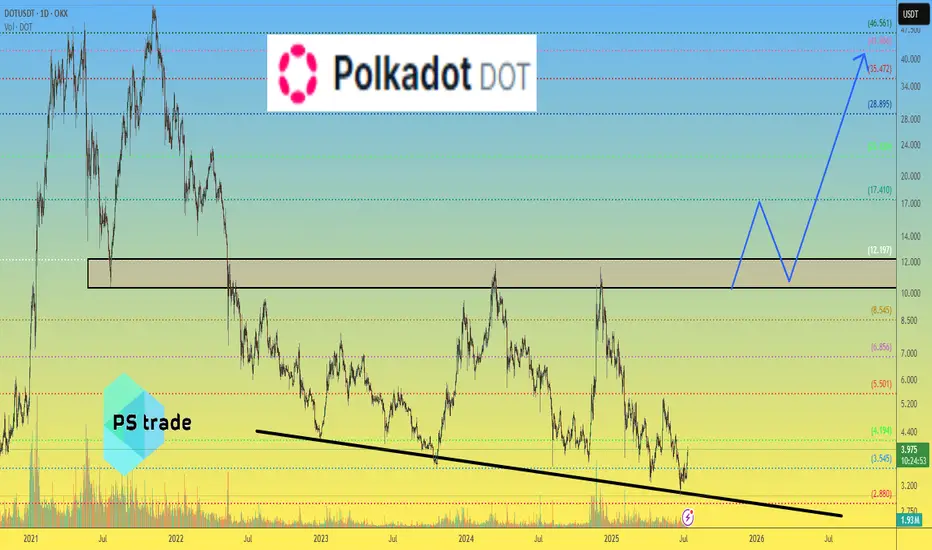
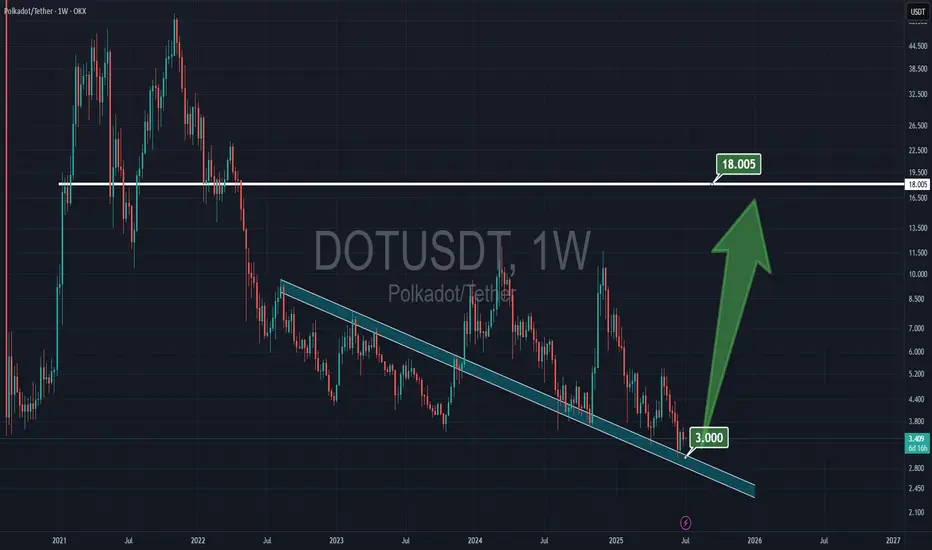
POLKADOT on last supportI think $3 is the very strong support for DOT, and the blue zone will hold, and i believe $18 resistance is very reachable for the next few months after $10 resistance got broken.
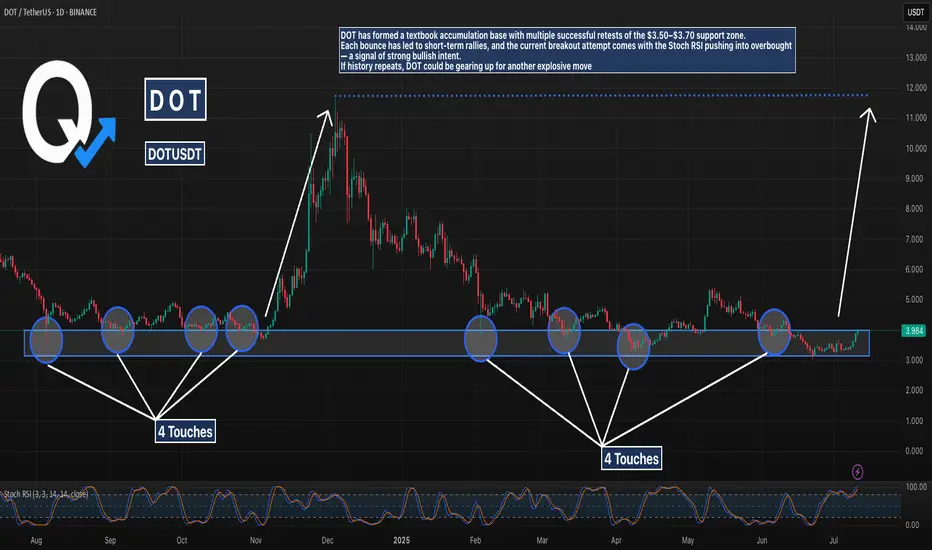
DOT’s Accumulation Zone Holding — History Rhymes?Polkadot (DOT) has respected the same support range for nearly a year, forming a long-term base around $3.50–$3.70. Previous bounces from this level have resulted in aggressive upside moves. With Stoch RSI now pointing up again and price pushing higher, DOT may be gearing up for another breakout att
See all ideas
Summarizing what the indicators are suggesting.
Oscillators
Neutral
SellBuy
Strong sellStrong buy
Strong sellSellNeutralBuyStrong buy
Oscillators
Neutral
SellBuy
Strong sellStrong buy
Strong sellSellNeutralBuyStrong buy
Summary
Neutral
SellBuy
Strong sellStrong buy
Strong sellSellNeutralBuyStrong buy
Summary
Neutral
SellBuy
Strong sellStrong buy
Strong sellSellNeutralBuyStrong buy
Summary
Neutral
SellBuy
Strong sellStrong buy
Strong sellSellNeutralBuyStrong buy
Moving Averages
Neutral
SellBuy
Strong sellStrong buy
Strong sellSellNeutralBuyStrong buy
Moving Averages
Neutral
SellBuy
Strong sellStrong buy
Strong sellSellNeutralBuyStrong buy
Displays a symbol's price movements over previous years to identify recurring trends.
Frequently Asked Questions
The current price of DOT / TetherUS (DOT) is 3.934 USDT — it has fallen −0.05% in the past 24 hours. Try placing this info into the context by checking out what coins are also gaining and losing at the moment and seeing DOT price chart.
DOT / TetherUS price has risen by 17.32% over the last week, its month performance shows a 3.78% increase, and as for the last year, DOT / TetherUS has decreased by −36.88%. See more dynamics on DOT price chart.
Keep track of coins' changes with our Crypto Coins Heatmap.
Keep track of coins' changes with our Crypto Coins Heatmap.
DOT / TetherUS (DOT) reached its highest price on Nov 4, 2021 — it amounted to 55.090 USDT. Find more insights on the DOT price chart.
See the list of crypto gainers and choose what best fits your strategy.
See the list of crypto gainers and choose what best fits your strategy.
DOT / TetherUS (DOT) reached the lowest price of 2.000 USDT on Aug 18, 2020. View more DOT / TetherUS dynamics on the price chart.
See the list of crypto losers to find unexpected opportunities.
See the list of crypto losers to find unexpected opportunities.
The safest choice when buying DOT is to go to a well-known crypto exchange. Some of the popular names are Binance, Coinbase, Kraken. But you'll have to find a reliable broker and create an account first. You can trade DOT right from TradingView charts — just choose a broker and connect to your account.
Crypto markets are famous for their volatility, so one should study all the available stats before adding crypto assets to their portfolio. Very often it's technical analysis that comes in handy. We prepared technical ratings for DOT / TetherUS (DOT): today its technical analysis shows the buy signal, and according to the 1 week rating DOT shows the sell signal. And you'd better dig deeper and study 1 month rating too — it's sell. Find inspiration in DOT / TetherUS trading ideas and keep track of what's moving crypto markets with our crypto news feed.
DOT / TetherUS (DOT) is just as reliable as any other crypto asset — this corner of the world market is highly volatile. Today, for instance, DOT / TetherUS is estimated as 7.56% volatile. The only thing it means is that you must prepare and examine all available information before making a decision. And if you're not sure about DOT / TetherUS, you can find more inspiration in our curated watchlists.
You can discuss DOT / TetherUS (DOT) with other users in our public chats, Minds or in the comments to Ideas.