Polkadot (DOT): One Of Coins To Look At During AltseasonOne of the gems for Altcoin Season is seeing good momentum happen if we form an MSB from this zone here.
More in-depth info is in the video—enjoy!
Swallow Academy
Related pairs

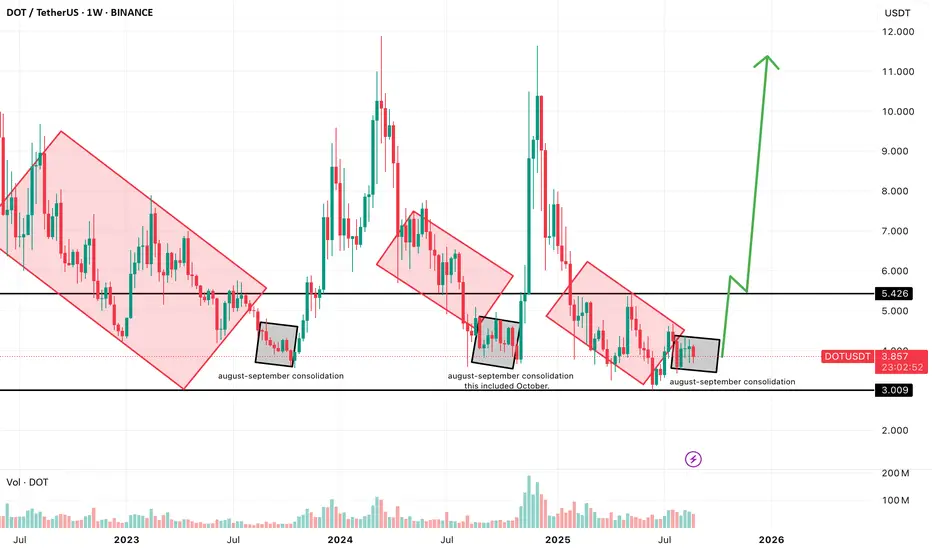
$DOT — August–September Consolidation Setting Up a Q4 RallyPolkadot has shown a repeating seasonal pattern over the past three years: downtrends into late summer, followed by August–September consolidation phases, often setting the stage for Q4 rallies.
Currently, DOT is once again holding the $3.00 major support zone, building a base similar to previous c
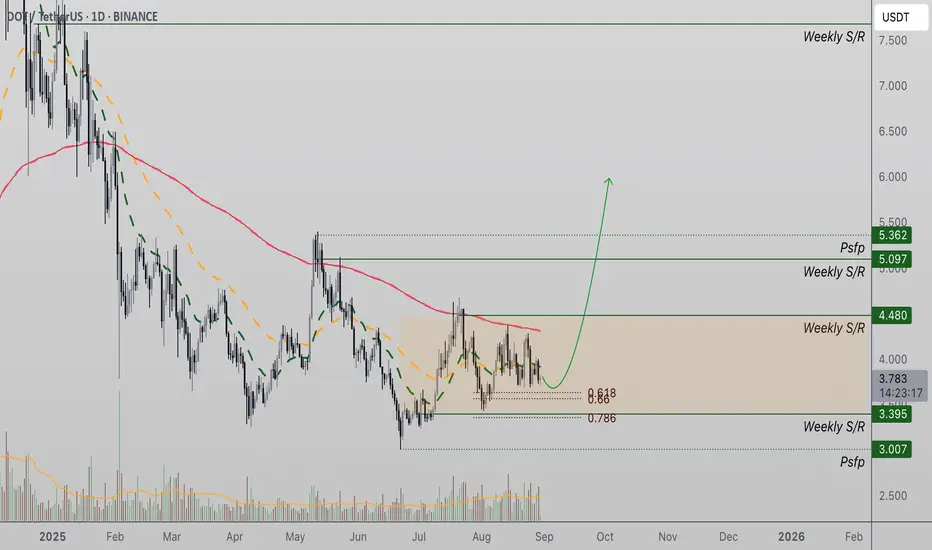
Polkadot Holds $3.75 Support - Buyers Defend Key Technical LevelPolkadot (DOT) has maintained its position above the crucial $3.75 support, a level that continues to highlight strong buyer activity despite recent market pullbacks. This area is shaping up as a pivotal battleground for bulls, potentially setting the stage for further upside if momentum returns.
M
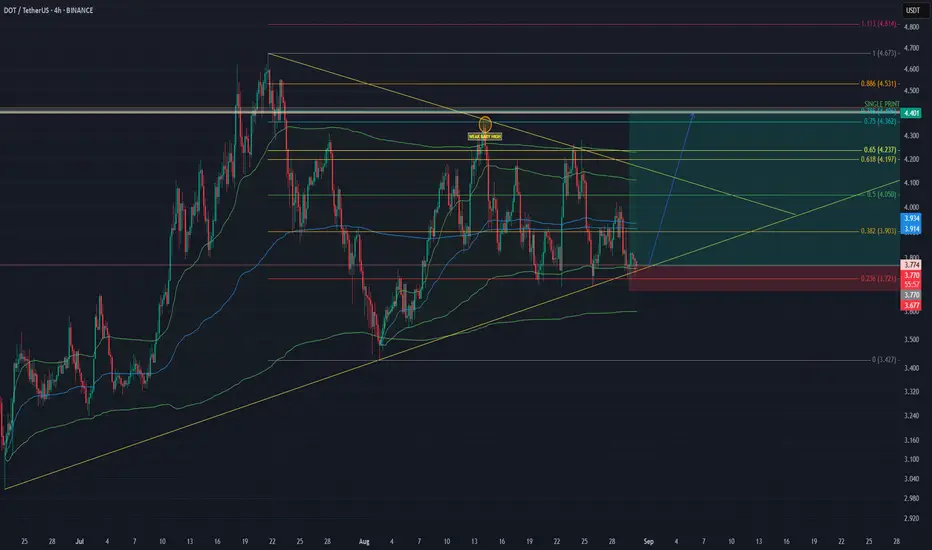
$DOT - LONG - LOADING A SUPER SWEEP?DOT: Loading a SUPER SWEEP? 🚀
Context
Downtrend since 21 Jul → bounce 02 Aug → local high 14 Aug at 0.75 fib → drop & range.
Weak/Bad High (TPO/VP)
No excess at the 14 Aug high (flat top, multiple TPOs, no selling tail) → unfinished business above → likely sweep/revisit.
Magnet
0.7
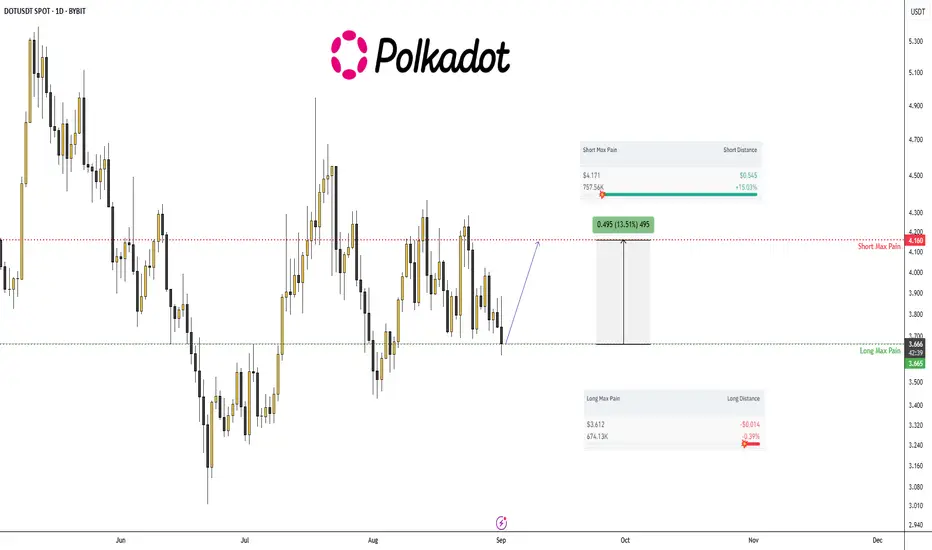
DOT — September 01, 2025.CRYPTOCAP:DOT #Polkadot — September 01, 2025.
Good ol' Polkadot is trading sideways on the daily chart and has hit the Long Max Pain level. I think this is a solid spot entry point with a potential for a +15% move.
Entry price: $3.612 - $3.650
Take Profit: $4.160 (+15.18%)
➖➖➖
Short Max Pain = $4
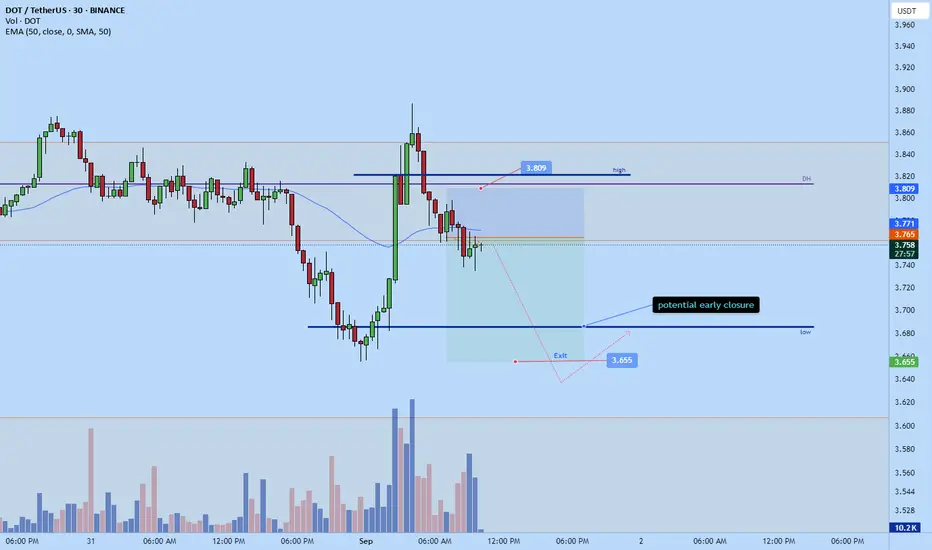
Dotcoin short back to $3.655Just recently opened a short on dotcoin
sl: 3.809
tp: 3.655
potential early exit around $3.685
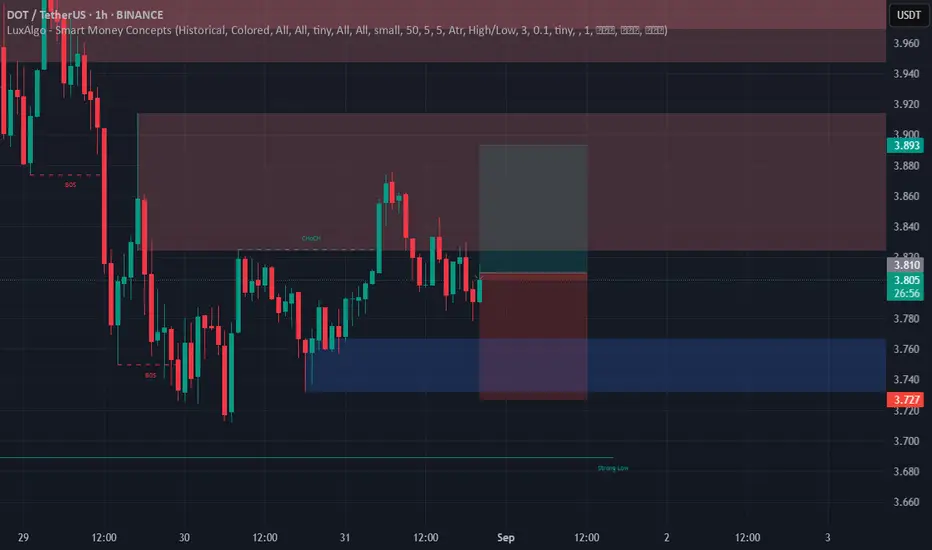
DOTUSDT DOTUSDT
1 Hrs Time Frame
after COACH on 1 hrs time frame its on restest range and CHOCH formed on 5 Minutes time frame I am taking long position with taking 1 person risk.
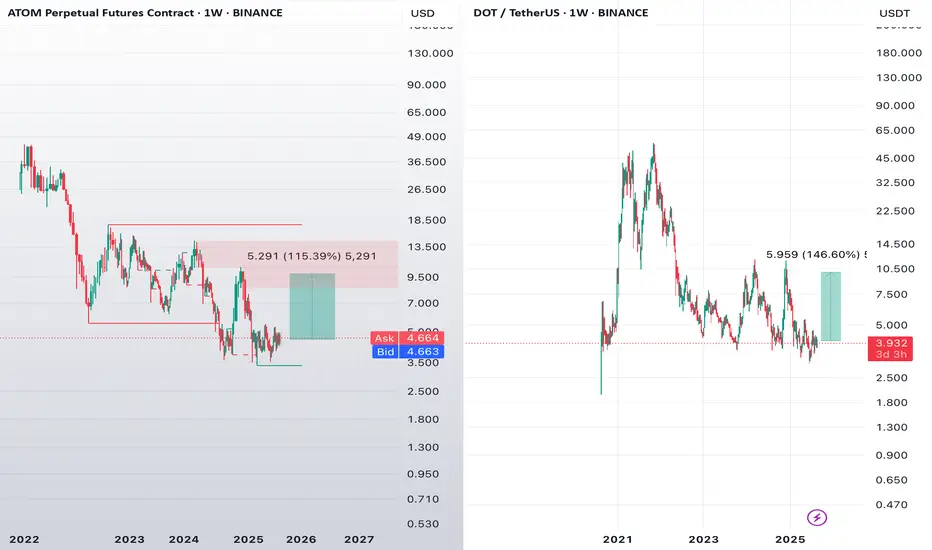
$ATOM vs $DOT — who hits $10 first?💥 NASDAQ:ATOM vs CRYPTOCAP:DOT — who hits $10 first?
Both charts are showing strong recovery potential:
📈 NASDAQ:ATOM → +115% to $10
📈 CRYPTOCAP:DOT → +146% to $10
We're deep in accumulation ranges —
but only one will break out faster.
🧠 My bet is on the one with stronger ecosystem moment
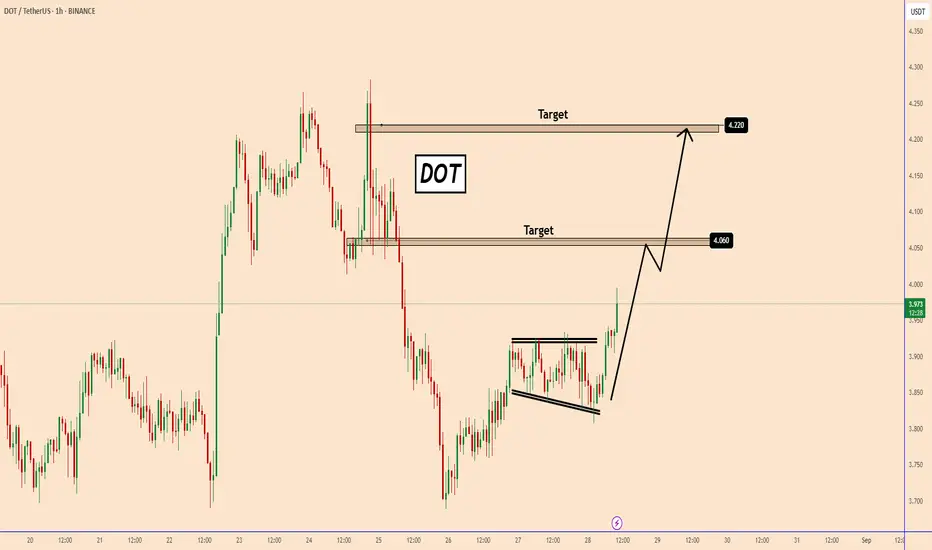
DOT Breaks Out: Short-Term Bullish Setup in PlayDOT Breaks Out: Short-Term Bullish Setup in Play
DOT has completed a bullish flag pattern, and the price has already broken out—confirming upward momentum.
This setup is focused on a short-term trading opportunity.
As long as the price stays above $3.90, the bullish trend remains valid.
📈 Ups
DOT USDT TARGETPrice (USD)
56 ┤ 🎯 Final Long-term Target
50 ┤ ⚡ Strong Resistance / Major Target
45 ┤ 🎯 Extended Mid-term Target
40 ┤ 🎯 Mid-term Target
35 ┤ ⚡ Mid-term Resistance
30 ┤ 🎯 Mid-term Target
25 ┤

See all ideas
Summarizing what the indicators are suggesting.
Oscillators
Neutral
SellBuy
Strong sellStrong buy
Strong sellSellNeutralBuyStrong buy
Oscillators
Neutral
SellBuy
Strong sellStrong buy
Strong sellSellNeutralBuyStrong buy
Summary
Neutral
SellBuy
Strong sellStrong buy
Strong sellSellNeutralBuyStrong buy
Summary
Neutral
SellBuy
Strong sellStrong buy
Strong sellSellNeutralBuyStrong buy
Summary
Neutral
SellBuy
Strong sellStrong buy
Strong sellSellNeutralBuyStrong buy
Moving Averages
Neutral
SellBuy
Strong sellStrong buy
Strong sellSellNeutralBuyStrong buy
Moving Averages
Neutral
SellBuy
Strong sellStrong buy
Strong sellSellNeutralBuyStrong buy
Displays a symbol's price movements over previous years to identify recurring trends.
Frequently Asked Questions
The current price of Polkadot / Tether (DOT) is 3.8138 USDT — it has risen 1.96% in the past 24 hours. Try placing this info into the context by checking out what coins are also gaining and losing at the moment and seeing DOT price chart.
Polkadot / Tether price has fallen by −3.59% over the last week, its month performance shows a 5.99% increase, and as for the last year, Polkadot / Tether has decreased by −5.16%. See more dynamics on DOT price chart.
Keep track of coins' changes with our Crypto Coins Heatmap.
Keep track of coins' changes with our Crypto Coins Heatmap.
Polkadot / Tether (DOT) reached its highest price on Nov 4, 2021 — it amounted to 55.0965 USDT. Find more insights on the DOT price chart.
See the list of crypto gainers and choose what best fits your strategy.
See the list of crypto gainers and choose what best fits your strategy.
Polkadot / Tether (DOT) reached the lowest price of 2.0000 USDT on Aug 21, 2020. View more Polkadot / Tether dynamics on the price chart.
See the list of crypto losers to find unexpected opportunities.
See the list of crypto losers to find unexpected opportunities.
The safest choice when buying DOT is to go to a well-known crypto exchange. Some of the popular names are Binance, Coinbase, Kraken. But you'll have to find a reliable broker and create an account first. You can trade DOT right from TradingView charts — just choose a broker and connect to your account.
Crypto markets are famous for their volatility, so one should study all the available stats before adding crypto assets to their portfolio. Very often it's technical analysis that comes in handy. We prepared technical ratings for Polkadot / Tether (DOT): today its technical analysis shows the sell signal, and according to the 1 week rating DOT shows the sell signal. And you'd better dig deeper and study 1 month rating too — it's sell. Find inspiration in Polkadot / Tether trading ideas and keep track of what's moving crypto markets with our crypto news feed.
Polkadot / Tether (DOT) is just as reliable as any other crypto asset — this corner of the world market is highly volatile. Today, for instance, Polkadot / Tether is estimated as 1.89% volatile. The only thing it means is that you must prepare and examine all available information before making a decision. And if you're not sure about Polkadot / Tether, you can find more inspiration in our curated watchlists.
You can discuss Polkadot / Tether (DOT) with other users in our public chats, Minds or in the comments to Ideas.