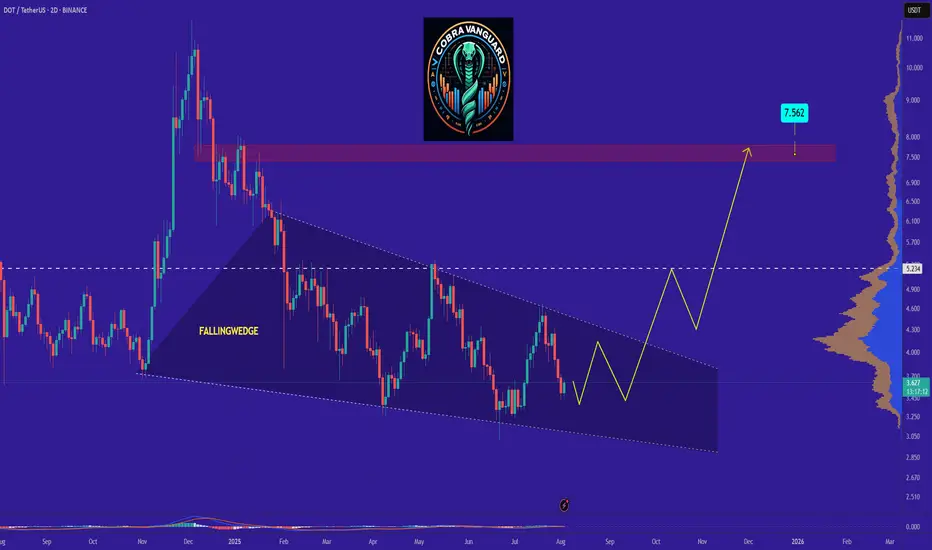
DOT is bullish now and many Traders don't see itSo if you pay attention to the DOT chart you can see that the price has formed a Ascending wedge which means it is expected to price move as equal as the measured price movement.( AB=CD )
NOTE: wait for break of the WEDGE .
Best regards CobraVanguard.💚
Related pairs
Price floor: The opportunity to buy has arrived.Hello friends🙌
According to the decline we had, you can see that the price has reached its historical low, which has given good profits whenever it reaches this low. Now, with capital and risk management, we can buy within the limits of the low and move with it to the specified targets.
🔥Follow us
Polkadot · Trading at Bottom Prices · Bullish Scenario ExplainedThe same levels, the same prices, the same support zone. Polkadot is still trading at bottom prices. From the bottom the market tends to grow.
Good morning my fellow Cryptocurrency trader, I hope you are having a wonderful day. Notice the brown lines on the chart. We have the 7-April low, the June

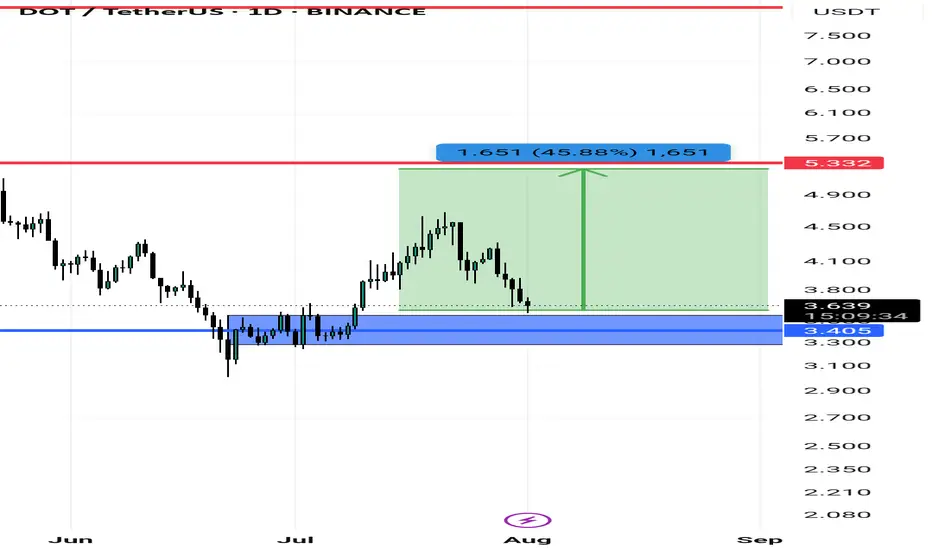
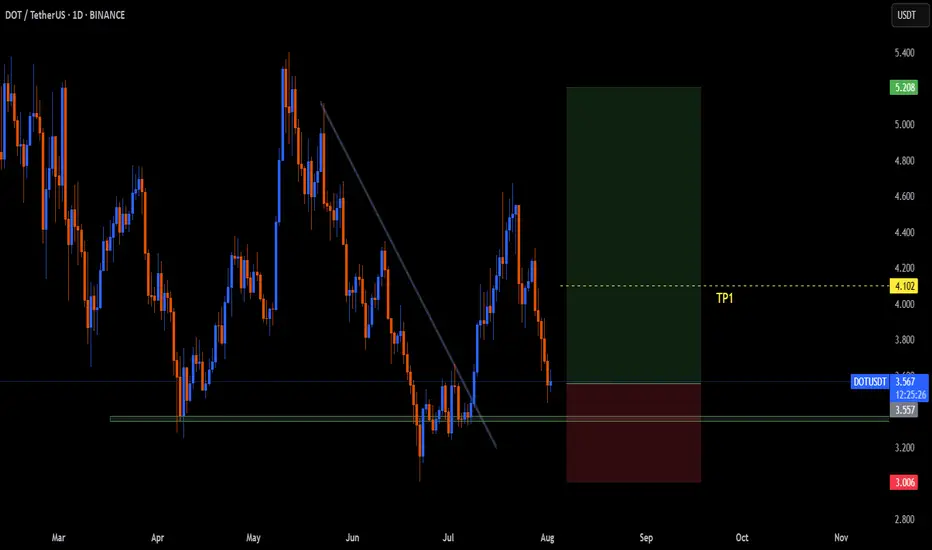
Polkadot (DOT): Aiming To Reach here $5.00-$5.40Polkadot still looks good, even after the pullback, which left the price basically near the area where we started the whole upside game plan. Targets remains the same; R:R for this trade is good as always!
More in-depth info is in the video—enjoy!
Swallow Academy

DOTUSDT On the Edge of a Major Rebound or a Devastating BreakdowPolkadot (DOT) is once again retesting one of its strongest macro support zones between $4.00 – $3.55, a historically significant demand area that has provided major price bounces since mid-2022.
This isn’t just a random level—it’s a critical accumulation base where large buyers have consistently s

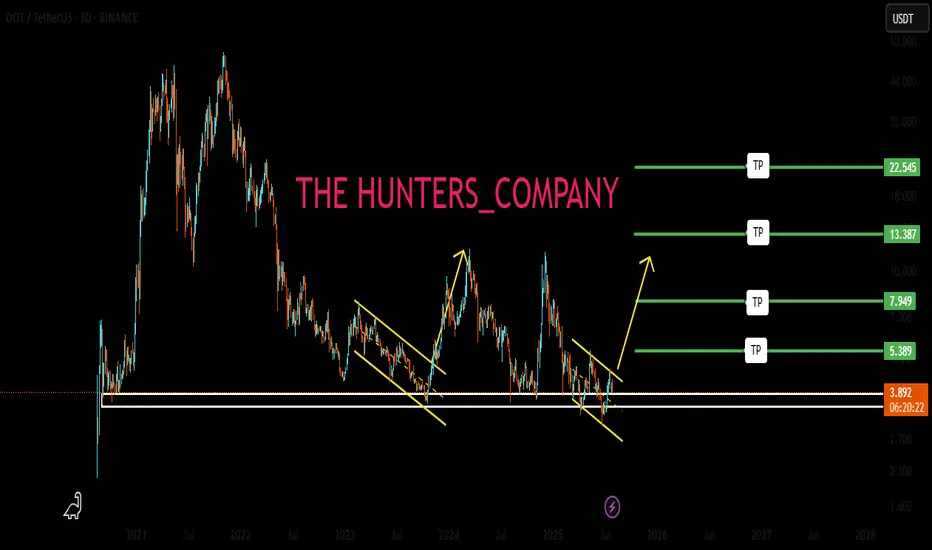
Dot/usdtPolkadot (DOT) cryptocurrency is showing potential for growth from around the $3.40 level.
If the price moves upward, it could potentially reach $5.20, $8, and even $12.
This analysis remains valid as long as the support level at $3.10 holds and no lower low is formed.
Please note: This analysis i
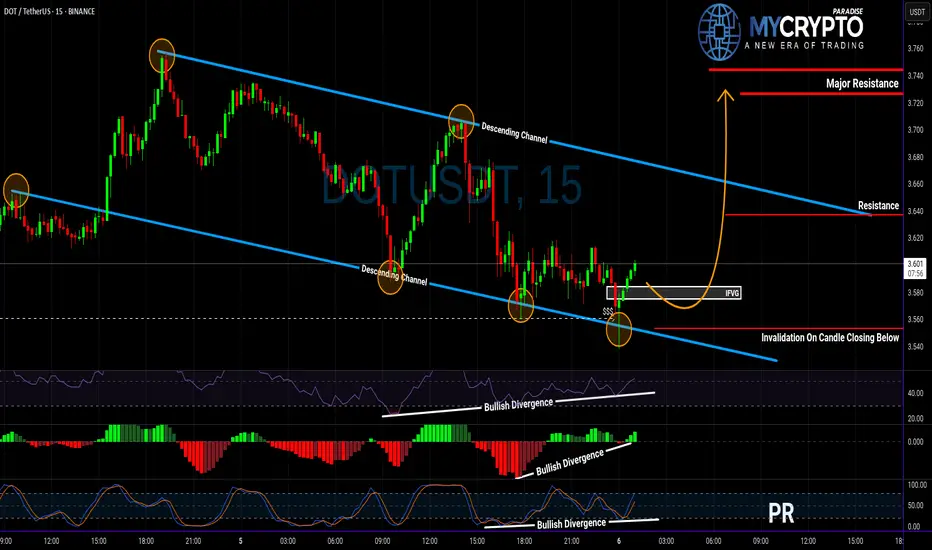
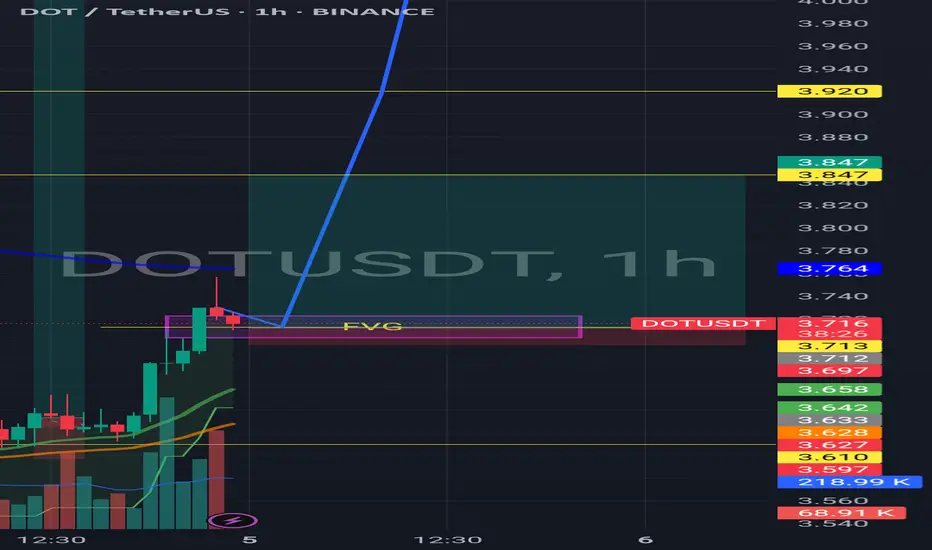
DOT About to Explode or Collapse? Read This Before Entering!Yello Paradisers, are you watching DOT closely? Because this setup could either give aggressive traders a golden entry—or wipe out the impatient ones 👀
💎DOTUSDT is showing strength after sweeping liquidity and now sitting right at the supportive trendline of its descending channel. What’s catching
DOTUSDTThe first higher high after a downtrend indicates a potential trend reversal to the upside. It shows that buyers are starting to regain control, signaling the possibility of a new bullish trend.
Trendline Break: A break above a significant trendline further confirms the shift in sentiment from bear
DOT is sitting at the bottom of the Weekly Channel💰 #DOT is sitting at the bottom of the Weekly Channel👀
Given the fact that market is in correction mode, it's literally the dip🔥
Target: 10$📈

See all ideas
Summarizing what the indicators are suggesting.
Oscillators
Neutral
SellBuy
Strong sellStrong buy
Strong sellSellNeutralBuyStrong buy
Oscillators
Neutral
SellBuy
Strong sellStrong buy
Strong sellSellNeutralBuyStrong buy
Summary
Neutral
SellBuy
Strong sellStrong buy
Strong sellSellNeutralBuyStrong buy
Summary
Neutral
SellBuy
Strong sellStrong buy
Strong sellSellNeutralBuyStrong buy
Summary
Neutral
SellBuy
Strong sellStrong buy
Strong sellSellNeutralBuyStrong buy
Moving Averages
Neutral
SellBuy
Strong sellStrong buy
Strong sellSellNeutralBuyStrong buy
Moving Averages
Neutral
SellBuy
Strong sellStrong buy
Strong sellSellNeutralBuyStrong buy
Displays a symbol's price movements over previous years to identify recurring trends.
Frequently Asked Questions
The current price of Polkadot / Tether US (DOT) is 3.6176 USDT — it has fallen −0.14% in the past 24 hours. Try placing this info into the context by checking out what coins are also gaining and losing at the moment and seeing DOT price chart.
Polkadot / Tether US price has fallen by −7.35% over the last week, its month performance shows a 6.48% increase, and as for the last year, Polkadot / Tether US has decreased by −13.85%. See more dynamics on DOT price chart.
Keep track of coins' changes with our Crypto Coins Heatmap.
Keep track of coins' changes with our Crypto Coins Heatmap.
Polkadot / Tether US (DOT) reached its highest price on Nov 4, 2021 — it amounted to 55.0289 USDT. Find more insights on the DOT price chart.
See the list of crypto gainers and choose what best fits your strategy.
See the list of crypto gainers and choose what best fits your strategy.
Polkadot / Tether US (DOT) reached the lowest price of 3.0040 USDT on Jun 22, 2025. View more Polkadot / Tether US dynamics on the price chart.
See the list of crypto losers to find unexpected opportunities.
See the list of crypto losers to find unexpected opportunities.
The safest choice when buying DOT is to go to a well-known crypto exchange. Some of the popular names are Binance, Coinbase, Kraken. But you'll have to find a reliable broker and create an account first. You can trade DOT right from TradingView charts — just choose a broker and connect to your account.
Crypto markets are famous for their volatility, so one should study all the available stats before adding crypto assets to their portfolio. Very often it's technical analysis that comes in handy. We prepared technical ratings for Polkadot / Tether US (DOT): today its technical analysis shows the strong sell signal, and according to the 1 week rating DOT shows the sell signal. And you'd better dig deeper and study 1 month rating too — it's sell. Find inspiration in Polkadot / Tether US trading ideas and keep track of what's moving crypto markets with our crypto news feed.
Polkadot / Tether US (DOT) is just as reliable as any other crypto asset — this corner of the world market is highly volatile. Today, for instance, Polkadot / Tether US is estimated as 2.21% volatile. The only thing it means is that you must prepare and examine all available information before making a decision. And if you're not sure about Polkadot / Tether US, you can find more inspiration in our curated watchlists.
You can discuss Polkadot / Tether US (DOT) with other users in our public chats, Minds or in the comments to Ideas.