DUSDT Forming Falling WedgeDUSDT is displaying a well-defined falling wedge pattern, which typically signals a strong bullish reversal once a breakout occurs. The structure of this chart suggests that selling momentum is waning while accumulation is gradually increasing. A breakout above the upper resistance of the wedge can

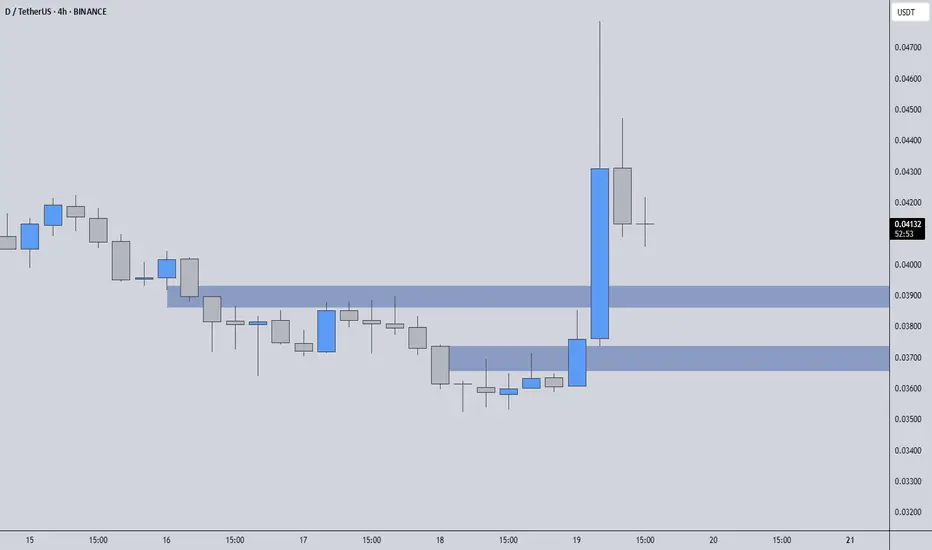
DUSDT | Blue Boxes May Offer a Short-Term OpportunityWhile I have no intention of holding DUSDT for the long term, the recent structure suggests that there could be a second wave of upside potential. The blue boxes on the chart represent areas where buyers have previously stepped in, and they may serve as useful entry zones for short-term positioning.
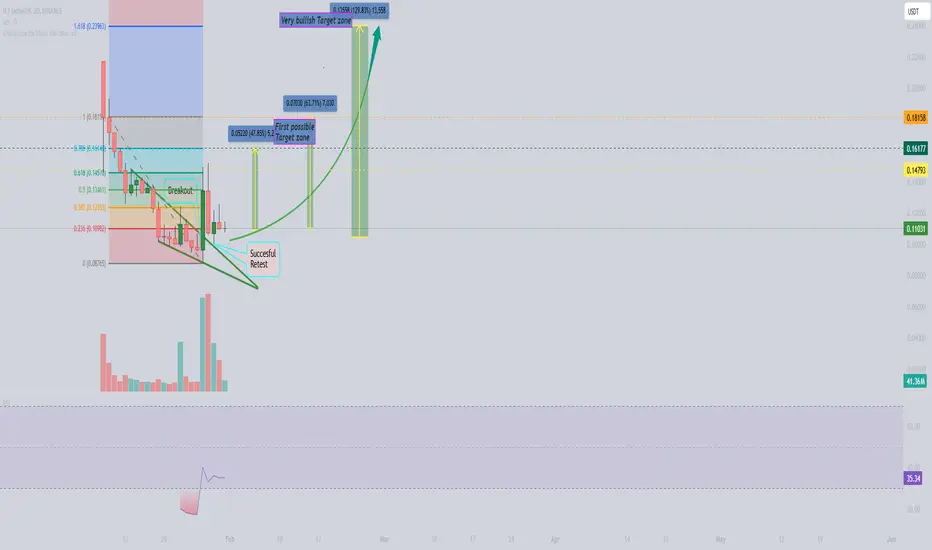
$D / USDT PredictionHello traders,
On the daily chart, we can see a strong breakout accompanied by significant volume and a successful retest. I’ve highlighted a few key inflection points on the chart. Overall, the outlook appears very bullish, and it seems capable of withstanding Bitcoin's sudden price move
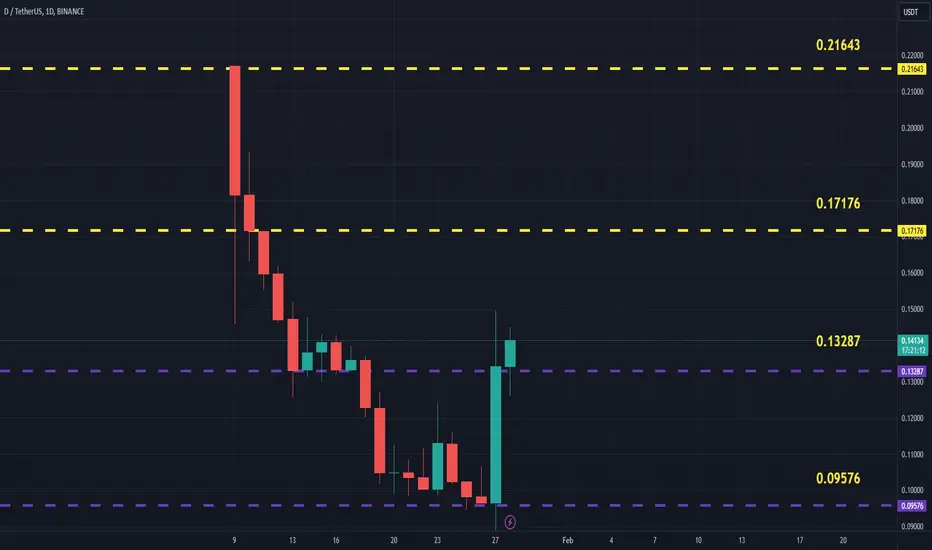
DUSDT Updated till 28-01-25DUSDT Daily timeframe range. PA is fairly new here. it found a new support at 0.09576. below that is price discovery. this kind of price action got lots of opportunity for scalp and swing trades. for further move it needs confirm close above 0.13287.
D/USDTKey Level Zone: 0.12400 - 0.12800
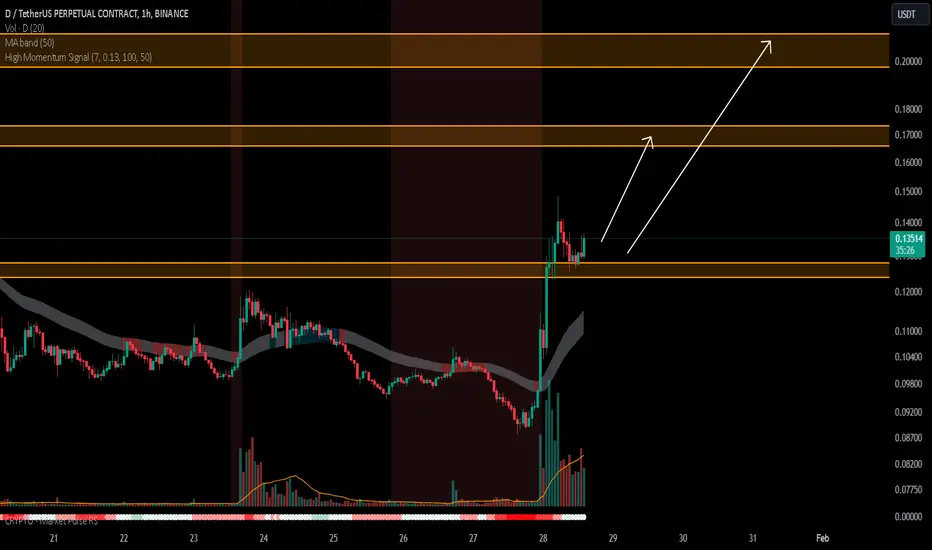
HMT v5 detected. The setup looks promising, supported by a previous upward/downward trend with increasing volume and momentum, presenting an excellent reward-to-risk opportunity.
HMT (High Momentum Trending):
HMT is based on trend, momentum, volume, and market str
See all ideas
Summarizing what the indicators are suggesting.
Oscillators
Neutral
SellBuy
Strong sellStrong buy
Strong sellSellNeutralBuyStrong buy
Oscillators
Neutral
SellBuy
Strong sellStrong buy
Strong sellSellNeutralBuyStrong buy
Summary
Neutral
SellBuy
Strong sellStrong buy
Strong sellSellNeutralBuyStrong buy
Summary
Neutral
SellBuy
Strong sellStrong buy
Strong sellSellNeutralBuyStrong buy
Summary
Neutral
SellBuy
Strong sellStrong buy
Strong sellSellNeutralBuyStrong buy
Moving Averages
Neutral
SellBuy
Strong sellStrong buy
Strong sellSellNeutralBuyStrong buy
Moving Averages
Neutral
SellBuy
Strong sellStrong buy
Strong sellSellNeutralBuyStrong buy