DUSDT Forming Falling WedgeDUSDT is displaying a well-defined falling wedge pattern, which typically signals a strong bullish reversal once a breakout occurs. The structure of this chart suggests that selling momentum is waning while accumulation is gradually increasing. A breakout above the upper resistance of the wedge can unlock a sharp upside move, with a target gain in the range of 90% to 100%+. This projection is consistent with historical price behavior following similar wedge formations.
Volume remains steady, a critical sign that smart money may be quietly building positions before a potential breakout. Technically, DUSDT is positioned at the final stage of the wedge structure, and traders are watching closely for a confirmation candle that could validate the bullish setup. If momentum carries forward, the next resistance levels could be broken swiftly, leading to a fast rally as short positions unwind and new buyers step in.
Investor sentiment toward this project is showing renewed strength, with increasing chatter on social platforms and consistent mentions in altcoin analysis circles. The asset remains underpriced relative to its potential, attracting speculative interest from traders looking for high upside opportunities in smaller-cap pairs.
With bullish technicals aligning and market conditions favoring risk-on plays, DUSDT is worth watching closely. A confirmed breakout could trigger a substantial trend reversal in the coming sessions.
✅ Show your support by hitting the like button and
✅ Leaving a comment below! (What is You opinion about this Coin)
Your feedback and engagement keep me inspired to share more insightful market analysis with you!
DUSDT.P trade ideas

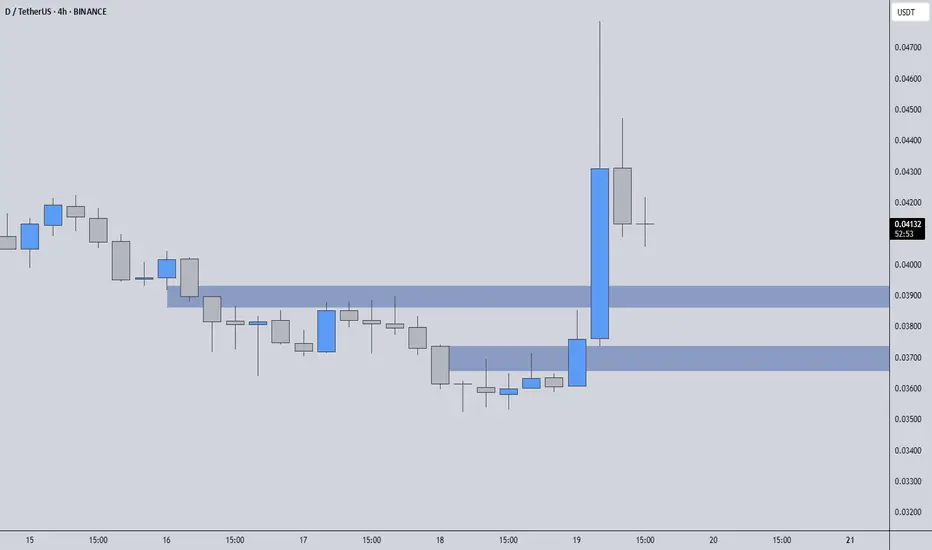
DUSDT | Blue Boxes May Offer a Short-Term OpportunityWhile I have no intention of holding DUSDT for the long term, the recent structure suggests that there could be a second wave of upside potential. The blue boxes on the chart represent areas where buyers have previously stepped in, and they may serve as useful entry zones for short-term positioning.
📌 Short-Term Setup Possibility
If price pulls back into one of these blue boxes and shows signs of strength with lower timeframe confirmation, a trade can be considered to ride the next move up. The goal here isn't to catch a massive breakout, but to participate in a measured reaction from clear demand zones.
📉 Be Realistic With Expectations
This is not a setup where targeting extremely high levels is ideal. Being overly persistent in such structures can quickly turn a smart trade into an emotional one. Take what the market gives and manage risk accordingly.
🧠 Why This Works
This approach isn't random. It's based on the flow of buyers, reaction zones, and a calculated strategy that’s worked time and time again. You’re not just following levels. You’re following experience, precision, and a track record that speaks for itself.
Every level shared here is part of a bigger picture, and if you’re reading this, you already know the difference it makes when you follow someone who actually understands the game.
📌I keep my charts clean and simple because I believe clarity leads to better decisions.
📌My approach is built on years of experience and a solid track record. I don’t claim to know it all but I’m confident in my ability to spot high-probability setups.
📌If you would like to learn how to use the heatmap, cumulative volume delta and volume footprint techniques that I use below to determine very accurate demand regions, you can send me a private message. I help anyone who wants it completely free of charge.
🔑I have a long list of my proven technique below:
🎯 ZENUSDT.P: Patience & Profitability | %230 Reaction from the Sniper Entry
🐶 DOGEUSDT.P: Next Move
🎨 RENDERUSDT.P: Opportunity of the Month
💎 ETHUSDT.P: Where to Retrace
🟢 BNBUSDT.P: Potential Surge
📊 BTC Dominance: Reaction Zone
🌊 WAVESUSDT.P: Demand Zone Potential
🟣 UNIUSDT.P: Long-Term Trade
🔵 XRPUSDT.P: Entry Zones
🔗 LINKUSDT.P: Follow The River
📈 BTCUSDT.P: Two Key Demand Zones
🟩 POLUSDT: Bullish Momentum
🌟 PENDLEUSDT.P: Where Opportunity Meets Precision
🔥 BTCUSDT.P: Liquidation of Highly Leveraged Longs
🌊 SOLUSDT.P: SOL's Dip - Your Opportunity
🐸 1000PEPEUSDT.P: Prime Bounce Zone Unlocked
🚀 ETHUSDT.P: Set to Explode - Don't Miss This Game Changer
🤖 IQUSDT: Smart Plan
⚡️ PONDUSDT: A Trade Not Taken Is Better Than a Losing One
💼 STMXUSDT: 2 Buying Areas
🐢 TURBOUSDT: Buy Zones and Buyer Presence
🌍 ICPUSDT.P: Massive Upside Potential | Check the Trade Update For Seeing Results
🟠 IDEXUSDT: Spot Buy Area | %26 Profit if You Trade with MSB
📌 USUALUSDT: Buyers Are Active + %70 Profit in Total
🌟 FORTHUSDT: Sniper Entry +%26 Reaction
🐳 QKCUSDT: Sniper Entry +%57 Reaction
📊 BTC.D: Retest of Key Area Highly Likely
📊 XNOUSDT %80 Reaction with a Simple Blue Box!
📊 BELUSDT Amazing %120 Reaction!
I stopped adding to the list because it's kinda tiring to add 5-10 charts in every move but you can check my profile and see that it goes on..
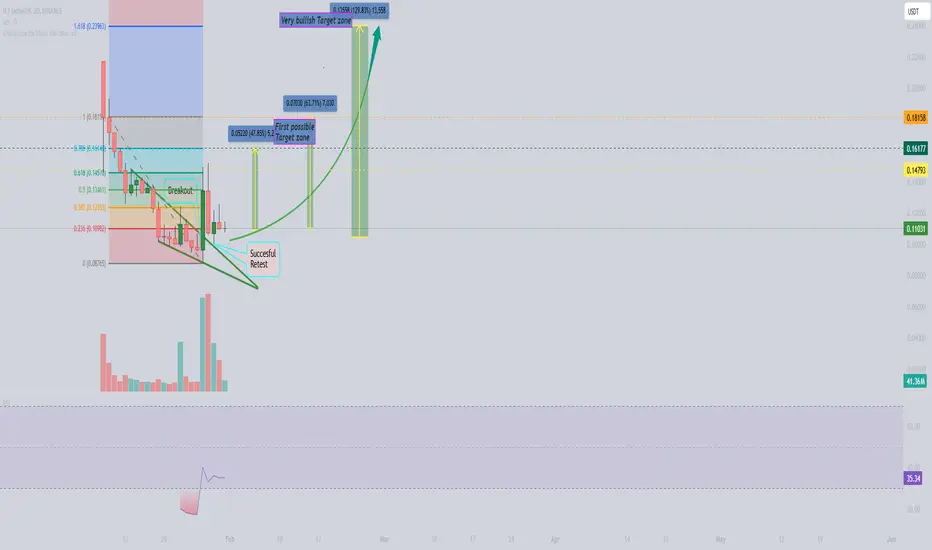
$D / USDT PredictionHello traders,
On the daily chart, we can see a strong breakout accompanied by significant volume and a successful retest. I’ve highlighted a few key inflection points on the chart. Overall, the outlook appears very bullish, and it seems capable of withstanding Bitcoin's sudden price movements. All the indicators are positive. Please make sure to do your own research. I will update this chart as we progress!
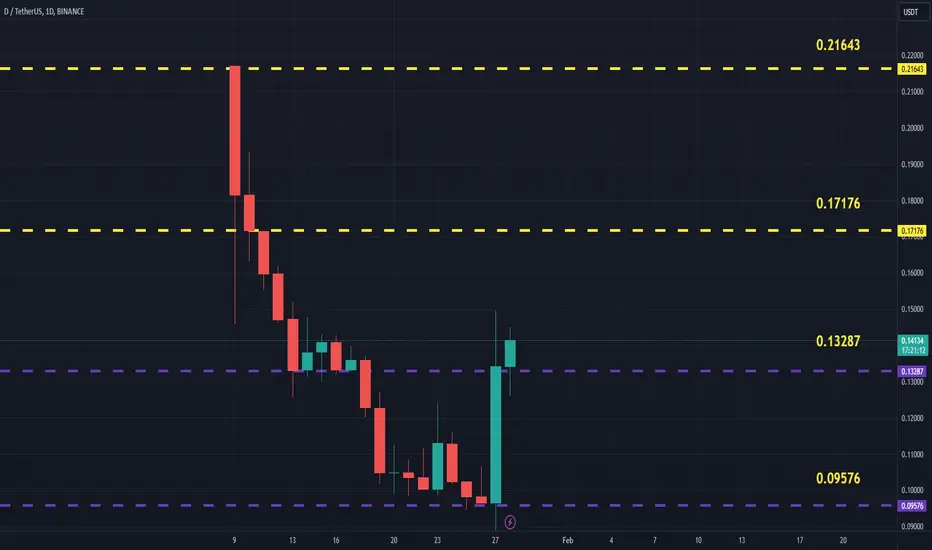
DUSDT Updated till 28-01-25DUSDT Daily timeframe range. PA is fairly new here. it found a new support at 0.09576. below that is price discovery. this kind of price action got lots of opportunity for scalp and swing trades. for further move it needs confirm close above 0.13287.
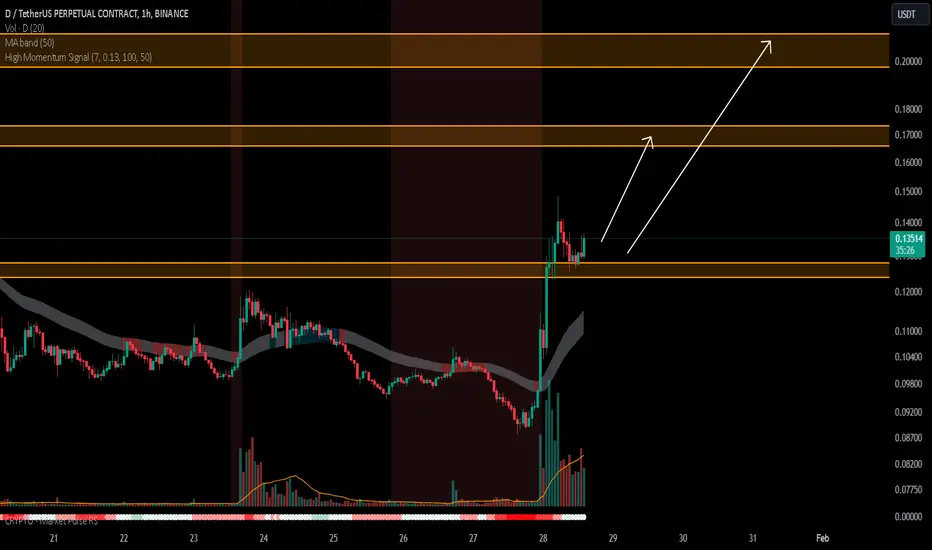
D/USDTKey Level Zone: 0.12400 - 0.12800
HMT v5 detected. The setup looks promising, supported by a previous upward/downward trend with increasing volume and momentum, presenting an excellent reward-to-risk opportunity.
HMT (High Momentum Trending):
HMT is based on trend, momentum, volume, and market structure across multiple timeframes. It highlights setups with strong potential for upward movement and higher rewards.
Whenever I spot a signal for my own trading, I’ll share it. Please note that conducting a comprehensive analysis on a single timeframe chart can be quite challenging and sometimes confusing. I appreciate your understanding of the effort involved.
Important Note :
Role of Key Levels:
- These zones are critical for analyzing price trends. If the key level zone holds, the price may continue trending in the expected direction. However, momentum may increase or decrease based on subsequent patterns.
- Breakouts: If the key level zone breaks, it signals a stop-out. For reversal traders, this presents an opportunity to consider switching direction, as the price often retests these zones, which may act as strong support-turned-resistance (or vice versa).
My Trading Rules
Risk Management
- Maximum risk per trade: 2.5%.
- Leverage: 5x.
Exit Strategy
Profit-Taking:
- Sell at least 70% on the 3rd wave up (LTF Wave 5).
- Typically, sell 50% during a high-volume spike.
- Adjust stop-loss to breakeven once the trade achieves a 1.5:1 reward-to-risk ratio.
- If the market shows signs of losing momentum or divergence, ill will exit at breakeven.
The market is highly dynamic and constantly changing. HMT signals and target profit (TP) levels are based on the current price and movement, but market conditions can shift instantly, so it is crucial to remain adaptable and follow the market's movement.
If you find this signal/analysis meaningful, kindly like and share it.
Thank you for your support~
Sharing this with love!
HMT v2.0:
- Major update to the Momentum indicator
- Reduced false signals from inaccurate momentum detection
- New screener with improved accuracy and fewer signals
HMT v3.0:
- Added liquidity factor to enhance trend continuation
- Improved potential for momentum-based plays
- Increased winning probability by reducing entries during peaks
HMT v3.1:
- Enhanced entry confirmation for improved reward-to-risk ratios
HMT v4.0:
- Incorporated buying and selling pressure in lower timeframes to enhance the probability of trending moves while optimizing entry timing and scaling
HMT v4.1:
- Enhanced take-profit (TP) target by incorporating market structure analysis
HMT v5 :
Date: 23/01/2025
- Refined wave analysis for trending conditions
- Incorporated lower timeframe (LTF) momentum to strengthen trend reliability
- Re-aligned and re-balanced entry conditions for improved accuracy